Abstract
Isoliquiritigenin (2’,4’,4-trihydroxychalcone), a chalcone found in licorice root and shallots, exhibits antioxidant, estrogenic, and anti-tumor activities. To complement our previous studies concerning the phase 1 metabolism of isoliquiritigenin, the phase 2 transformation of isoliquiritigenin by human hepatocytes and pooled human liver microsomes was investigated using liquid chromatography-tandem mass spectrometry and UV absorbance. Five glucuronides were detected corresponding to monoglucuronides of isoliquiritigenin and liquiritigenin, but no sulfate conjugates were observed. The UDP-glucuronosyltransferases (UGTs) involved in the formation of the major glucuronide conjugates were identified using recombinant human UGTs in combination with LC-MS. UGT1A1 and UGT1A9 were the major enzymes responsible for the formation of the most abundant conjugate, isoliquiritigenin 4’-O-glucuronide (MG5) with Km values of 4.30 ± 0.47 µM and 3.15 ± 0.24 µM, respectively. UGT1A1 and UGT1A10 converted isoliquiritigenin to the next most abundant phase 2 metabolite, isoliquiritigenin 2’-O-glucuronide (MG4) with Km values of 2.98 ± 0.8 µM and 25.8 ± 1.3 µM, respectively. In addition, isoliquiritigenin glucuronides MG4 and MG5 were formed by pooled human intestine and kidney microsomes, respectively. Based on the in vitro determination of a 25.3 min half-life for isoliquiritigenin when incubated with human liver microsomes, the intrinsic clearance of isoliquiritigenin was estimated to be 36.4 mL/min/kg. These studies indicate that isoliquiritigenin will be conjugated rapidly in the liver to form up to five monoglucuronides.
Introduction
Chalcones, a group of compounds with two aromatic rings connected by a carbon side chain containing an α,β-unsaturated ketone, are under investigation as cancer chemoprevention agents. Isoliquiritigenin (2,4,4’-trihydroxychalcone) (see structure in Figure 1) is a flavonoid and chalcone found in licorice (Glycyrrhiza uralensis), shallot (Allium ascalonicum), Sinofranchetia chinensis, soybeans (Glycine max L.), and Dalbergia odorifera (Cao et al., 2004; Kape et al., 1992; Kong et al., 2000; Pan et al., 2000; Ramadan et al., 2000). Antioxidant (Vaya et al., 1997) anti-inflammatory (Chan et al., 1998) and estrogenic properties (Maggiolini et al., 2002; Tamir et al., 2001) have been reported for isoliquiritigenin. Anti-cancer activities of isoliquiritigenin include the induction of cell cycle arrest and up-regulation of p21 expression in lung cancer cells (Ii et al., 2004), suppression of pulmonary metastasis of mouse renal cell carcinoma (Yamazaki et al., 2002), induction of apoptosis in human gastric cancer cells (Ma et al., 2001), and inhibition of colon and mammary carcinogenesis in rodent models (Wattenberg et al., 1994; Baba et al., 2002). Another mechanism of chemoprevention by isoliquiritigenin is induction of phase 2 enzymes that protect cells against reactive, toxic, and potentially carcinogenic species (Ross et al., 2000; Cuendet et al., 2006).
Figure 1.
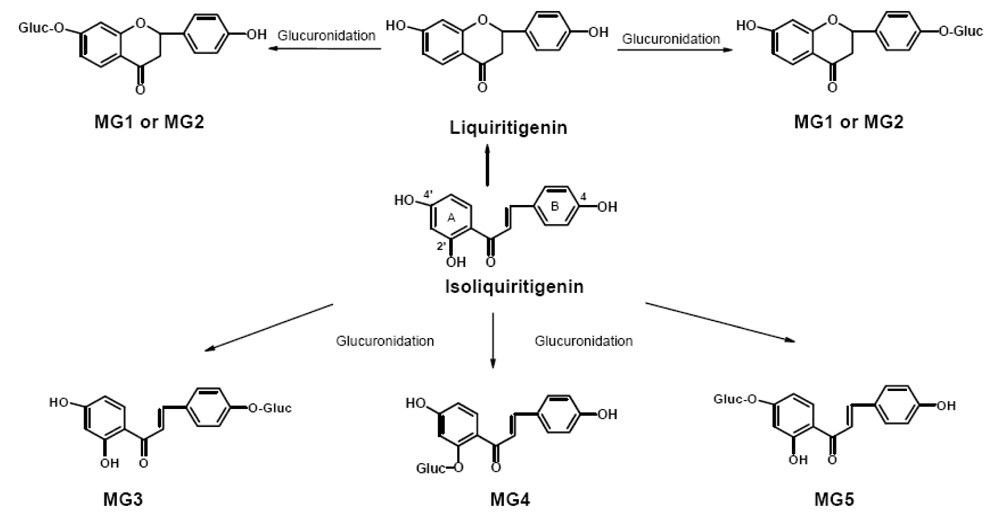
Structures of metabolites and pathways of phase 2 glucuronidation of isoliquiritigenin by human hepatocytes and pooled human liver microsomes in the presence of UDPGA.
Although isoliquiritigenin is a promising anti-tumor agent, its phase 2 metabolism has not been reported. In our previous study, the phase 1 metabolism of isoliquiritigenin by human liver microsomes was investigated, and seven metabolites were observed (Guo et al., 2007). Among these, the monooxygenated metabolites sulfuretin and butein have been reported previously to have antiproliferation and antimutagenic effects (Iwashita et al., 2000; Park et al., 2004). Although phase 1 metabolites often retain biological or pharmacological activity, phase 2 conjugates are usually less active or inactive and are excreted rapidly in urine or bile. Some of the phase 2 enzymes responsible for forming conjugates of xenobiotic compounds include uridine diphosphoglucuronosyl transferase (UGT), sulfotransoferase, N-acetyl transferase, and glutathione S-transferase. In particular, UGTs are quantitatively the most important phase 2 enzymes involved in the inactivation and elimination of anti-cancer drugs and most polyphenolic natural products (Wynalda et al., 2003; Yu et al., 2002; Hariparsad et al., 2006).
The aims of this study were to identify the major phase 2 metabolites of isoliquiritigenin formed in vitro by human hepatocytes and hepatic microsomal enzymes, and to identify the enzymes responsible for the formation of the major conjugates. In addition, the in vitro hepatic clearance of isoliquiritigenin was estimated based on these in vitro data as an indication of the significance of phase 2 metabolism to the elimination of isoliquiritigenin.
Methods
Materials
Isoliquiritigenin was isolated from licorice extract and purified using semi-preparative high performance liquid chromatography (HPLC). Purity was determined to be >98% based on analyses using HPLC with UV absorbance detection (HPLC-UV) and liquid chromatography-mass spectrometry (LC-MS). HPLC-grade solvents were purchased from Fisher Scientific (Pittsburgh, PA). All other chemicals and biochemicals were purchased from Sigma-Aldrich (St. Louis, MO, USA).
Pooled human liver microsomes (HLM), human kidney microsomes, human intestine microsomes, and cryopreserved human hepatocytes were purchased from In Vitro Technologies (Baltimore, MD, USA). The cytochrome P450 content of the microsomes was 0.17 nmol of P450/mg of protein. c-DNA expressed human UGT1A1, 1A3, 1A4, 1A6, 1A7, 1A8, 1A9, 1A10, 2B4, 2B7, 2B15, and 2B17 (5 mg protein/mL), as well as a human UGT control preparation, were purchased from BD Gentest (Woburn, MA, USA). Microcon centrifugal filters containing regenerated cellulose membranes with a 30,000 molecular weight cut-off were purchased from Millipore (Bedford, MA, USA). The glucuronidation activity of each UGT enzyme was confirmed by assay using trifluoperazine (UGT1A4), eugenol (UGT2B17), and 7-hydroxy-4-trifluoromethylcoumarine (UGT1A1, 1A3, 1A6, 1A7, 1A8, 1A9, 1A10, 2B4, 2B7, and 2B15) as substrates according to the protocol provided by BD Gentest.
Phase II metabolism by human hepatocytes
Cryopreserved human hepatocytes were thawed according to the supplier’s instructions, and approximately 1 × 10⁶ cells in a 1-mL suspension were incubated with isoliquiritigenin (10 µM) per well of a 6-well plate. Control experiments were identical except for the substitution of heat-inactivated hepatocytes. The plate was placed in an incubator at 37 °C with 5% CO2 and 90% relative humidity and gently shaken at 50 rpm for 4 h. Incubations were terminated by addition of 3 mL of ice-cold methanol/acetonitrile (1:1, v/v). The cell suspensions were centrifuged, and aliquots of the supernatants were analyzed directly using liquid chromatography-tandem mass spectrometry (LC-MS-MS).
Deconjugation by glucuronidase and sulfatase
A 200 µL aliquot of the hepatocyte incubation was evaporated to dryness and reconstituted in 200 µL ammonium acetate buffer (10 mM, pH 5.0) containing sulfatase (20 units) or a combination of β-glucuronidase (400 units) and sulfatase (40 units). The deconjugation reactions were carried out at 37 °C for 4 h and terminated by the addition of methanol/acetonitrile as described above. After centrifugation, supernatants of each sample were analyzed using LC-MS-MS. Samples that were treated identically except for the addition of hydrolytic enzymes were used as controls.
Glucuronidation of isoliquiritigenin by human liver microsomes, human intestine microsomes, and human kidney microsomes
Glucuronidation was carried out as described previously (Fisher et al., 2000) with some modification. Briefly, 0.5 mg of human liver microsomes, human intestine microsomes, or human kidney microsomes, 25 µg/mL of alamethicin, and 146 µL of 0.1 mM phosphate buffer (pH 7.4) were mixed and placed on ice for 15 min. Next, MgCl2 (8 mM), 5 mM saccharic acid and 10 µM isoliquiritigenin were added to the mixture and pre-incubated at 37 °C for 3 min. Reactions were initiated by adding UDPGA (5 mM final concentration) in a total volume of 200 µL. After 20 min, reactions were terminated by the addition of 0.8 mL ice-cold methanol/acetonitrile (1:1, v/v). After centrifugation to remove the precipitated proteins, the supernatant was evaporated to dryness in vacuo. Each residue was reconstituted in 150 µL of HPLC mobile phase immediately prior to analysis using LC-MS-MS and HPLC-UV. All incubations were carried out at least three times.
To determine the amount of isoliquiritigenin that non-covalently bound to the microsomes, isoliquiritigenin (1 µM) was incubated in 200 µL phosphate buffer at 37 °C for 30 min with human liver microsomes at protein concentrations used for the respective metabolic incubations. The sample was then filtered at 12,000×g using a Microcon centrifugal filter device for 30 min to remove the solvent. The filter membrane was washed three times with water to eliminate unbound isoliquiritigenin. Isoliquiritigenin bound to the microsomes was released by washing the filter with 90% methanol. After evaporation of the methanol from the filtrate, the residue was reconstituted in 200 µL 50% methanol and analyzed for isoliquiritigenin using LC-MS-MS. Control incubations were identical except for the omission of human liver microsomes. Additional control incubations to assess nonspecific binding were carried out using denatured human liver microsomes that were prepared by heating in boiling water.
Glucuronidation by UGTs
The UGTs responsible for the glucuronidation of isoliquiritigenin were identified using cDNA-expressed human UGT1A1, 1A3, 1A4, 1A6, 1A7, 1A8, 1A9, 1A10, 2B4, 2B7, 2B15, and 2B17 (5 mg protein/mL). All incubations were carried out according to the protocol recommended by the supplier (Gentest). In each sample, 0.5 mg protein/mL of UGT, 25 µg/mL of alamethicin, and 146 µL of 0.1 mM phosphate buffer (pH 7.4) were mixed and placed on ice for 15 min. Next, MgCl2 (8 mM), 5 mM saccharic acid and 10 µM isoliquiritigenin were added to the mixture and preincubated at 37 °C for 3 min. Reactions were initiated by adding UDPGA (5 mM final concentration) in a total volume of 200 µL, and the incubations were carried out and terminated as described above for the microsomal incubations prior to analysis using LC-MS-MS. As a negative control, incubations were carried out that were identical except that the microsomes containing recombinant human UGT were replaced by microsomes prepared only from wild-type baculovirus-infected cells. All incubations were carried out at least three times, and the mean values were compared using one-way ANOVA with Tukey’s test, p ≤ 0.01.
Kinetics of isoliquiritigenin glucuronidation
Prior to the kinetics assays, the linearity of formation of the isoliquiritigenin glucuronides was investigated by incubating isoliquiritigenin (10 µM) with human liver microsomes (1.0 mg/mL) up to 50 min and measuring the glucuronides using LC-UV-MS as described below. The formation of all isoliquiritigenin monoglucuronides was linear up to 30 min (data not shown). The linearity of glucuronidation of isoliquiritigenin was also evaluated with respect to protein concentration of human liver microsomes or recombinant UGTs. Based on these preliminary results (data not shown), kinetics studies of the formation of the two most abundant isoliquiritigenin glucuronides (MG4 and MG5) were carried out using human liver microsomes, UGT1A1, UGT1A9, or UGT1A10 at 0.1 mg protein/mL, 0.1 mg protein/mL, 0.25 mg protein/mL, or 0.25 mg/mL, respectively. The concentration of isoliquiritigenin in the incubations ranged from 0.1–100 µM and 0.5–100 µM for assays using human liver microsomes and UGT isoforms, respectively. The incubation temperature was 37 °C, and the incubation time was 20 min.
Kinetic parameters were estimated from the fitted curves using SigmaPlot 9.0 software (Richmond, CA, USA). The Michaelis-Menten equation (eq. 1), substrate inhibition (a process in which metabolic rate decreases at high substrate concentration; eq. 2), or the Hill equation (eq. 3) was used to describe the kinetics of isoliquiritigenin glucuronidation as follows:
| (1) |
| (2) |
| (3) |
In these equations, V is the rate of the reaction, Vmax is the maximum velocity, Km is the Michaelis constant, [S] is the substrate concentration, Ksi is the constant describing the substrate inhibition interaction, S50 is the substrate concentration producing 50% of Vmax (analogous to the Km), and n is the Hill coefficient.
Metabolic stability
In metabolic stability experiments, isoliquiritigenin (1 µM) was incubated with human liver microsomes (1 mg protein/mL) according to the method described above. The total incubation volume was 800 µL. Aliquots (100 µL each) were removed at 0, 5, 10, 20, 30, 40, or 50 min, and the reaction was terminated by addition of 400 µL ice-cold methanol/acetonitrile (1:1, v/v). After centrifugation to remove the precipitated proteins, the supernatant was evaporated to dryness in vacuo. Each residue was reconstituted in 100 µL of HPLC mobile phase containing eriodictyol (1.0 µM) as an internal standard immediately before the measurement of residual isoliquiritigenin using LC-MS-MS.
LC-UV-MS and LC-MS-MS
Reversed-phase HPLC separations were carried out using a Zorbax (Waters, Milford, MA) SB 2.1 × 100 mm C18 column (3.5 µm particle size) connected to a Waters 2690 HPLC system. A linear gradient was used at 0.2 mL/min from 0.1% formic acid in water to methanol as follows: 20 to 70% methanol over 25 min, and then 70 to 95% methanol over the next 5 min. The column was re-equilibrated for 7 min between injections. The column temperature was 30 °C, and the autosampler was maintained at 4 °C. Accurate mass and product ion tandem mass spectra were obtained using a Micromass (Manchester, UK) Q-TOF-2 hybrid quadrupole/time-of-flight mass spectrometer with negative ion electrospray. The ion source parameters included a capillary voltage of 2.5 kV, a cone voltage of 30 V, a source block temperature of 120 °C, and a drying gas temperature of 320 °C. Tandem mass spectra were acquired at a collision energy of 25 eV using argon as the collision gas at a pressure of 2.0 × 10⁻⁵ mBar.
Quantitation of isoliquiritigenin and its monoglucuronides was carried out using LC-MS-MS with negative ion electrospray and selected reaction monitoring on an Applied Biosystems (Foster City, CA, USA) API 4000 triple quadrupole mass spectrometer. The HPLC system consisted of a Shimadzu (Columbia, MD, USA) LC-10ADvp pumps, an LC PAL autosampler (CTC Analytics AG, Switzerland), and a Zorbax SB 2.1 × 100 mm C18 column (3.5 ìm particle size). Separations were carried out using a 20 min linear gradient from 20 to 70% methanol with a co-solvent of 0.1 % formic acid in water followed by a 5 min gradient from 70 to 90 % methanol at a flow rate of 0.2 mL/min. The column and autosampler were maintained at room temperature. Nitrogen was used for nebulization as well as the drying and collision gas. The collision energy was −30 eV for isoliquiritigenin and −20 eV for eriodictyl, and the dwell time was 500 ms/ion. During selected reaction monitoring, isoliquiritigenin, isoliquiritigenin monoglucuronides and eriodictyol (internal standard) were measured using the ion transitions of m/z 255 to 119, m/z 431 to 255 and m/z 287 to 151, respectively. Alternatively, LC-UV-MS was used with selected ion monitoring of m/z 255 and 431 for isoliquiritigenin and isoliquiritigenin monoglucuronide, respectively, on an Agilent (Palo Alto, CA, USA) G1946A quadrupole mass spectrometer and 1100 HPLC system. Ultraviolet spectra were acquired over the range 210–400 nm using an Agilent photodiode array detector.
Since the maximum UV absorbance of the isoliquiritigenin monoglucuronides (MG4 and MG5) is close to that of isoliquiritigenin, the quantitative analysis of these metabolites was carried out using HPLC-UV. Assuming that isoliquiritigenin and its glucuronides have similar ε values, UV spectra were recorded from 364–380 nm (encompassing the UV maxima), and standard curves were prepared using isoliquiritigenin at concentrations from 0.5 to 100 µM.
Calculation of intrinsic clearance
If isoliquiritigenin is eliminated primarily as phase 2 conjugates, then metabolic stability studies based on the rate of disappearance of isoliquiritigenin in a microsomal model that includes glucuronidation can be used to estimate the in vitro hepatic intrinsic clearance. Therefore, the estimate of intrinsic clearance of isoliquiritigenin was based on substrate disappearance during 50 min incubations with pooled human liver microsomes. The results were converted to the percentage of substrate remaining, using t = 0 as 100%. The slope of the linear regression analysis of the plot of log percentage remaining versus incubation time relationships (−k) was used in the conversion to in vitro half-life using the equation, t1/2 = −0.693 / k. The intrinsic clearance (CL’int, mL/min/kg) was calculated from the following equation:
| (4) |
Values of 45 mg protein/g liver and 20 g of human liver weight per kilogram body weight were used (Soars et al., 2002). The fraction unbound in the incubation mixture (fui) was calculated by using equation 5 as follows:
| (5) |
Results
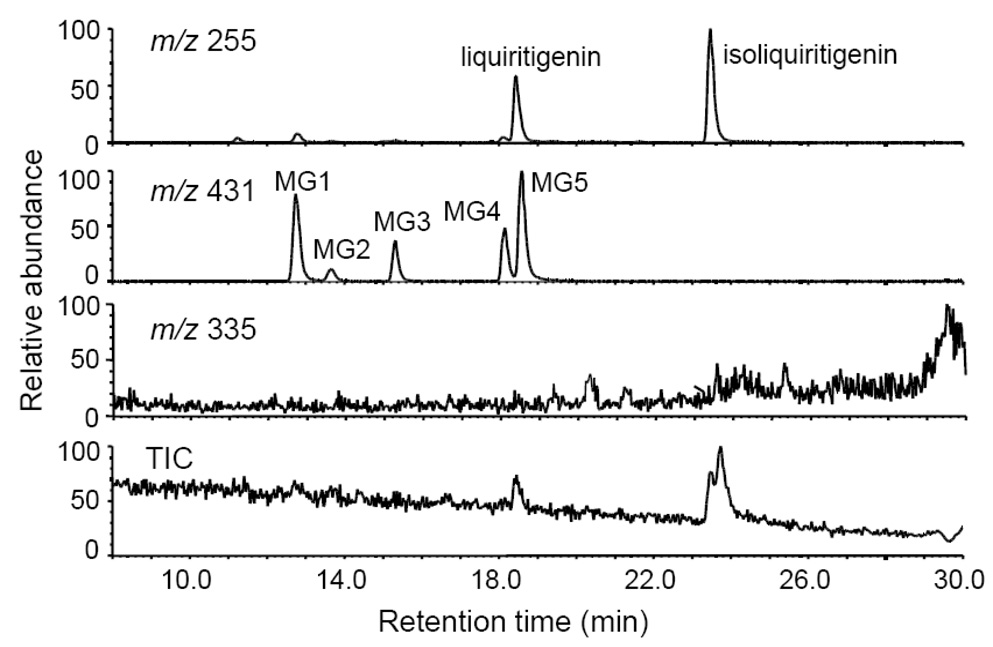
The total ion chromatogram and computer reconstructed select ion chromatograms for the negative ion electrospray LC-MS-MS analysis of metabolites from an incubation of isoliquiritigenin with human hepatocytes are shown in Figure 2. Five major peaks were detected as deprotonated molecules of m/z 431 eluting at retention times of 12.7, 13.7, 15.3, 18.1, and 18.6 min. Since this mass was 176 mass units higher than isoliquiritigenin, these metabolites, designated as MG1, MG2, MG3, MG4, and MG5 (most abundant) in Figure 2, were probably monoglucuronides. The exact mass of the deprotonated molecules of each of these metabolites was identical at m/z 431.0992 which was within 3.2 ppm of the theoretical molecular formula of C21H20O10 for isoliquiritigenin monoglucuronide. Since treatment with β-glucuronidase caused all of these peaks to disappear, this confirmed the identification of these metabolites as glucuronides. Note that no sulfate conjugates of isoliquiritigenin were detected at m/z 335 (Figure 2). The phase 1 metabolites of isoliquiritigenin formed during incubation with human liver microsomes and NADPH, which had been reported previously (Guo et al., 2007), were not observed after incubation with human hepatocytes.
Figure 2.
Computer-reconstructed mass chromatograms and the total ion chromatogram (TIC) for the negative ion LC-MS analysis of isoliquiritigenin after incubation with human hepatocytes. The metabolites MG3, MG4 and MG5 were identified as isoliquiritigenin 4-, 2’-, and 4’-O-glucuronide, respectively. No sulfate conjugates were observed.
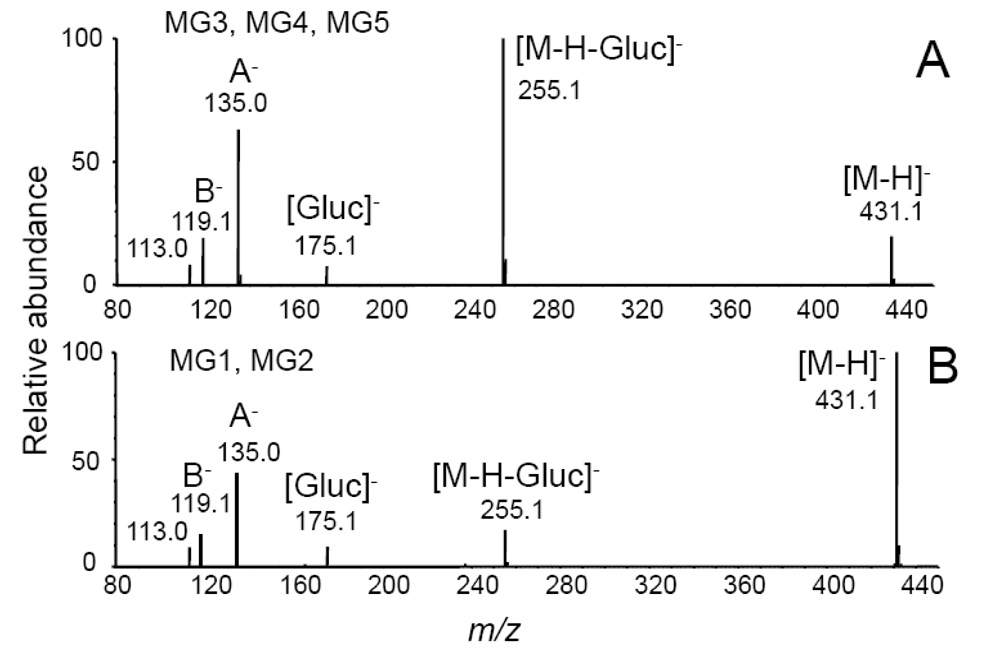
The product ion tandem mass spectra of MG1 and MG2 were identical, and the tandem mass spectra of MG3-MG5 were identical as shown in Figure 3. The base peak of the tandem mass spectra of MG3, MG5 and MG5 was observed at m/z 255 and corresponded to loss of dehydrated glucuronic acid, [M-H-Gluc]−. Ions of lower abundance were detected at m/z 175 and 113 corresponding to dehydrated glucuronate and a fragment ion of the glucuronic acid moiety, respectively (Nikolic, et al., 2006). In addition to the aglycon ion of m/z 255 corresponding to the mass of deprotonated isoliquiritigenin, fragment ions were observed at m/z 135 and m/z 119 corresponding to the A-ring and B-ring of isoliquiritigenin, respectively (see structure of isoliquiritigenin and designations of the A-ring and B-ring in Figure 1). The product ions in the tandem mass spectra of MG1 and MG2 were identical, although the relative abundances of these ions differed from those of MG3-MG5 (Figure 3). Since conjugation of isoliquiritigenin at any of three phenolic oxygens could produce only three monoglucuronides, two of these glucuronides detected during LC-MS analysis (Figure 2) might be conjugates of liquiritigenin, a flavanone derivative of isoliquiritigenin, which was found previously in incubations of human liver microsomes with isoliquiritigenin (Guo et al., 2008).
Figure 3.
Negative ion electrospray product ion tandem mass spectra with CID of the deprotonated monoglucuronides A) MG5 of isoliquiritigenin (note that MG3 and MG4 produced identical tandem mass spectra); and B) MG1 of liquiritigenin (note that the tandem mass spectrum of MG2 was identical). [Gluc]− represents the deprotonated molecule of glucuronic acid. A− and B− are fragment ions corresponding to the A-ring and B-ring, respectively (see ring structures in Figure 1).
Although isoliquiritigenin conjugates in the incubation with human hepatocytes could be identified as monoglucuronides based on LC-MS-MS and hydrolysis by β-glucuronidase, the position of glucuronidation of isoliquiritigenin could not be determined based on these data. Therefore UV spectroscopy was used to determine the site of substitution on this flavonoid according to published guidelines (Alonso-Salces et al., 2004; Markham, 1980; Otake et al., 2002). A chalcone, isoliquiritigenin contains two aromatic rings connected by an α,β-unsaturated ketone. UV spectra of chalcones exhibit two major absorption peaks in the region 240–400 nm, Band I (300–380 nm) and Band II (240–280 nm) which are associated with the B-ring and A-ring, respectively (Markham, 1980). This conjugated system can be energetically stabilized by delocalization of unpaired electrons from the 4-OH oxygen into the aromatic ring. In addition, the formation of an intramolecular hydrogen bond between the 2’-OH hydrogen and the oxygen of the neighboring ketone can also stabilize this conjugated system. Therefore, glucuronidation at either the 4-OH or 2’-OH position would interrupt this stability, resulting in a UV band shift relative to unconjugated isoliquiritigenin. However, this shift would be most pronounced for glucuronidation at the 4-OH position.
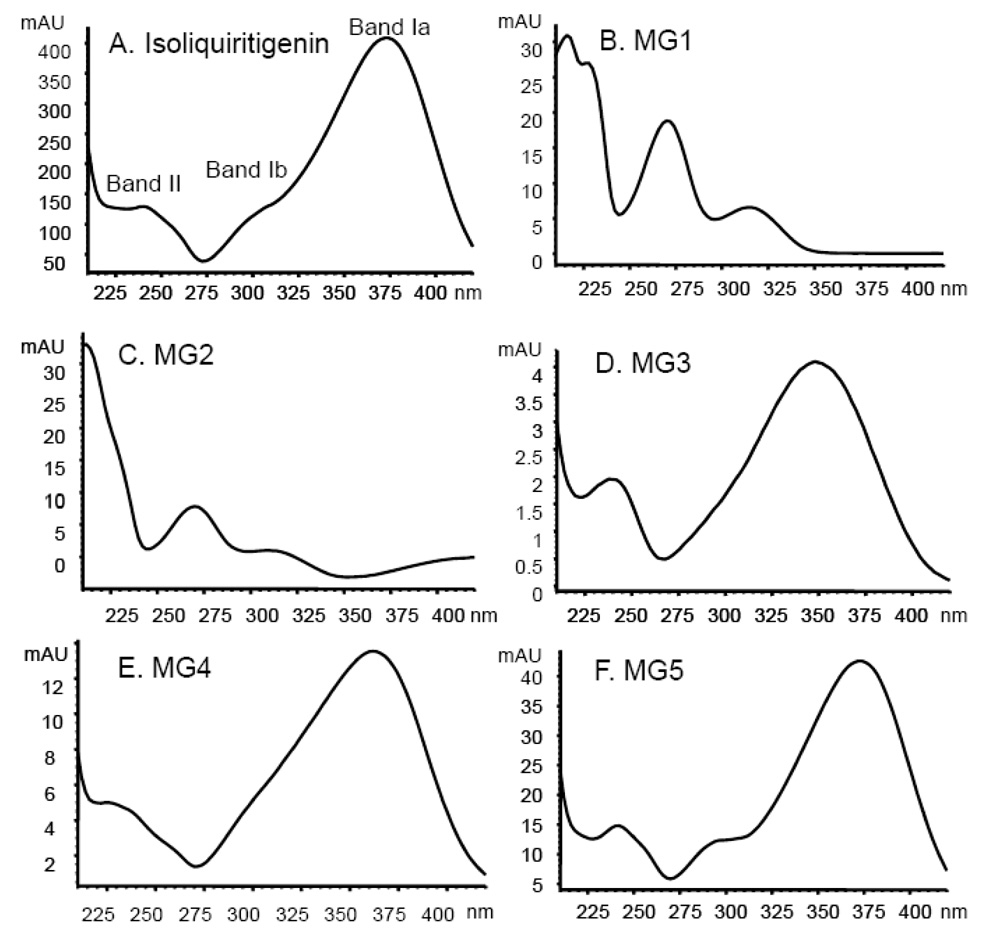
During LC-UV-MS and LC-MS-MS analyses, a particular metabolite (such as MG5), produced identical retention times, tandem mass spectra, and UV spectra whether it was generated using human hepatocytes or human liver microsomes (with added UDPGA). One set of the UV-vis spectra of the five glucuronides MG1-MG5 is shown in Figure 4. The UV spectrum of isoliquiritigenin exhibited three specific bands, Band Ib (300 nm), Band Ia (372 nm) and Band II (240 nm), with Band Ia being the most intense (Figure 4A). MG1 and MG2 (Figure 4B and 4C) were easily distinguished from isoliquiritigenin by their UV spectra, since Band II (270 nm) was the most intense and Band I was absent. Therefore, MG1 and MG2 lacked conjugation between the A-ring and B-ring and were no longer chalcones (see structures in Figure 1). Instead, MG1 and MG2 were monoglucuronides of liquiritigenin that were formed by conjugation at either the 4-OH or 4’-OH position. However, which metabolite, liquiritigenin 4-O-glucuronide or liquiritigenin 4’-O-glucuronide, corresponded specifically to MG1 and MG2 could not be determined from these data.
Figure 4.
UV spectra of isoliquiritigenin and its monoglucuronides. The UV spectra were obtained using a photodiode array detector over the range 210 to 400 nm. Band I (300–380 nm) and Band II (240–280 nm) are associated with the B-ring and A-ring, respectively.
Shown in Figure 4F, the UV spectrum of MG5 was identical to that of isoliquiritigenin which indicated that MG5 is isoliquiritigenin 4’-O-glucuronide, since conjugation at the 4’-OH position will not affect its UV absorption (Markham, 1980). The UV spectrum of MG3 (Figure 4D) showed a Band I (352 nm) with a large hypsochromic shift (20 nm) and lower intensity than that of isoliquiritigenin associated with glucuronidation at the 4-OH position (Markham, 1980). Therefore, MG3 was identified as isoliquiritigenin 4-O-glucuronide. The UV spectrum of MG4 exhibited a smaller hypsochromic shift (10 nm) of Band I, associated with glucuronidation at the 2’-OH position (Figure 4E). Therefore, MG4 was determined to be isoliquiritigenin 2’-O-glucuronide.
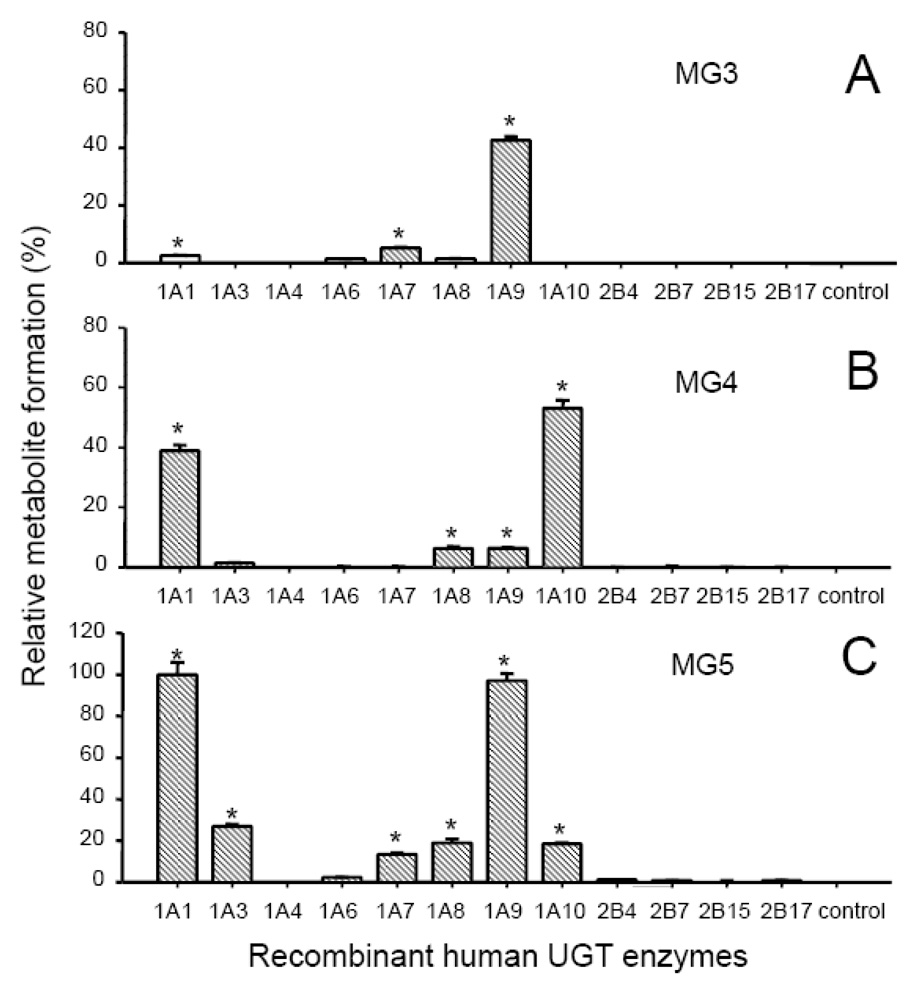
To identify the UGT enzymes responsible for the formation of the three most abundant monoglucuronides of isoliquiritigenin (MG3, MG4 and MG5), isoliquiritigenin was incubated with the recombinant human UGT enzymes, UGT1A1, 1A3, 1A4, 1A6, 1A7, 1A8, 1A9, 1A10, 2B4, 2B7, 2B15, and 2B17 which represent the most abundant hepatic isoforms (Fisher et al., 2001). The results of these assays are shown in Figure 5. UGT1A9 was the most significant enzyme contributing to the formation of MG3, isoliquiritigenin 4-O-glucoronide. Among the 12 UGT enzymes assayed, UGT1A1 and UGT1A10 were the most active in forming MG4, and UGT1A10 showed the greatest catalytic activity. UGT1A8 and UGT1A9 displayed some activity for M4 formation, but only ~10% as much as UGT1A10 (Figure 5). MG5 formation was catalyzed most efficiently by UGT1A1 and UGT1A9 with UGT1A3, 1A7, 1A8, and 1A10 showing weak to moderate activity. Both UGT1A9 and UGT1A10 catalyzed the formation of MG4 and MG5 from isoliquiritigenin but in different ratios corresponding to 0.06 (MG4/MG5) for UGT1A9 and 2.9 for UGT1A10. In addition, UGT1A9 but not UGT1A10 catalyzed the glucuronidation of MG3.
Figure 5.
Relative formation of isoliquiritigenin metabolites by recombinant UGT enzymes (0.5 mg protein/mL). In each sample, recombinant UGT was incubated with 10 µM isoliquiritigenin at 37 °C for 20 min in the presence of UDPGA (5 mM). A) MG3 formation; B) MG4 formation; and C) MG5 formation. The control incubations contained no enzymes.
*Significant difference compared to the control as determined using one-way ANOVA with the Tukey’s test, p ≤ 0.01 (Mean ± Std. Error; N = 3). All data were normalized to the yield of MG5 (100%) catalyzed by UGT1A10.
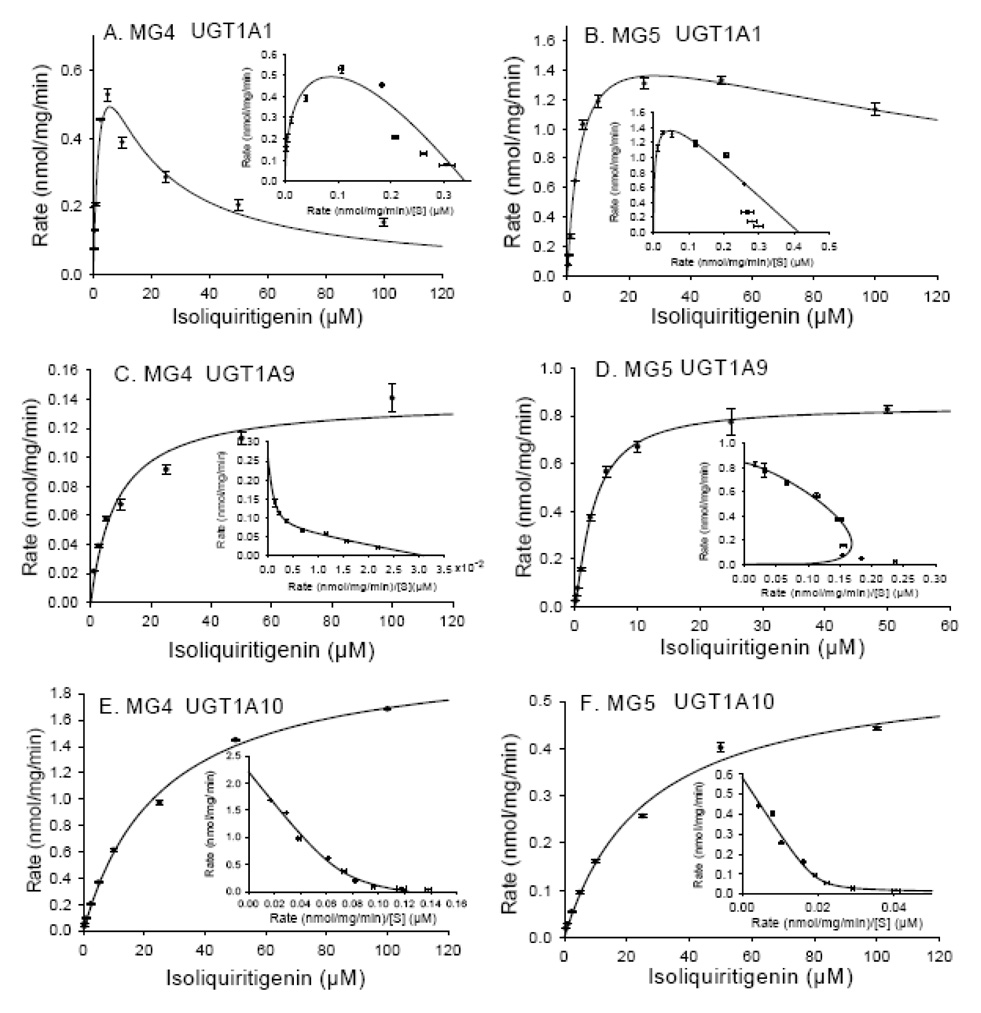
The kinetics of formation of the two most abundant glucuronides of isoliquiritigenin, MG4 and MG5, were also investigated using the recombinant UGTs, UGT1A1, UGT1A9, and UGT1A10, that were found to be the most efficient for this process. These results are shown in Figure 6A and 6B and Table 1. The formation of MG4 and MG5 by UGT1A1 fits the substrate inhibition model with R2 values of 0.982 and 0.996, respectively. In particular, the Eadie-Hofstee plot (v/S ratio on the x-axis and v on the y-axis) showed a hook pattern in the upper quadrant (see Figure 6A and 6B). Although the Km and Vmax values for MG4 and MG5 formation were comparable, the Ksi for MG4 (10.89 ± 2.92 µM) was much lower than that of MG5 (189.1 ± 36.0 µM) (Table 1).
Figure 6.
Enzyme kinetics of MG4 and MG5 formation by (A and B) UGT1A1; (C and D) UGT1A9; and (E and F) UGT1A10. Eadie-Hofstee plots are shown as inserts on each graph. The solid lines represent the curve fit to the corresponding enzyme kinetic equation. The data represent the Mean ± Std. Error of triplicate measurements.
Table 1.
Kinetic parameters of isoliquiritigenin glucuronidation by human liver microsomes (HLM) and recombinant UGT enzymes.
| Enzyme | Metabolite | Km or S50 | Vmax | CLint | Ksi | |
|---|---|---|---|---|---|---|
| (µM) | (nmol/min/mg protein) | (µL/min/mg protein) | (µM) | |||
| HLM | MG4 a | 2.84 ± 0.42 | 0.25 ± 0.01 | 88.0 | 168.34 ± 39.52 | |
| MG5 a | 8.42 ± 1.21 | 1.47 ± 0.11 | 174.6 | 143.53 ± 31.36 | ||
| UGT1A1 | MG4 a | 2.98 ± 0.80 | 1.01 ± 0.16 | 338.9 | 10.89 ± 2.92 | |
| MG5 a | 4.30 ± 0.47 | 1.77 ± 0.08 | 411.6 | 189.1 ± 36.0 | ||
| UGT1A9 | MG4 b | 8.59 ± 1.43 | 0.14 ± 0.01 | 16.3 | ||
| MG5 c | 3.15 ± 0.24 | 0.86 ± 0.02 | 273.0 | |||
| UGT1A10 | MG4 b | 25.75 ± 1.28 | 2.13 ± 0.04 | 89.3 | ||
| MG5 b | 26.15 ± 2.25 | 0.57 ± 0.02 | 21.8 | |||
Each value represents Mean ± Std. Error (N = 3)
Substrate inhibition
Michaelis-Menten
Hill equation (n = 1.20 ± 0.08)
The formation of MG4 by UGT1A9 followed Michaelis-Menten kinetics (R2 = 0.984) with a Km value of 8.59 ± 1.43 µM and a Vmax of 0.14 ± 0.01 nmol/min/mg protein (Table 1). An Eadie-Hofstee plot (Figure 6C) was biophasic, suggesting that more than one enzyme or active site participated in the formation of MG4. The formation of MG5 by UGT1A9, however, followed atypical enzyme kinetics, which was best fit to the Hill equation (R2 = 0.994, n = 1.20 ± 0.08), suggesting allosterism (Figure 6D). The Km and Vmax for the formation of MG5 were 3.15 ± 0.24 µM and 0.86 ± 0.02 nmol/min/mg protein, respectively (Table 1). In addition, the specificity constant (Vmax/Km) for the formation of MG5 by UGT1A9 was 16-fold higher than for MG4.
The formation of MG4 and MG5 by UGT1A10 fit the Michaelis-Menten equation (R2 = 0.998 and 0.996; Figure 6E and 6F). Despite the similarity of Km values, the Vmax for the formation of MG4 was approximately 3-fold greater than that of MG5. This resulted in a specificity constant Vmax/Km for the formation of MG4 by UGT1A10 that was 3-fold greater than that of MG5 (see Table 1). The biphasic Eadie-Hofstee plots indicated that more than one enzyme or active site was involved in the generation of MG4 and MG5 by UGT1A10.
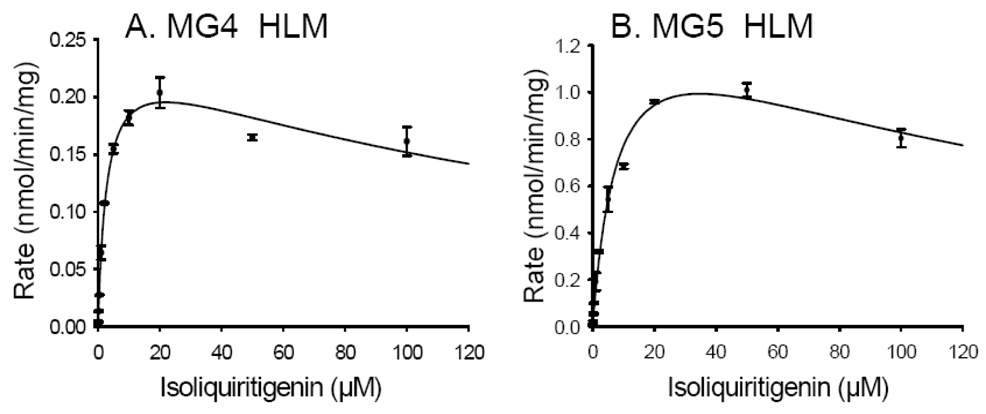
The kinetics constants for the formation of MG4 and MG5 by pooled human liver microsomes are shown in Figure 7. Like the formation of these metabolites by UGT1A1, these data fit the substrate inhibition model with R2 values of 0.994 and 0.996, respectively (see Figure 7). The apparent Km and Vmax values for the formation of MG4 were 2.84 ± 0.42 µM and 0.25 ± 0.01 nmol/min/mg protein, respectively, whereas those for the formation of MG5 were 8.42 ± 1.21 µM and 1.47 ± 1.21 nmol/min/mg protein, respectively. The specificity constant (Vmax/Km) for the formation of MG5 by human liver microsomes was approximately one-fold higher than that of MG4, indicating that MG5 was formed more efficiently than MG4 by human liver microsomes.
Figure 7.
Enzyme kinetics of A) MG4 and B) MG5 formation by pooled human liver microsomes. The curves were fit to the substrate inhibition equation. The data represent the Mean ± Std. Error of triplicate measurements.
Prediction of in vitro hepatic clearance of isoliquiritigenin using human liver microsomes
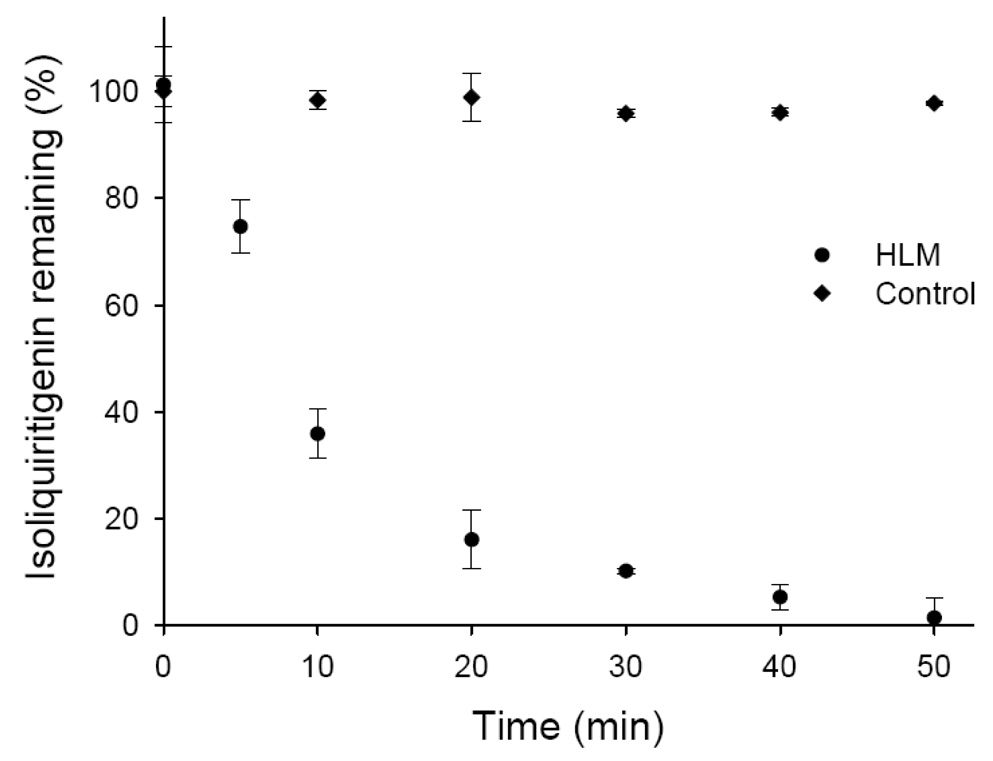
Next, the metabolic stability of isoliquiritigenin in the presence of human liver microsomes and UDPGA was monitored, and the percentage of isoliquiritigenin remaining vs. incubation time is shown in Figure 7. Isoliquiritigenin was rapidly eliminated through glucuronidation, decreasing 98.7 % in 50 min. The elimination rate constant (k) was 0.0344, and the in vitro t1/2 for isoliquiritigenin in pooled human liver microsomes was 20.1 min. By comparison, the contribution of CYP450 enzymes to the metabolism of isoliquiritigenin was much less significant, since the t1/2 for substrate depletion in phase 1 reactions was 141 min (data not shown).
Finally, the binding of isoliquiritigenin to microsomal proteins was measured using ultrafiltration, and the fraction unbound in the incubation mixture (fui) was estimated to be 0.85 according to equation (5). Based on equation (4) and in vitro measurements, the in vitro hepatic intrinsic clearance of isoliquiritigenin was calculated to be 36.4 mL/min/kg. This value is consistent with rapid hepatic elimination.
Formation of isoliquiritigenin glucuronides by microsomes from human liver, kidney, and intestine
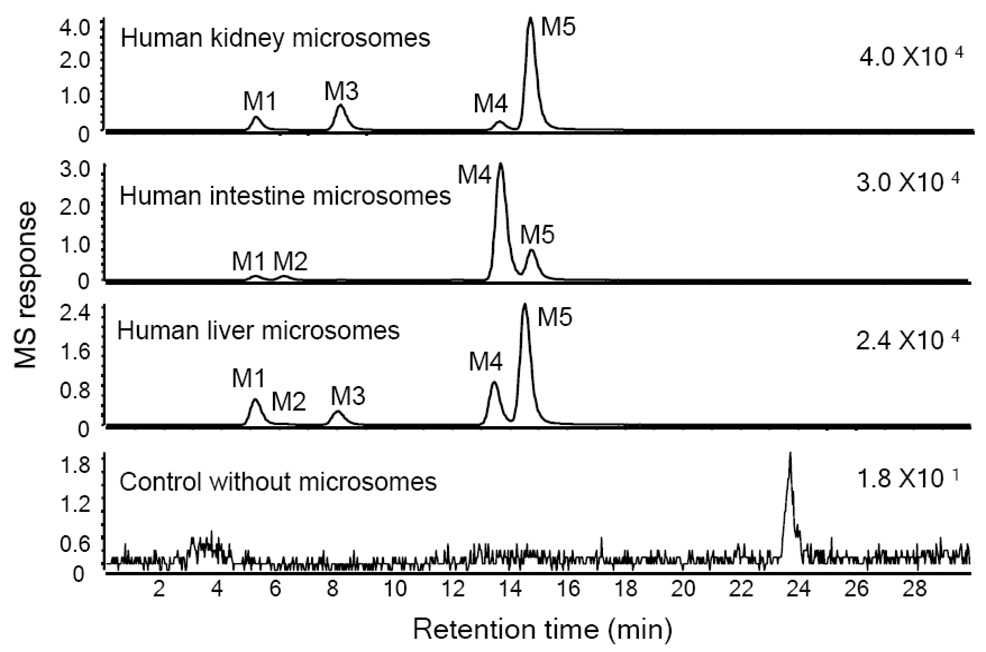
After incubation of isoliquiritigenin with human liver microsomes, human kidney microsomes, and human intestine microsomes, isoliquiritigenin glucuronides were detected using LC-MS as shown in Figure 9. MG1, MG4 and MG5 were detected in all three incubations. MG2 was formed only by the liver microsomes and intestine microsomes, and MG3 was formed only by liver microsomes and kidney microsomes. The relative yields of the most abundant glucuronides, MG4 and MG5, differed between incubations. Human liver microsomes produced more than 2-fold more MG5 than MG4, whereas the intestine microsomes formed ~4-fold more MG4 than MG5. In the incubation with human kidney microsomes, the yield of MG5 was ~14-fold more than that of MG4.
Figure 9.
Computer-reconstructed mass chromatograms for the negative ion LC-MS analysis of isoliquiritigenin after incubation with pooled human kidney, human intestine, or human liver microsomes (0.5 mg protein/mL) and UDPGA. The metabolites MG3, MG4 and MG5 (also detected after incubation with human hepatocytes, see Figure 2) were identified as isoliquiritigenin 4-, 2’- and 4’-O-glucuronide, respectively. No conjugates were observed in the control incubation containing no microsomes.
Discussion
Five monoglucuronides of isoliquiritigenin and liquiritigenin were formed through conjugation at the phenolic groups. Among these, MG5 (isoliquiritigenin 4’-O-glucuronide) was the most abundant conjugate. Glucuronidation at the 4’-position of the A-ring has also been reported for the flavonoids, xanthohumol and quercetin (Boersma et al., 2002; Ruefer et al., 2005). The preference for conjugation at the 4’-position instead of the 2’-position was probably due to the stabilization of the 2’-OH group by intramolecular hydrogen bond formation with the oxygen of the ketone or due to the specific orientation of isoliquiritigenin in the active sites of corresponding UDP-glucuronosyltransferases.
The experiments with cDNA-expressed UGTs showed that the glucuronidation of isoliqiritigenin is catalyzed primarily by UGT1A1, UGT1A9, and UGT1A10. UGT1A9 formed MG5 and MG3 in preference to MG4. However, UGT1A10 catalyzed glucuronidation most efficiently at the 2’-OH position to form MG4 followed by conjugation at the 4’-OH position to form MG5. The specificity constant for the formation of MG4 by UGT1A10 was 3-fold greater than that for MG5 (Table 1). These results indicate regioselective conjugation by these UGT enzymes. The formation of MG5, the most abundant isoliquiritigenin glucuronide, was catalyzed by several UGTs but predominantly by UGT1A1 and UGT1A9 (Figure 5). UGT1A1 has been reported to display significant genetic polymorphism (Fisher et al., 2001). For example, the UGT1A1*28 polymorphic allele leads to reduced enzyme expression and is associated with Gilbert’s syndrome (Burchell, 2003). Since UGT1A1 can contribute significantly to the formation of both MG5 and MG4, decreased expression of this enzyme might prolong the half-life of isoliquiritigenin in vivo. Furthermore, the half-life of isoliquiritigenin would be affected by any xenobiotics that inhibited UGT1A1 or altered its expression.
UGT1A9 is expressed in the liver, colon and kidney (Tukey and Strassburg, 2001). Since UGT1A9 mRNA has been reported to be higher in human kidney than in liver (McGurk et al., 1998) and UGT1A1 is not expressed in kidney (Fisher et al., 2001), UGT1A9 in human kidney should contribute significantly to the extrahepatic clearance of isoliquiritigenin. This prediction is supported by the observation that MG5 was the most abundant isoliquiritigenin glucuronide formed by human kidney microsomes (Figure 8).
Figure 8.
Metabolic stability of isoliquiritigenin during phase 2 glucuronidation by pooled human liver microsomes (HLM). Isoliquiritigenin (10 µM) was incubated with microsomes (0.4 mg protein/mL) in the presence of UDPGA (5 mM). The amount of isoliquiritigenin remaining at each time point was determined using LC-MS-MS. Incubation without UDPGA was used as a control. Each data point represents Mean ± Std. Error (N = 3).
The atypical kinetic plot of MG5 formation by UGT1A9 (Figure 6) suggests auto-activation, which has been reported for estradiol 3-glucuronidation by UGT1A1 and acetaminophen glucuronidation by UGT1A6 (Fisher et al., 2000). A potential explanation for auto-activation is that UGT enzymes exist as homo-oligomers or hetero-oligomers and binding of one substrate molecule to the active site of UGT1A9 facilitates the binding of a second substrate molecule to another UGT1A9 enzyme (Ghosh et al., 2001; Radominska-Pandya et al., 2005). Homodimers of human recombinant UGT1A9 have been detected by chemical cross-linking and co-immunopurification (Kurkela et al., 2003). The existence of homodimers might also explain the biphasic Eadie-Hofstee plot of MG4 and MG5 formation by UGT1A10 (Figure 6).
Recombinant UGT1A1 and UGT1A10 efficiently catalyzed the formation of MG4 (Figure 5). Not only expressed in liver, UGT1A1 and UGT1A10 have been detected in human intestine and contribute to the first-pass metabolism of orally ingested xenobiotics (Tukey and Strassburg, 2001; Kemp et al., 2002). The high yield of MG4 from incubations of isoliquiritigenin with human intestine microsomes suggest that intestinal first-pass glucuronidation of isoliquiritigenin might be significant (Figure 9).
Although human intestine microsomes and kidney microsomes catalyzed the glucuronidation of isoliquiritigenin, the liver might still be the major organ involved in the glucuronidaton of this chemopreventive agent. To estimate the metabolic efficiency of isoliquiritigenin glucuronidation in liver, the in vitro intrinsic clearance of isoliquiritigenin was obtained using the substrate depletion method (Soars et al., 2002). This assay complemented the kinetics data for UGT1A1, UGT1A9 and UGT1A10 that were found to include substrate inhibition, auto-activation, and Michaelis-Menten kinetics, respectively, for the glucuronidation of isoliquiritigenin. Our results indicate that glucuronidation represents a major metabolic pathway of isoliquiritigenin that should result in its rapid metabolism and elimination.
Although recombinant human UGTs expressed in baculovirus-infected cells are useful tools for the identification and evaluation of isoforms involved in the metabolism of xenobiotics, recent immunoblot analyses using anti-human UGT antibodies have revealed that the levels of microsomal UGTs expressed in the insect cells are not identical (Kato et al., 2008). For example, the amounts of microsomal UGT1A1, 1A3, 1A4, 1A6, 1A7, 1A8, 1A9, and 1A10 expressed in the insect cells were 1.6, 0.9, 1.2, 1.4, 1.3, 1.1, 1.1, and 1.2 nmol/mg of protein, respectively. Therefore, it should be noted that using UGTs expressed in baculovirus-infected cells for kinetic experiments without normalization to the level of UGT expression in each system might affect the accuracy of the results.
In summary, three isoliquiritigenin glucuronides were identified, MG3, MG4 and MG5, corresponding to conjugation at the 4-OH, 2’-OH and 4’-OH positions, respectively. In addition, the cyclization product liquiritigenin was also formed and glucuronidated on the remaining A-ring or B-ring hydroxyl groups. The most abundant metabolite, MG5, was formed most efficiently by UGT1A1 and UGT1A9; MG4 was formed primarily by UGT1A1 and UGT1A10; and MG3 was formed preferentially by UGT1A9. The existence of genetic polymorphisms of UGT1A1 with low enzyme activity implies that, in certain individuals, isoliquiritigenin might be eliminated more slowly and have enhanced chemopreventive activity. Since the 4’-OH group was the primary site for glucuronidation, modification of isoliquiritigenin at this position might enhance its bioavailability, prolong its half-life, and enhance its pharmacological activity.
Acknowledgments
This research was supported by grant P01 CA48112 from the National Cancer Institute.
Abbreviations
- HLM
human liver microsomes
- HPLC-UV
high performance liquid chromatography with ultraviolet absorbance detection
- LC-MS-MS
liquid chromatography-tandem mass spectrometry
- MG1
liquiritigenin 4- or 4’-O-glucuronide
- MG2
liquiritigenin 4 or 4’-O-glucuronide
- MG3
isoliquiritigenin 4-O-glucuronide
- MG4
isoliquiritigenin 2’-O-glucuronide
- MG5
isoliquiritigenin 4’-O-glucuronide
- UGT
uridine diphosphoglucuronosyl transferase
Contributor Information
Jian Guo, Department of Medicinal Chemistry and Pharmacognosy, University of Illinois College of Pharmacy, Chicago, IL.
Ang Liu, Department of Medicinal Chemistry and Pharmacognosy, University of Illinois College of Pharmacy, Chicago, IL.
Hongmei Cao, Department of Medicinal Chemistry and Pharmacognosy, University of Illinois College of Pharmacy, Chicago, IL.
Yan Luo, Department of Medicinal Chemistry and Pharmacognosy, University of Illinois College of Pharmacy, Chicago, IL.
John M. Pezzuto, School of Pharmacy, University of Hawaii at Hilo, HI
Richard B. van Breemen, Department of Medicinal Chemistry and Pharmacognosy, University of Illinois College of Pharmacy, Chicago, IL
References
- Alonso-Salces RM, Ndjoko K, Queiroz EF, Ioset JR, Hostettmann K, Berrueta LA, Gallo B, Vicente F. On-line characterisation of apple polyphenols by liquid chromatography coupled with mass spectrometry and ultraviolet absorbance detection. J Chromatogr A. 2004;1046:89–100. [PubMed] [Google Scholar]
- Baba M, Asano R, Takigami I, Takahashi T, Ohmura M, Okada Y, Sugimoto H, Arika T, Nishino H, Okuyama T. Studies on cancer chemoprevention by traditional folk medicines XXV. Inhibitory effect of isoliquiritigenin on azoxymethane-induced murine colon aberrant crypt focus formation and carcinogenesis. Biol Pharm Bull. 2002;25:247–250. doi: 10.1248/bpb.25.247. [DOI] [PubMed] [Google Scholar]
- Boersma MG, van der Woude H, Bogaards J, Boeren S, Vervoort J, Cnubben NH, van Iersel ML, van Bladeren PJ, Rietjens IM. Regioselectivity of phase II metabolism of luteolin and quercetin by UDP-glucuronosyl transferases. Chem Res Toxicol. 2002;15:662–670. doi: 10.1021/tx0101705. [DOI] [PubMed] [Google Scholar]
- Burchell B. Genetic variation of human UDP-glucuronosyltransferase: Implications in disease and drug glucuronidation. Am J Pharmacogenomics. 2003;3:37–52. doi: 10.2165/00129785-200303010-00006. [DOI] [PubMed] [Google Scholar]
- Cao Y, Wang Y, Ji C, Ye J. Determination of liquiritigenin and isoliquiritigenin in glycyrrhiza uralensis and its medicinal preparations by capillary electrophoresis with electrochemical detection. J Chromatogr A. 2004;1042:203–209. doi: 10.1016/j.chroma.2004.05.049. [DOI] [PubMed] [Google Scholar]
- Chan SC, Chang YS, Wang JP, Chen SC, Kuo SC. Three new flavonoids and antiallergic, anti-inflammatory constituents from the heartwood of dalbergia odorifera. Planta Med. 1998;64:153–158. doi: 10.1055/s-2006-957394. [DOI] [PubMed] [Google Scholar]
- Cuendet M, Oteham CP, Moon RC, Pezzuto JM. Quinone reductase induction as a biomarker for cancer chemoprevention. J Nat Prod. 2006;69:460–463. doi: 10.1021/np050362q. [DOI] [PMC free article] [PubMed] [Google Scholar]
- Fisher MB, Campanale K, Ackermann BL, VandenBranden M, Wrighton SA. In vitro glucuronidation using human liver microsomes and the pore-forming peptide alamethicin. Drug Metab Dispos. 2000;28:560–566. [PubMed] [Google Scholar]
- Fisher MB, Paine MF, Strelevitz TJ, Wrighton SA. The role of hepatic and extrahepatic UDP-glucuronosyltransferases in human drug metabolism. Drug Metab Rev. 2001;33:273–297. doi: 10.1081/dmr-120000653. [DOI] [PubMed] [Google Scholar]
- Ghosh SS, Sappal BS, Kalpana GV, Lee SW, Chowdhury JR, Chowdhury NR. Homodimerization of human bilirubin-uridine-diphosphoglucuronate glucuronosyltransferase-1 (UGT1A1) and its functional implications. J Biol Chem. 2001;276:42108–42115. doi: 10.1074/jbc.M106742200. [DOI] [PubMed] [Google Scholar]
- Guo J, Liu D, Nikolic D, Zhu D, Pezzuto JM, van Breemen RB. In vitro metabolism of isoliquiritigenin by human liver microsomes. Drug Metab Dispos. 2008;36:461–468. doi: 10.1124/dmd.107.018721. [DOI] [PubMed] [Google Scholar]
- Hariparsad N, Sane RS, Strom SC, Desai PB. In vitro methods in human drug biotransformation research: Implications for cancer chemotherapy. Toxicol in Vitro. 2006;20:135–153. doi: 10.1016/j.tiv.2005.06.049. [DOI] [PubMed] [Google Scholar]
- Ii T, Satomi Y, Katoh D, Shimada J, Baba M, Okuyama T, Nishino H, Kitamura N. Induction of cell cycle arrest and p21(CIP1/WAF1) expression in human lung cancer cells by isoliquiritigenin. Cancer Lett. 2004;207:27–35. doi: 10.1016/j.canlet.2003.10.023. [DOI] [PubMed] [Google Scholar]
- Iwashita K, Kobori M, Yamaki K, Tsushida T. Flavonoids inhibit cell growth and induce apoptosis in B16 melanoma 4A5 cells. Biosci Biotech Biochem. 2000;64:1813–1820. doi: 10.1271/bbb.64.1813. [DOI] [PubMed] [Google Scholar]
- Kape R, Parniske M, Brandt S, Werner D. Isoliquiritigenin, a strong nod gene- and glyceollin resistance-inducing flavonoid from soybean root exudate. Appl Environ Microb. 1992;58:1705–1710. doi: 10.1128/aem.58.5.1705-1710.1992. [DOI] [PMC free article] [PubMed] [Google Scholar]
- Kato Y, Ikushiro S, Emi Y, Tamaki S, Suzuki H, Sakaki T, Yamada S, Degawa M. Hepatic UDP-glucuronosyltransferases responsible for glucuronidation of thyroxine in humans. Drug Metab Dispos. 2008;36:51–55. doi: 10.1124/dmd.107.018184. [DOI] [PubMed] [Google Scholar]
- Kemp DC, Fan PW, Stevens JC. Characterization of raloxifene glucuronidation in vitro: contribution of intestinal metabolism to presystemic clearacne. Drug Metab Dispos. 2002;30:694–700. doi: 10.1124/dmd.30.6.694. [DOI] [PubMed] [Google Scholar]
- Kong LD, Cai Y, Huang WW, Cheng CH, Tan RX. Inhibition of xanthine oxidase by some Chinese medicinal plants used to treat gout. J Ethnopharmacol. 2000;73:199–207. doi: 10.1016/s0378-8741(00)00305-6. [DOI] [PubMed] [Google Scholar]
- Kurkela M, Garcia-Horsman JA, Luukkanen L, Morsky S, Taskinen J, Baumann M, Kostiainen R, Hirvonen J, Finel M. Expression and characterization of recombinant human UDP-glucuronosyltransferases (UGTs). UGT1A9 is more resistant to detergent inhibition than other UGTs and was purified as an active dimeric enzyme. J Biol Chem. 2003;278:3536–3544. doi: 10.1074/jbc.M206136200. [DOI] [PubMed] [Google Scholar]
- Ma J, Fu NY, Pang DB, Wu WY, Xu AL. Apoptosis induced by isoliquiritigenin in human gastric cancer MGC-803 cells. Planta Med. 2001;67:754–757. doi: 10.1055/s-2001-18361. [DOI] [PubMed] [Google Scholar]
- Maggiolini M, Statti G, Vivacqua A, Gabriele S, Rago V, Loizzo M, Menichini F, Amdo S. Estrogenic and antiproliferative activities of isoliquiritigenin in MCF7 breast cancer cells. J Steroid Biochem. 2002;82:315–322. doi: 10.1016/s0960-0760(02)00230-3. [DOI] [PubMed] [Google Scholar]
- Markham KR. Techniques of flavonoid identification. New York: Academic Press; 1980. [Google Scholar]
- McGurk KA, Brierley CH, Burchell B. Drug glucuronidation by human renal UDP-glucuronosyltransferases. Biochem Pharmacol. 1998;55:1005–1012. doi: 10.1016/s0006-2952(97)00534-0. [DOI] [PubMed] [Google Scholar]
- Mohutsky MA, Chien JY, Ring BJ, Wrighton SA. Predictions of the in vivo clearance of drugs from rate of loss using human liver microsomes for phase I and phase II biotransformations. Pharm Res. 2006;23:654–662. doi: 10.1007/s11095-006-9663-4. [DOI] [PubMed] [Google Scholar]
- Nikolic D, Li Y, Chadwick LR, Pauli GF, van Breemen RB. In vitro studies of intestinal permeability and hepatic and intestinal metabolism of 8-prenylnaringenin, a potent phytoestrogen from hops (Humulus lupulus L.) Pharm Res. 2006;23:864–872. doi: 10.1007/s11095-006-9902-8. [DOI] [PMC free article] [PubMed] [Google Scholar]
- Otake Y, Hsieh F, Walle T. Glucuronidation versus oxidation of the flavonoid galangin by human liver microsomes and hepatocytes. Drug Metab Dispos. 2002;30:576–581. doi: 10.1124/dmd.30.5.576. [DOI] [PubMed] [Google Scholar]
- Pan X, Kong LD, Zhang Y, Cheng CH, Tan RX. In vitro inhibition of rat monoamine oxidase by liquiritigenin and isoliquiritigenin isolated from Sinofranchetia chinensis. Acta Pharmacol Sin. 2000;21:949–953. [PubMed] [Google Scholar]
- Park KY, Jung GO, Lee KT, Choi J, Choi MY, Kim GT, Jung HJ, Park HJ. Antimutagenic activity of flavonoids from the heartwood of Rhus verniciflua. J Ethnopharmacol. 2004;90:73–79. doi: 10.1016/j.jep.2003.09.043. [DOI] [PubMed] [Google Scholar]
- Radominska-Pandya A, Ouzzine M, Fournel-Gigleux S, Magdalou J. Structure of UDP-glucuronosyltransferases in membranes. Meth Enzymol. 2005;400:116–147. doi: 10.1016/S0076-6879(05)00008-X. [DOI] [PubMed] [Google Scholar]
- Ramadan MA, Kamel MS, Ohtani K, Kasai R, Yamasaki K. Minor phenolics from Crinum bulbispermum bulbs. Phytochemistry. 2000;54:891–896. doi: 10.1016/s0031-9422(00)00184-9. [DOI] [PubMed] [Google Scholar]
- Ross D, Kepa JK, Winski SL, Beall HD, Anwar A, Siegel D. NAD(P)H:Quinone oxidoreductase 1 (NQO1): Chemoprotection, bioactivation, gene regulation and genetic polymorphisms. Chem Biol Interact. 2000;129:77–97. doi: 10.1016/s0009-2797(00)00199-x. [DOI] [PubMed] [Google Scholar]
- Ruefer CE, Gerhèauser C, Frank N, Becker H, Kulling SE. In vitro phase II metabolism of xanthohumol by human UDP-glucuronosyltransferases and sulfotransferases. Mol Nutr Food Res. 2005;49:851–856. doi: 10.1002/mnfr.200500057. [DOI] [PubMed] [Google Scholar]
- Sabzevari O, Galati G, Moridani MY, Siraki A, O'Brien PJ. Molecular cytotoxic mechanisms of anticancer hydroxychalcones. Chem Biol Interact. 2004;148:57–67. doi: 10.1016/j.cbi.2004.04.004. [DOI] [PubMed] [Google Scholar]
- Soars MG, Burchell B, Riley RJ. In vitro analysis of human drug glucuronidation and prediction of in vivo metabolic clearance. J Pharmacol Exp Ther. 2002;301:382–390. doi: 10.1124/jpet.301.1.382. [DOI] [PubMed] [Google Scholar]
- Tamir S, Eizenberg M, Somjen D, Izrael S, Vaya J. Estrogen-like activity of glabrene and other constituents isolated from licorice root. J Steroid Biochem. 2001;78:291–298. doi: 10.1016/s0960-0760(01)00093-0. [DOI] [PubMed] [Google Scholar]
- Tukey RH, Strassburg CP. Genetic multiplicity of the human UDP-glucuronosyltransferases and regulation in the gastrointestinal tract. Mol Pharmacol. 2001;59:405–414. doi: 10.1124/mol.59.3.405. [DOI] [PubMed] [Google Scholar]
- Vaya J, Belinky PA, Aviram M. Antioxidant constituents from licorice roots: Isolation, structure elucidation and antioxidative capacity toward LDL oxidation. Free Radical Biol Med. 1997;23:302–313. doi: 10.1016/s0891-5849(97)00089-0. [DOI] [PubMed] [Google Scholar]
- Wattenberg LW, Coccia JB, Galbraith AR. Inhibition of carcinogen-induced pulmonary and mammary carcinogenesis by chalcone administered subsequent to carcinogen exposure. Cancer Lett. 1994;83:165–169. doi: 10.1016/0304-3835(94)90314-x. [DOI] [PubMed] [Google Scholar]
- Wynalda MA, Wynalda KM, Amore BM, Fagerness PE, Wienkers LC. Characterization of bropirimine O-glucuronidation in human liver microsomes. Xenobiotica. 2003;33:999–1011. doi: 10.1080/00498250310001602757. [DOI] [PubMed] [Google Scholar]
- Yamazaki S, Morita T, Endo H, Hamamoto T, Baba M, Joichi Y, Kaneko S, Okada Y, Okuyama T, Nishino H, Tokue A. Isoliquiritigenin suppresses pulmonary metastasis of mouse renal cell carcinoma. Cancer Lett. 2002;183:23–30. doi: 10.1016/s0304-3835(02)00113-1. [DOI] [PubMed] [Google Scholar]
- Yu C, Shin YG, Chow A, Li Y, Kosmeder JW, Lee YS, Hirschelman WH, Pezzuto JM, Mehta RG, van Breemen RB. Human, rat, and mouse metabolism of resveratrol. Pharm Res. 2002;19:1907–1914. doi: 10.1023/a:1021414129280. [DOI] [PubMed] [Google Scholar]


