Figure 7.
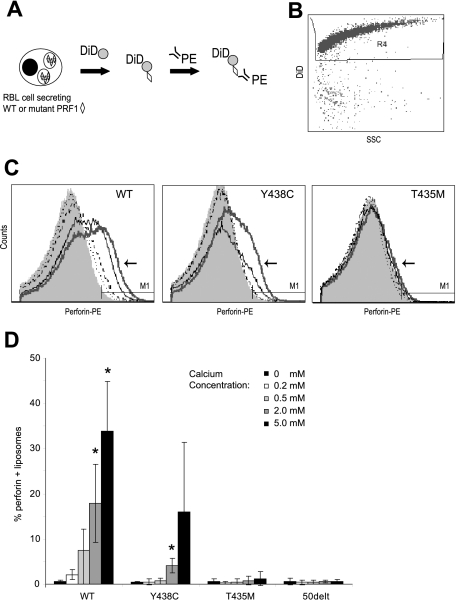
Ca-dependent binding of perforin to liposomes. (A) Binding assay: RBL-2H3 cells expressing WT or mutant perforins (◇) were stimulated by P/I in the presence of DiD-labeled liposomes ( ) in a minimum buffer with defined Ca concentrations. Twenty minutes into the stimulation, PE-conjugated δG9 antiperforin antibody (linear depiction of antibody) was added to the medium. Sixty minutes later, the RBL-2H3 cells were pelleted and the liposome-containing supernatant analyzed by flow cytometry. (B) Scatter plots of dye-labeled (DiD) liposomes vs side scatter. To analyze perforin staining, we gated on these brightly labeled liposomes. (C) Histograms showing perforin staining in the presence of buffers of increasing Ca concentration. In each figure, the histogram for the 5 mM of Ca buffer is indicated by an arrow and thick gray line. The thin black line represents 2 mM of Ca; dashed black line, 0.5 mM of Ca; dotted black line, 0.2 mM of Ca. (D) Summary of 3 experiments: PRF1-WT and -Y438C, but not PRF1-T435M, show a dose-dependent signal with increasing Ca concentrations. *Statistical significance compared with 0 mM Ca (2-tailed Student t test, P < .01). PRF1-50delt (nonsense mutation) is shown as a negative control.

