

Abstract
The properties of a self-specific T-cell's TCR that determine its pathogenicity are not well understood. We developed TCR retroviral transgenic, or retrogenic, models of myelin oligodendroglial glycoprotein (MOG)-induced EAE to compare the pathologic potential of five H-2 Ab/MOG35-55-specific TCR. The TCR were cloned and retrovirally transduced into either TCRαβ-deficient hybridoma cells or Rag1−/− bone marrow progenitor cells. Comparison of the hybridomas, identical except for TCR sequence, revealed distinct responsiveness, or functionally-determined affinity, for cognate antigen. Retrogenic mice were produced by transfer of transduced progenitor cells into Rag1−/− recipients. T-cells were detected within 4 weeks. Engraftment levels varied considerably among the different TCR, and showed separate variability among individual mice. T cells were predominantly naïve and virtually exclusively CD4+ and CD25−. Relative responses of the retrogenic T-cells to antigen paralleled that of the hybridoma cells. Induction of EAE through active immunization led to rapid and severe disease in all mice expressing MOG-specific TCR. The mice additionally developed spontaneous disease, the incidence of which varied with the individual receptors. Interestingly, spontaneous disease frequency and intensity could not be correlated with the functional affinity of the respective TCR. Instead, it was associated with engraftment level, even when measured weeks prior to the onset of disease symptoms. Our results demonstrate the feasibility of using retrogenic modeling to compare TCR in the EAE system. They further suggest that affinity is not a primary determinant in spontaneous EAE development in mice expressing monotypic TCR, and that autoreactive T-cell frequency is of greater significance.
Introduction
The qualities of a self-specific T-lymphocyte that define its pathogenicity are incompletely understood. Paramount among these is the nature of the cell's T cell receptor (TCR), which is defined not only by its specificity, but also critically by its affinity for cognate MHC-Ag (1). TCR affinity guides the evolution of many T-cell responses, as T-cells of higher affinity outcompete lower affinity T-cells when Ag is limiting (2). It may be presumed that affinity guides competition among self-reactive T-cells during autoimmunity, much as it does for pathogen-specific T-cells during infections. However, the role of Ag affinity in sustaining autoimmunity, where Ag is often plentiful, may be quite different from other immune responses, and how affinity or other features of TCR recognition relate to the autoimmune potential of a T-cell is uncertain.
TCR affinity may have dual roles in defining a T-cell's autoimmune potential. Increased affinity may promote central and peripheral tolerance (3,4). Simultaneously it may increase responsiveness to cognate Ag (5,6). In one study, ELISPOT responses to titrations of Ag was used as a functional measure to gauge progressive changes in the avidity of CD4+ myelin basic protein (MBP)-specific T-cells in an experimental autoimmune encephalomyelitis (EAE) model (7). No temporal change in avidity was detected. This suggests that T-cell avidity, which may reflect on TCR affinity, is not important in the evolution of T-cell responses during disease. In contrast, in a diabetes model, increased CD8+ T-cell avidity was associated with disease development (8). A caveat of this latter analysis was that affinity was measured against a mimitope, or mimic peptide, as the actual autoantigen was not known.
Regardless of the role TCR affinity plays in autoimmunity, TCR properties undoubtedly influence disease. For example, of 2 lines of transgenic (Tg) mice that have been described expressing myelin oligodendroglial glycoprotein (MOG)-specific TCR, one developed rapid and severe EAE after immunization and occasional spontaneous autoimmunity, whereas a second was protected from EAE (9,10). Even after immunization with MOG, this latter Tg line developed less severe disease than control non-Tg animals. Similarly, two lines of Tg mice specific for an epitope derived from proteolipid protein have been generated (11). Whereas one developed severe EAE after immunization, the second did not develop clinical disease, though some CNS inflammation was observed.
To examine the functional potential of different Ag-specific TCR in EAE, we have developed retroviral transgenic, or retrogenic, models to compare T-cells expressing a series of TCR specific for a single autoantigenic epitope, MOG35-55. We cloned the α and α chains of MOG35-55-specific/Ab-restricted TCR. We linked these chains in a polycistronic retroviral construct, and used recombinant retrovirus to transduce TCR-deficient hybridoma cells or Rag1−/− hematopoietic progenitor cells (HPC) (12,13). The transduced HPC were transplanted into Rag1−/− recipients. Because Rag1−/− cells cannot rearrange endogenous TCR, lymphocytes that develop in the recipient mice can only express a single TCR, that encoded by the retrovirus.
Five TCR specific for cognate autoantigen were analyzed, and all were well expressed on TCR-deficient hybridoma cells and displayed distinct responsiveness to cognate Ag. Because the hybridoma cells were essentially identical except for their TCR sequence, differences in response should only reflect differences in TCR binding to Ag and subsequent engagement of the signal transduction machinery. These TCR properties are denoted here as functional affinity.
The TCR were also well expressed on T-cells in retrogenic mice. Whereas MOG-specific retrogenic mice uniformly developed severe EAE disease after peptide immunization, they demonstrated differential development of spontaneous autoimmunity. Interestingly, comparative analysis of the retrogenic mice failed to correlate functional affinity with incidence or severity of disease. T-cells expressing different TCR, however, differentially engrafted in the retrogenic mice, and cellular engraftment was most associated with spontaneous disease development. Our results therefore establish a new approach to model EAE and evaluate T-cell responses therein. They further fail to identify functional affinity as a primary determinant in pathogenicity in these retrogenic models. Rather they show that in mice with T-cells expressing monotypic TCR naïve autoreactive T-cell quantity, a product of thymic output and homeostatic expansion, is a critical parameter.
Materials and Methods
Mice
Rag1−/− mice were obtained from The Jackson Laboratory and bred under specific pathogen free, including all detectable strains of helicobacter, conditions. C57BL/6 mice were obtained from The Jackson Laboratory. Experiments were performed in accordance with institutional animal care and use procedures.
Media, Reagents, Antibodies, and Flow Cytometry
T-cell culture conditions were as described (14). MOG35-55 peptide (MEVGWYRSPFSRVVHLYRNGK) was synthesized and HPLC purified to >90% purity by the St. Jude Hartwell Center for Biotechnology. Monoclonal antibodies specific for CD4 (clone L3T4), CD8 (clone 53-6.7), CD25 (clone 7D4), TCRβ (clone H57-597), CD69 (clone H1.2F3), CD45RB (clone 16A), CD44 (clone IM7), TCR Vα2 (clone B20.1), TCR Vβ8.1, 8.2 (clone MR5-2), and TCR Vβ6 (clone RR4-7) were obtained from BD Biosciences. Flow cytometry was performed on a FACSCalibur (Becton Dickinson), and flow cytometric sorting was performed on a MoFlo high-speed cell sorter (DakoCytomation).
MOG protein production
The extracellular domain of MOG (1-116) was expressed in Sf9 insect cells (Gibco) using the FlashBAC baculovirus system (Expression Technologies). Briefly, the MOG1-116 cDNA was cloned into the pACGHLT vector (Becton Dickinson) and cotransfected with a linear flashback DNA into Sf9 cells using Fugene HD transfection reagent (Roche). Three days after infection, the cell pellet was collected and analyzed using anti-GST antibody. The supernatant was harvested and used as a P1 stock. A 3L scale-up of insect cells with the MOG-baculovirus was cultured and purified using a Hitrap FF GST column on a AKTA 10S chromatography system. The protein was further purified by gel filtration chromatography in PBS. Approximately 1 mg of purified MOG protein was obtained per L of culture.
Generation of Hybridomas
Lymph node and brain mononulcear cells were isolated from C57BL/6 mice immunized with MOG35-55 to induce EAE. To isolate brain mononuclear cells, mice were perfused intracardially with saline, and brain were removed, mechanically minced, and the cells filtered through a 70 μm nylon cell strainer. These were pelleted and purified by percoll centrifugation as described (15). The T cells were stimulated with MOG35-55 peptide without IL-2 for 3 days, expanded for an additional 2 days with IL-2, and fused with BW5147-thymoma cells to produce T-cell hybridomas as previously described (16). Fused cells were cloned at limiting dilution and screened for reactivity to MOG by measuring IL-2 production in response to irradiated C57BL/6 splenocytes, APC, and MOG35-55 peptide. Ninety six hybridoma cells were produced and 22 were MOG35-55 specific.
Cloning of MOG35-55 specific TCR genes
RNA from MOG-specific hybridomas was isolated using Trizol (Invitrogen) and reverse transcribed as described. cDNA samples were PCR amplified using either Cα or Cβ specific primers (Cα, GCACTAGATCTAGGATCTTTTAACTGGTACACAGC; Cβ2 GCACTCTCGAGGTCGACCTACTACGTAGAATTTTTTTTCTTGACCATGGCC; Cβ1, GCACTCTCGAGGTCGACCTACTACGTAGAGTTCTTTCTTTTGACCATAGCCAT C) and a panel of specific Vα and Vβ primers corresponding to unique 5' coding regions of the non-redundant V regions (determined by analyzing all mouse Vα and Vβ sequences in the International Immunogenetics Information System, www.imgt.cines.fr).. These were: Vβ1, gcactcccgggcccatgagctgcaggcttctcctgtat; Vβ2, gcactcccgggcccatgtggcagttttgcattctgtgc; Vβ3, gcactcccgggcccatggctacaaggctcctctgttac; Vβ4, gcactcccgggcccatgggctccattttcctcagttgc; Vβ5.1, gcactcccgggcccatgtctaacactgccttccctgac; Vβ5.2, gcactcccgggcccatgtctaacactgtcctcgctgat; Vβ6, gcactcccgggcccatgaacaagtgggttttctgctgg; Vβ7, gcactcccgggcccatgagagttaggctcatctctgct; Vβ8.1, gcactcccgggcccatgggctccagactcttctttgtg; Vβ8.2, gcactcccgggcccatgtctaacactgccttccctgac; Vβ8.3, gcactcccgggcccatgggctccaggctctttctggtc; Vβ9, gcactcccgggcccatggatcctagacttctttgctgt; Vβ10, gcactcccgggcccatgggctgtaggctcctaagctgt; Vβ11, gcactcccgggcccatggcccccaggctccttttctgt; Vβ12 gcactcccgggcccatgggcatccagaccctctgttgt; Vβ13, gcactcccgggcccatgggctccaggctctttctggtc; Vβ14, gcactcccgggcccatgctgtactctctccttgccttt; Vβ15, gcactcccgggcccatgttactgcttctattacttctg; Vβ16, gcactcccgggcccatggatatctggcttctaggttgg; Vβ17, gcactcccgggcccatgggtgcaagactgctctgctgt; Vβ18, gcactcccgggcccatgtggacattcctgctacttctt; Vβ20, gcactcccgggcccatgggtgcacggctcatttgctat; TRAV1, gcactgaattcgccaccatgggactgcagatgtgggggtttgttctc; TRAV2, gcactgaattcgccaccatgggaaagcaggtggcaaaagtgactgtg; TRAV3.1b, gcactgaattcgccaccatgaagacagtgactggacctttgttg; TRAV3.3b, gcactgaattcgccaccatgggaaagacagtgactggacctttgttg; TRAV4.2, gcactgaattcgccaccatgggaaagaggctgctgtgctctctgttg; TRAV4.3, gcactgaattcgccaccatggagaggaacctggttgctgtgctg; TRAV4.4, gcactggatccgccaccatgggacagaggaacctgggagctgtgctg;, TRAV4D.3b, gcactgaattcgccaccatgggacagaggaacctggttgctgtgctg; TRAV5.4, gcactgaattcgccaccatgggaaaaacacatgcttctacattattc; TRAV5D.4, gcactgaattcgccaccatgggaaaaacatatgctcctacattattc; TRAV5.1b, gcactgaattcgccaccatgggaaagacagctattcatgctttattt; TRAV6.1b, gcactgaattcgccaccatgggaaactattctccagctttagtgact; TRAV6.2b, gcactgaattcgccaccatgggaaacacttctccagctttagtgact; TRAV6.4b, gcactgaattcgccaccatgggaaatacttctccagttttagtaact; TRAV6.5, gcactgaattcgccaccatgggacacagcctcctggggttgttgatg; TRAV6.5b, gcactgaattcgccaccatgggaaacctttatcctgaactggggatt; TRAV6.6b, gcactgaattcgccaccatggactcttctccaggcttcgtggct; TRAV6.7b, gcactgaattcgccaccatgggaaactcttctccaggcttcatgact; TRAV6D.4, gcactgaattcgccaccatgggaaacaattccccagctttagtgact; TRAV6D.4b, gcactgaattcgccaccatgggaaatacttctccagttttagtgact;; TRAV6D.5b, gcactgaattcgccaccatgggaaacctttgtcctgaactggggatt; TRAV6D.6b, gcactgaattcgccaccatgggagacttttctccaggcttcgtggct; TRAV7.1b, gcactgaattcgccaccatgggaaagtccttgtgtgtttcactagtg; TRAV7.3b, gcactgaattcgccaccatgggaaaatccttgagtgtttccctagtg; TRAV7.4b, gcactgaattcgccaccatgggaaaatccttgagtgtttcactagtg; TRAV7.5, gcactgaattcgccaccatgaaatccttgagtgtttcactagtg; TRAV7.6b, gcactgaattcgccaccatgggacattccttacatgtttcactagtg; TRAV7D.2b, gcactgaattcgccaccatgggaaaatcctttagtatttccctagtg; TRAV7D.3, gcactgaattcgccaccatgggaaaatccttgagtgtttccctagtg; TRAV7D.4, gcactgaattcgccaccatggtacaaacacagatgttcttaatc; TRAV8D.1b, gcactgaattcgccaccatgggacacagcctcctagggttgttgatg; TRAV9.1b, gcactgaattcgccaccatgggactcctggtcctcatctcgttcctc; TRAV9.2, gcactgaattcgccaccatgggactcctggtgctcctcccagtgctg; TRAV9.3, gcactgaattcgccaccatgggactcctggcgctcctcccagtgctg; TRAV9.4, gcactgaattcgccaccatgggactcctggcactcctcccagtgctg; TRAV9D.1b, gcactgaattcgccaccatgggactcctggttctcatctcgttcctc; TRAV9D.2, gcactgaattcgccaccatgggactcctggcgctcctctcagtcctg; TRAV10, gcactgaattcgccaccatgggaaacagattcctgggaatatctttg; TRAV11b, gcactgaattcgccaccatgggaaaaaagtgccttagtgcctgctgg; TRAV11Dc, gcactgaattcgccaccatgggaaaaaagtgcctgagtgcctgctgg; TRAV12.1, gcactgaattcgccaccatgggacgtcctgtcacctgctcagttctt; TRAV12.2c, gcactgaattcgccaccatgggaaacatgcatcctgtcacctgctca; TRAV12.3, gcactgaattcgccaccatgggacgtcctggcacctgctcagttctt; TRAV12D.1, gcactgaattcgccaccatgggaaacatgcgtcctgtcacctcctca; TRAV12D.2, gcactgaattcgccaccatgggacgtcctgacacctgctcagttctt; TRAV13.1b, gcactgaattcgccaccatgggaaacaggctgctgtgctctctgctg; TRAV13.2b, gcactgaattcgccaccatgggaaagaggctgctgtgttctctgctg; TRAV13.3b, gcactgaattcgccaccatgggaaagaggctgctgtgctctctgctg; TRAV13.4, gcactgaattcgccaccatgggaaagaggctgctgtgctctctgctg; TRAV13.5, gcactgaattcgccaccatgaaaacagtgactggacctttgttc; TRAV13.5b, gcactgaattcgccaccatgggaaggaggctgatgtgttctctgctg; TRAV13D.1, gcactgaattcgccaccatgggaaagaggctgctgagctctctgctg; TRAV13D.2, gcactgaattcgccaccatgggaaagaggctagtgtgttctctgctg; TRAV14.1, gcactgaattcgccaccatggacaagatcctgacagcaacgttt; TRAV14.2, gcactgaattcgccaccatggacaagatcctgacagcatcgttt; TRAV14.3, gcactgaattcgccaccatggacaagatcctgacagcatcgttt; TRAV14D.1, gcactgaattcgccaccatggacaagattctgacagcatcattt; TRAV14D.2, gcactgaattcgccaccatggacaagaacctgacagcatcatgt; TRAV14D.3, gcactgaattcgccaccatggacaagatcctgacagcattg; TRAV15.1b, gcactgaattcgccaccatgggacctcctcacagcctgctctgtgtg; TRAV15.2b, gcactgaattcgccaccatgggacctcctcagagcctgctctgtgtg; TRAV16b, gcactgaattcgccaccatgggaaacagattcctgggaatatctttg; TRAV17b, gcactgaattcgccaccatgggattcctagtgaccattctgctgctc; TRAV18b, gcactgaattcgccaccatgggactcctgaaactctctgtgttgctc; TRAV19b, gcactgaattcgccaccatgggaactggcttcctgaaggccttgctg; TRAV21b, gcactgaattcgccaccatgggatgtgtgagtggaattgccatt. The cDNA was cloned using restriction sites inserted in the PCR primers (TCRα 5' EcoRI, 3' BglII; TCRβ 5' SmaI, 3' XhoI) into a pBS-KS cassette vector modified to incorporate unamplified invariant TCR sequence and a Thosea Asigna 2A sequence separating the α and β chain cDNAs (Fig. 1). DNA sequences were confirmed by sequencing the TCRα-2A-TCRβ cDNAs, and these were subcloned into murine stem cell virus (MSCV)-driven retroviral vectors that co-express an IRES linked green fluorescent protein (GFP) or cyan fluorescent protein (CFP), MSCV-I-GFP or MSCV-I-CFP (17).
Figure 1. Structure of retroviral constructs.

Amplified TCRα and β chain cDNA sequences were subcloned into a cassette vector in which necessary subcloning restriction sites, portions of Cα, and the T. asigna 2A sequence were inserted into the vector multi-cloning site. This resulted in the generation of a single reading frame extending through the α chain, 2A, and β chain sequences. Construct sequences were confirmed prior to subcloning into the MSCV-I-GFP or MSCV-I-CFP retroviral vectors. DNA sequence for the identified genetic elements is shown.
Retroviral transduction of TCR
Retrovirus was produced as described (12,18). Briefly, 10 μg each of retroviral receptor and helper DNA constructs were cotransfected into 293-T cells using calcium phosphate precipitation and the cells were incubated in Dulbecco's modified Eagle medium (DMEM)/10% fetal calf serum (FCS) for 48 h. Supernatant was then collected twice daily and used to infect GP+E86 retroviral producer cells in the presence of 8 μ/ml polybrene. Transduced GP+E86 cells were flow-cytometrically sorted for the presence of GFP or CFP, and expanded. Supernatant was used to infect murine surface TCR-deficient 4G4 T hybridoma cells (gift of C. Janeway, Yale University, New Haven, CT) that had been previously transduced with murine CD4-expressing retrovirus.
Generation of Retrogenic Mice
Retrogenic mice were generated as described (12,13). Briefly, bone marrow cells were harvested from the femurs of Rag1−/− mice 48 h after the administration of 0.15 mg 5-fluorouracil (5-FU)/g body weight. The pooled cells were cultured in complete DMEM medium containing 20% FCS, supplemented with IL-3 (20 ng ml−1), IL-6 (50 ng ml−1) and SCF (50 ng ml−1) for 48 h at 37°C / 5%CO2. The cells were then co-cultured for an additional 48 h with 1200 rad irradiated GP+E86 retroviral producer cells. The transduced progenitor cells were harvested, washed with PBS, analyzed by flow cytometry for GFP or CFP, and injected into sub-lethally irradiated (450 rad) recipient Rag1−/− mice at a ratio of 2 recipient mice per bone marrow donor. Engraftment was assessed 4 weeks later by analyzing peripheral blood for TCR+ mononuclear cells.
EAE Induction and Clinical Evaluation
EAE was induced by subcutaneously immunizing C57BL/6 or retrogenic mice with 100 or 10 μg of MOG35-55 peptide emulsified in complete Freund's adjuvant containing 4 mg/ml Mycobacterium tuberculosis H37RA (Difco). 200 ng of pertussis toxin (List Biological Laboratories) was administered i.v. on days 0 and 2. Clinical scoring was as follows: 1, limp tail; 2, hind limb paresis or partial paralysis; 3, total hind limb paralysis; 4, hind limb paralysis and body/front limb paresis/paralysis; 5, moribund.
T Cell Proliferation
CD4 T cells were isolated from the spleen and LN of retrogenic or C57BL/6 mice, and purified using anti-CD4 (L3T4)-coated micro beads (MACS Miltenyi Biotech Inc.) per manufacturer's directions. Cells were cultured at 5×10⁴ per well in 96-well plates with 3×10⁵irradiated antigen presenting cells (APCs) and the indicated stimulus, pulsed with 1 μCi of [3H]thymidine after 72 h of culture, and then harvested for scintillation counting. Samples were analyzed in triplicate.
Cytokine Analysis
5×10⁴ primary CD4 T cells, isolated as above, or 1×10⁵ 4G4.CD4 cells were cultured in the presence of 3×10⁵ APCs and the indicated stimulus. Culture supernatants were collected at 24 or 48 h and analyzed for IL-2 by sandwich ELISA (BD-Pharmingen) or Bio-Plex (Bio-Rad) assays, and by Bio-Plex for other cytokines.
Statistics
Representative data from at least three experiments are shown except where cumulative data is plotted. Plots demonstrate mean ± standard deviation (s.d.). Two tailed student's t-tests were performed using Excel spreadsheet software (Microsoft) and assume unequal sample variances. Kaplan Meier analyses were performed using Excel spreadsheet software and statistically analyzed using the log rank test. For figure 7 analysis, total events and events censored prior to 150 days (mice removed at different time points for other analyses) respectively are for 1MOG9, 59 and 33; for 1MOG23, 30 and 16; for 1MOG244.2, 10 and 0; for 2MOG10, 20 and 7; for 5MOG113, 25 and 15. A p<0.05 was considered statistically significant when specific values are not listed.
Figure 7. Spontaneous disease development in retrogenic mice.

Disease free survival of retrogenic mice, unmanipulated after their production, is plotted using Kaplan-Meier analysis. 1MOG9 (A), 1MOG23 (B), 1MOG244.2 (C), 2MOG10 (D), and 5MOG113 (E) mice are separately plotted. Numbers indicate disease free survival at 120 days and at the termination of observation. Statistical analysis of all combinations of mice using the log rank test indicates significant differences between all pair combinations except 2MOG10 and 1MOG23, and 2MOG10 and 1MOG244.2 (p>0.05).
Results
Cloning and expression of MOG-specific TCR
We generated panels of hybridoma from C57BL/6 mice immunized with MOG35-55 to induce EAE. The hybridomas were screened for specificity by measuring MOG35-55-induced IL-2 production. Five hybridomas were selected for further study based on differential responsiveness to MOG35-55 antigen. The 1MOG9, 1MOG23, 1MOG244.2, and 5MOG113 hybridomas were generated by fusing LN-derived T-cells with a BW5147 fusion partner. The 2MOG10 hybridoma was isolated from a fusion of CNS-infiltrating T-cells.
T-cell hybridomas are genetically diverse due to chromosomal loss after cellular fusion (19). To provide a uniform genetic background to compare the responsiveness of the different hybridomas' TCR, we cloned their TCR α and β chain cDNA and introduced these into a stable TCR-deficient cell line. cDNA encoding the TCRα chain, the T. asigna 2A sequence, and the TCRβ chain were linked in a single cistronic element. The T. asigna 2A sequence encodes a 20 amino acid self-cleaving peptide that co-translationally releases the nascent polypeptide from the ribosome while allowing continued read through translation (20,21). This permits near stoichiometric production of the α and β TCR chains from the recombinant construct. The TCRα-2A-TCRβ sequences were then inserted into murine stem cell virus (MSCV)-based retroviral vectors that include an IRES-linked GFP or CFP; MSCV-I-GFP or MSCV-I-CFP. TCR variable (V), junctional (J), and CDR3 sequence information for the cloned TCR chains are provided in Table I.
Table I.
TCR gene use and CDR3 sequence information for cloned α and β TCR cDNA.
| TCR | TRAV | TRAJ | CDR3α | TRBV | TRBJ | CDR3β |
|---|---|---|---|---|---|---|
| 1MOG9 | 12D-3*01 | 17*01 | CALSAANSAGNKLTF | 13-2*01 | 2-4*01 | CASGDWGGEDTLYF |
| 1MOG23 | 12D-2*02 | 18*01 | CALSDRGSALGRLHF | 19*01 | 2-3*01 | CASSIADSSAETLYF |
| 1MOG244.2 | 3-1*01 | 43*01 | CAVSGYNNNAPRF | 13-2*01 | 2-7*01 | CASGDAGTGYEQYF |
| 2MOG10 | 14-2*01 | 21*01 | CAAASRIYNVLYF | 5*01 | 2-5*01 | CASNGLGEEDTQYF |
| 5MOG113 | 9-3*01 | 58*01 | CAVSRTGSKLSF | 20*01 | 2-7*01 | CGARDTLYEQYF |
We transduced retrovirus incorporating the cloned receptors into 4G4 TCRαβ-deficient T-hybridoma cells (22) modified to express CD4, 4G4.CD4 cells, and flow cytometrically purified the TCR-expressing cells. We were thus able to generate T-cell lines that were fundamentally the same except for their distinct TCR.
Each of the 5 receptors was well and similarly expressed on the 4G4.CD4 cells (Fig. 2a). Considering the essentially identical expression of the TCR, and the uniformity of their cellular background, differences in response to MOG35-55 among the transduced 4G4.CD4 cells should therefore be primarily imparted by the recognition properties, or functional affinities, of the TCR.
Figure 2. Expression and function of retroviral TCR in 4G4.CD4 T-cells.

(A) The indicated retrovirally encoded TCR were used to transduce TCR-deficient 4G4.CD4 T-hybridoma cells. Cells, flow cytometrically sorted for TCR expression, were analyzed after staining with TCR and CD4-specific antibodies. (B) Responsiveness of hybridoma obtained as in (A) is shown. The T-cells were stimulated with the indicated dose of MOG35-55 peptide. IL-2 production was measured in the supernatant at 24 h.
When titrations of MOG35-55 were used to stimulate the transduced 4G4.CD4 cells, different responsiveness, determined by IL-2 production, was apparent. Cells expressing the 2MOG10 receptor demonstrated the strongest response to Ag (Fig. 2b). The 1MOG9 and 1MOG244.2 TCRs showed similar intermediate levels of IL-2 production, whereas the 5MOG113 TCR demonstrated low and the 1MOG23 TCR very low response to Ag. An identical pattern was observed in independent transductions of the 4G4.CD4 cells with TCR retrovirus. Therefore the different receptors fall at different locations along a gradient of responsiveness, or functional affinity, with 2MOG10>1MOG9∼1MOG244.2>5MOG113>1MOG23.
Generation of MOG-TCR specific retrogenic mice
To better understand the physiological significance of these different functional affinities, we generated retrogenic mice with each of the TCR. Recombinant retrovirus was used to transduce IL-3, IL-6, and SCF stimulated bone marrow cells from 5-FU-treated Rag1−/− mice. The efficiency of transduction in different experiments, measured by expression of retrovirally encoded GFP or CFP in the bone marrow cells, was variable, though mean efficiencies were not significantly different when comparing the receptor constructs (Fig. 3). The transduced bone marrow was then transplanted into sublethally irradiated Rag1−/− recipients.
Figure 3. Retroviral transduction of bone marrow progenitor cells.

Cytokine stimulated bone marrow cells were transduced with retrovirus encoding the indicated TCR. The efficiency of retroviral transduction was measured by flow cytometric analysis of transduced cells for retrovirally encoded CFP or GFP. Results from 30 independent transductions of pooled bone marrow cells with 1MOG9 TCR, 15 with 2MOG10, 12 each with 1MOG23 and 5MOG113, and 10 with 1MOG244.2 over the course of 18 months is plotted.
Engraftment of CD4+TCR+ T-cells in the retrogenic mice was assessed in peripheral blood ∼4 weeks after transfer (Fig. 4a). The different retrogenic lines demonstrated different levels of engraftment, with 1MOG244.2>5MOG113>2MOG10>>1MOG9∼1MOG23. Analysis of both percent and absolute numbers of CD4+TCR+ retrogenic T-lymphocytes among splenocytes of mice 8-10 weeks after transfer showed a similar hierarchy of mean engraftment levels, with 5MOG113>1MOG244.2>2MOG10>>1MOG9∼1MOG23 (Fig. 4b, c). No correlation was observed between the percent of transduced bone marrow cells and engraftment levels in individual mice (data not shown). Therefore despite equivalent transduction efficiencies of the receptors into bone marrow cells, their ability to reconstitute T-lymphocytes in mice differed.
Figure 4. Engraftment of T-cells in retrogenic mice.

(A) Engraftment of T-lymphocytes was evaluated ∼4 weeks after the generation of retrogenic mice by staining peripheral blood with TCR and CD4-specific antibodies. The percent of T-cells among peripheral blood mononuclear cells from individual mice from multiple experiments is plotted (open circles). Mean engraftment level is shown by the horizontal bar. Differences in engraftment were statistically significant for all combinations of mice except for 1MOG9 and 1MOG23, and 1MOG244.2 and 5MOG113. Some mice without any disease symptoms were sacrificed at ∼8 weeks of age and splenic engraftment level determined. Percent (B) and absolute number (C) of CD4+TCR+ splenic mononuclear cells is shown. Significant differences in engraftment values were observed for all combinations except 1MOG9 and 1MOG23 (for percent and absolute numbers), 1MOG244.2 and 2MOG10 (for percent and absolute numbers), and 1MOG244.2 and 5MOG113 (for absolute numbers only, p=0.055).
Phenotype and function of retrogenic T cells
We next analyzed the phenotype of the retrogenic T-cells derived from ∼8 week old mice. Expression levels of the retrovirally-driven TCRs was modestly to moderately reduced compared with those in wild-type C57BL/6 mice (Fig. 5a), potentially reflecting limitations of the retroviral expression system. Nevertheless, CD4+ T-cells predominated in all lines of retrogenic mice, with few if any CD8+ T-lymphocytes detected (Fig. 5a). This demonstrates that lineage specification was intact in the retrogenic mice, as all the TCR were originally derived from CD4+ T-cell hybridomas. The expression level of CD4 was comparable to that observed in C57BL/6 mice. Consistent with prior reports demonstrating that TCR derived from non-regulatory T-cells, when incorporated into TCR Tg mice on a Rag−/− background, do not differentiate into CD25+ regulatory T-cells (23), few if any T-cells expressing the activation and regulatory marker CD25 were detected (Fig. 5c). In contrast, some cells expressing the CD69 activation marker were seen, suggesting limited endogenous activation of the T-cells (Fig. 5d). Consistent with this, a substantial majority of the cells in the mice were naïve as determined by a high level of expressed CD45RB and a low or moderate level of CD44, though some memory cells were also identified (Fig. 5e).
Figure 5. Phenotypic analysis of retrogenic T cells.

Flow cytometric analysis of surface stained splenocytes from the indicated type of retrogenic mouse or from control C57BL/6 mice is shown. (A) CD4 and TCR staining. (B) CD4 and CD8 staining of gated TCR+ cells. (C) CD4 and CD25 staining of gated CD4+TCR+ cells. (D) CD4 and CD69 staining of gated CD4+TCR+ cells. (E) CD45RB and CD44 staining of gated CD4+TCR+ cells.
To functionally characterize T-cell responsiveness in the 5 lines of mice, we purified splenic CD4+ T-lymphocytes from mice 7-8 week after adoptive transfer of retrovirally transduced progenitor cells, and stimulated the cells with titrations of MOG35-55. Proliferation was measured 72 h later by 3H-thymidine uptake. In most experiments we were not able to compare cells from age-matched mice of all types, however overlapping cohorts of mice were analyzed in separate experiments to establish relative responsiveness, and demonstrated consistent results (Fig. 6a, b). 2MOG10 T-cells showed the strongest response to MOG35-55 Ag. 1MOG9 and 1MOG244.2 showed lesser and similar responses, followed by 5MOG113 and 1MOG23. Therefore, TCR responsiveness in the different retrogenic lineages matched the functional affinity measurements obtained with isolated TCR transduced into the 4G4.CD4 hybridomas. This suggests that Ag responsiveness of the primary T-cells was determined by intrinsic properties of the TCR, and was not influenced by differential “tuning” of the TCR signal transduction apparatus during T-cell development (24).
Figure 6. Functional response of retrogenic T-cells.

CD4 T-cells were purified from retrogenic mice ∼8 week after progenitor cell transfer by magnetic bead isolation and stimulated with the indicated concentration of MOG35-55 peptide in the presence of irradiated splenic APCs. Proliferation was measured by [3H]thymidine incorporation at 72 h comparing 1MOG9, 1MOG23, 2MOG10, and 5MOG113 T-cells (A) or 1MOG9 and 1MOG44.2 T-cells (B).
Consistent with the largely naïve status of the primary T-cells, IL-2 was the pre-dominant cytokine produced on primary stimulation. Significant levels of IL-4, IL-10, IL-17, IFN-γ, and TNFα were not detected from primary stimulated T-cells in most experiments, though low and variable levels of IFN-γ were detected in some experiments (data not shown).
In summary, Rag1−/− bone marrow derived stem cells transduced with MOG-specific TCR provide for the development of monotypic T-cells within Rag1−/− recipients. The retrogenic T-cells are functional, Ag-restricted, and at ∼8 weeks after transfer predominantly naïve. Response characteristics of the retrogenic T-cells are further defined by the properties of their constituent TCR.
Spontaneous EAE in retrogenic mice
Active immunization is required to induce EAE in most model systems. However, in many mice Tg for a myelin specific TCR and bred onto a Rag−/− background, which lacks Foxp3+ regulatory T-cells, EAE develops spontaneously (25). We hypothesized that the frequency and severity of spontaneous EAE development would correlate with functional responsiveness of the different TCR. To examine this, we observed cohorts of mice longitudinally, assessing for the development of EAE. Spontaneous disease did develop. Kaplan-Meier analyses demonstrated that the probability of disease-free survival varied substantially with the different TCR (Fig. 7, Table II). Surprisingly, the risk of disease development was not associated with functional affinity / TCR responsiveness as determined with the 4G4.CD4 cells or primary T-cells. 1MOG244.2 mice had the highest risk of developing disease, with 100% of the cohort examined developing spontaneous disease. The 1MOG9 mice, T-cells from which had nearly identical functional responsiveness as the 1MOG244.2 cells, had the 2nd lowest risk of disease, with fewer than 20% of mice developing spontaneous disease. 2MOG10 mice, whose T-cells had the highest functional affinity, and 1MOG23 mice, whose T-cells had the lowest, each had intermediate risks of disease. No 5MOG113 mice developed spontaneous EAE during a nearly 6 month interval of observation. Therefore, risk of spontaneous disease development was independent of TCR responsiveness to Ag.
Table II. Characteristics of mice developing spontaneous EAE.
Number of mice, maximal disease score, day of onset, and mortality and relapse rates of mice spontaneously developing EAE are shown. Relapses were defined as mice whose disease score improved by a score of one or more for at least 2 successive measurements, and then worsened by a score of one or more for 2 successive measurements.
| TCR | Mice No. | Maximal Score |
Disease onset (d) |
Mortality | Relapse |
|---|---|---|---|---|---|
| 1MOG9 | 8 | 4.0±1.2 | 81±28 | 4/8 | 0/8 |
| 1MOG23 | 10 | 4.7±0.9 | 62±30 | 9/10 | 5/10 |
| 1MOG244.2 | 10 | 4.9±0.3 | 52±10 | 9/10 | 1/10 |
| 2MOG10 | 9 | 2.8±1.9 | 108±19 | 3/9 | 3/9 |
The different mice did not only differ in the rate of spontaneous autoimmunity. Severity of the autoimmune disease that did develop varied between the mice, with 1MOG244.2 and 1MOG23 mice having the highest incidence of lethal disease and 2MOG10 mice, which have the highest affinity T cells, the lowest mortality and maximal disease scores (Table II). Particulary interesting was that many of the mice, despite having a mono-specific repertoire, demonstrated a relapsing remitting pattern of diseases (Fig. 8). Therefore retrogenic mice with distinct TCR are associated with unique susceptibilities to and manifestations of spontaneous EAE.
Figure 8. Disease courses in mice developing spontaneous autoimmune disease.

Clinical disease scores are plotted for single animals demonstrating a relapsing remitting course that developed in some 1MOG23 (A-D), 2MOG10 (E-F), and 1MOG244.2 (G) mice. Single examples of other disease pattern are also shown including a 1MOG244.2 mouse remitting after developing severe disease (H), and 1MOG23 (I) and 2MOG10 (J) mice developing rapidly progressive disease.
Induced EAE in retrogenic mice
One explanation of the distinct rates of spontaneous disease in the different mice was that the intrinsic pathologic potential of T-cells bearing the different TCR varied independently of their in vitro response to MOG35-55 peptide. To test for this, we looked at actively induced autoimmunity in mice expressing the different TCR. Retrogenic mice, ∼7-10 weeks after stem cell transfer, were immunized with either a standard dose (100 μg) or a low dose (10 μg) of MOG35-55 peptide. Either dose induced rapid, severe, and typically lethal disease in all of the different mice except 5MOG113 mice, which were not susceptible to disease induction (Fig. 9 and Table III). Minor differences in time to disease onset among cohorts were observed, but these were not consistent across experiments. Therefore, the distinct incidences of spontaneous disease cannot be explained by inherent differences in the receptors' abilities to mediate autoimmune encephalomyelitis in response to immunization with cognate antigen.
Figure 9. Active EAE induction in retrogenic mice.
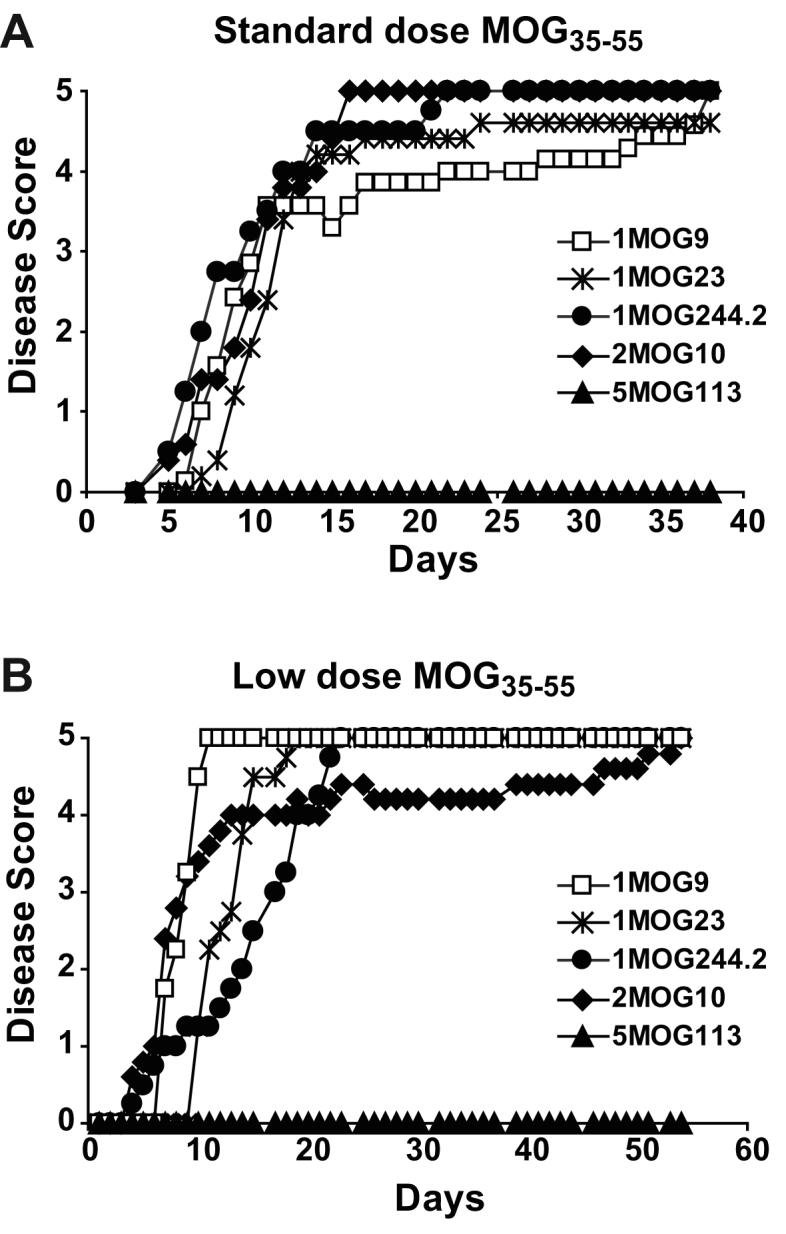
Mean clinical disease score is plotted for groups of 5 mice, ∼8 weeks old and with no clinical symptoms of spontaneous EAE, immunized with a standard 100 μg dose of MOG35-55 (A) or a lower 10 μg dose (B).
Table III. EAE induced by active immunization.
Cumulative disease incidence, maximum disease score, mortality rate, and day of disease onset is listed for experiments in which the indicated type of retrogenic mice were immunized with a standard dose (100 μg MOG35-55 peptide; 2 experiments for all mice types except 3 experiments for 2MOG10) or low dose (10 μg MOG35-55 peptide; 2 experiments for all mice types) regimen.
| Expt | TCR | Mice No. | Disease incidence |
Max. Score | Mortality | Disease onset (d) |
|---|---|---|---|---|---|---|
| Std | ||||||
| Dose | 1MOG9 | 12 | 12/12 | 4.7±0.6 | 9/12 | 7.8±0.9 |
| 1MOG23 | 10 | 10/10 | 4.8±0.6 | 9/10 | 9.7±3.0 | |
| 1MOG244.2 | 9 | 9/9 | 5±0 | 9/9 | 10.7±4.5 | |
| 2MOG10 | 15 | 15/15 | 5±0 | 15/15 | 7.1±1.5 | |
| 5MOG113 | 12 | 0/12 | NA | NA | NA | |
| Low | ||||||
| Dose | 1MOG9 | 9 | 9/9 | 5±0 | 9/9 | 8.0±1.3 |
| 1MOG23 | 9 | 9/9 | 5±0 | 9/9 | 11.2±1.1 | |
| 1MOG244.2 | 8 | 8/8 | 5±0 | 8/8 | 12.6±4.0 | |
| 2MOG10 | 10 | 10/10 | 5±0 | 10/10 | 7.4±2.8 | |
| 5MOG113 | 10 | 0/10 | NA | NA | NA |
The one exception was the 5MOG113 TCR. Despite possessing T-cells that showed strong responses to MOG35-55 peptide, these mice failed to develop actively induced or spontaneous disease. Recent analyses of MOG35-55-specific T-cells in C57BL/6 mice have indeed documented a subset of receptors, ∼10% of the MOG35-55-specific response, that fail to respond to naturally processed MOG protein despite responding to MOG35-55 peptide (26). Non-responsiveness to processed MOG protein could explain the absence of disease in the 5MOG113 mice. To test for this, we produced the extracellular domain of MOG using a baculovirus protein-production system and analyzed whether the different T-cells were able to proliferate or produce cytokine in response to it (Fig. 10a, b). Responses to protein, when present, were weak. Nevertheless all retrogenic T-cells except for 5MOG113 cells responded to both peptide and protein; 5MOG113 T-cells only responded to peptide. Therefore the 5MOG113 T-cells recognize an epitope contained within the MOG35-55 peptide but not naturally processed in adequate quantity to stimulate the cells in situ.
Figure 10. T-cell response to MOG protein.

The extracellular domain of MOG was prepared using a baculovirus production system and either purified MOG protein or MOG35-55 peptide was used to stimulate purified CD4+ T-cells from the different TCR retrogenic mice. Proliferation (A) was measured at 72 h by [3H]thymidine incorporation and IL-2 production (B) at 48 h by Bio-plex analysis.
Engraftment is associated with risk of spontaneous EAE
Excluding the 5MOG113 mice, T-cells from which do not recognize processed MOG protein, risk for spontaneous disease roughly followed T-cell engraftment in the different lines of mice, either in peripheral blood measured ∼4 weeks after adoptive transfer of transduced bone marrow, or in splenocytes measured at ∼8-10 weeks. Engraftment levels ordered as 1MOG244.2>2MOG10>1MOG23∼1MOG9 while spontaneous disease risk ranked 1MOG244.2>2MOG10>1MOG23>1MOG9. If indeed engraftment levels were associated with disease risk, then it would be expected that within a cohort of mice simultaneously produced from a single batch of progenitor cells and expressing a single TCR, blood engraftment levels at 4 weeks in mice developing spontaneous disease would be greater than that in mice not developing EAE. This indeed was the case. Analysis of single cohorts of mice followed for >150 days demonstrated that mice developing spontaneous EAE consistently trended toward a higher 4 week engraftment in peripheral blood than those not developing disease (Fig. 11). The difference between 4 week engraftment levels proved to be statistically significant only in the 1MOG23 mice. Nevertheless, this occurred despite the very first disease symptoms in any of the mice not appearing until at least 6 weeks of age, and most of the mice not developing disease until significantly later. These results indicate that engraftment levels, even measured weeks prior to clinical symptoms, is an important indicator of disease susceptibility.
Figure 11. Peripheral blood engraftment in mice developing spontaneous EAE.
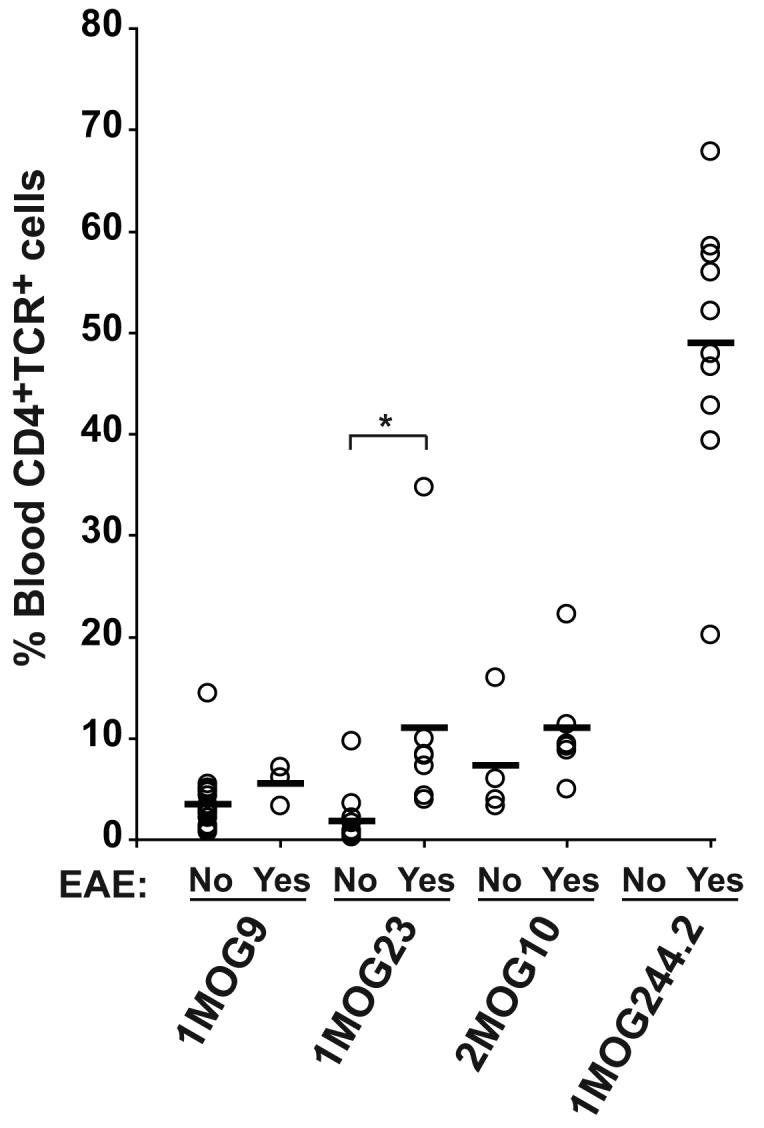
Single batches of 1MOG9, 1MOG23, 1MOG244.2, and 2MOG10 mice were generated. At 4 weeks, prior to the presence of disease symptoms in any mice, peripheral blood was isolated and the percent of CD4+TCR+ cells among mononuclear cells determined. The mice were subsequently monitored for the development of spontaneous EAE disease. 4 week engraftment level is plotted among mice subsequently developing EAE and mice not developing EAE after a >150 day monitoring period. Among these cohorts of mice, the first disease symptoms were detected at d 42 for 1MOG23 and 2MOG10 mice, d 66 for 1MOG9 mice, and d 82 for 1MOG244.2 mice. 100% of the 1MOG244.2 cohort developed EAE. *, p<0.05.
Discussion
To gain insight into the role of the TCR in T-cell pathogenicity, we cloned and developed TCR retrogenic mice with 5 different MOG-specific TCR. The TCR, when transduced into identical TCR-deficient cells, displayed a spectrum of responsiveness, or functionally-defined affinities, for cognate Ag. Retrogenic modeling represents an alternative to transgenesis for the analysis of TCR (12). Although retrogenesis has been used to study TCR previously (27,28), it has not been used to examine multiple different TCR specific for a single antigenic epitope. Our work displays both the power of retrogenic modeling to compare different TCRs in this regard, as well as some of its limitations. All TCR were well expressed on retrogenic T-cells, though the expression level was diminished compared with TCR expressed on wild-type T-cells. The level of T-cell engraftment varied significantly with the specific TCR, but also showed separate variability among individual mice.
Despite this intrinsic variability, the retrogenic models proved informative. Purified retrogenic T-cells showed relative responsiveness identical to that observed with transduced TCR-deficient 4G4.CD4 hybridomas. This suggests that differences in TCR expression levels or biochemical tuning of response thresholds did not significantly influence Ag responsiveness (11,24). The large majority of cells remained naïve even ∼8 weeks after progenitor cell transfer, implying that these self-specific T-cells were not being stimulated en masse by self Ag. Interestingly, the lowest level of memory cells were identified in the 5MOG113 mice, T-cells from which recognized MOG35-55 peptide but not processed MOG protein, and lower levels typified the mice (1MOG9, 1MOG23) less prone to spontaneous autoimmunity. This suggests that the memory cells developing in the retrogenic mice formed largely after stimulation with endogenous MOG Ag, and not cross-reactive proteins.
Because the Rag1−/− mice are unable to rearrange endogenous TCR, the T-cells developing in the retrogenic mice are monotypic. Further, the virtual absence of CD4+CD25+ T-cells implies that the cells do not develop into the Foxp3+ regulatory lineage which are predominantly CD4+CD25+ (29). This is consistent with findings by several groups demonstrating that naïve T-cells developing in TCR-Tg mice on a Rag-deficient background lack Foxp3+ regulatory T-cells (23). Therefore EAE development in retrogenic mice is unencumbered by the complexity of multiple competing responses by different clones of T-cells and by mixed regulatory and effector responses. Within this context it would be expected that TCR sequence, that is functional affinity, would be a primary determinant in defining T-cell pathogenicity. Surprisingly, this proved not to be the case.
Ag affinity has been identified as a critical determinant of immune dominance among CD8 T-cells in the response to infectious agents (2,30). Less data is available with CD4 T-cells. However, in the responses to pigeon cytochrome C and sperm whale myoglobin, increased affinity was associated with enhanced early responsiveness (31,32). More recent studies have qualified these findings, suggesting that affinity primarily plays a role when Ag is limiting (33,34). In situations of Ag excess, limited affinity-based competition is apparent. In studies of autoimmunity, the role of affinity is less well characterized. Two studies assessing this came to distinct conclusions, with an analysis of MBP-induced EAE failing to identify a role for avidity in response evolution, and a study of diabetes implying the presence of avidity based competition (7,8). This difference may reflect differences in Ag quantity. CNS MBP is highly abundant, and an animal afflicted with EAE will likely succumb prior to significant alterations in Ag quantity. In contrast, islet specific Ag, is scant, and auto-antigen availability may become highly limited prior to the development of fatal diabetes. Therefore the absence of association between functional affinity and disease in our studies may reflect the abundance of myelin Ag.
Over the past decade, studies have also attempted to assess the role of T-cell frequency in T-cell response magnitude, typically through the transfer of Ag-specific T-cells (35). Studies in NOD mice associated the frequency of islet-specific CD8 T-cells in the blood with the subsequent development of diabetes (36). A recent analysis refining tetramer staining so as to permit the detection of as few as 5 Ag-specific T-cells per mouse, supported a critical role for T-cell frequency in response magnitude to immunizing Ag (37). Moreover, the diversity of the responding cells paralleled that of the naïve population, implying that in these responses competition was not prominent.
In our analyses, splenic engraftment of retrogenic T-cells varied from several hundred thousand to several million cells depending on the TCR. Considering that responses starting with 20 or fewer cells are capable of expanding and generating a detectable immune response to a conventional Ag, it would be anticipated that these numbers of cells should be able to initiate autoimmune disease. This indeed appears true with actively induced EAE, as immunization with MOG35-55 generated equivalent disease responses in the different lines of retrogenic mice. Yet our results suggest that engraftment level is a critical determinant in spontaneous disease development. This implies that a critical mass of autoreactive T-cells must be present to overcome barriers preventing spontaneous autoimmune disease development. Whether this reflects a stochastic effect, where a rare subset of T-cells become sufficiently activated and initiate autoimmune disease, and high engraftment increases the probability of this event, or whether there is a “mass effect” whereby large numbers of specific T-cells stimulated by self-antigen are required to overcome homeostatic mechanisms in the absence of adjuvant-provided inflammatory signals is unclear and will be important to evaluate.
In summary, our results demonstrate that the functionally-defined affinity of MOG-specific T-cells is not critical in overcoming barriers to spontaneous autoimmune disease development in retrogenic mice. Under highly inflammatory conditions, such as with immunization in the presence of CFA, pathogenicity also remains independent of affinity. In contrast, T-cell frequency is critical to the development of spontaneous autoimmune disease in mice and, even in the absence of CD4+CD25+ regulatory T-cells, at least several hundred thousand Ag specific T-cells are required to overcome barriers preventing spontaneous autoimmunity.
Acknowledgements
We thank Dario Vignali for assistance with establishing retrogenic modeling, Richard Cross and Yuxia He for assistance with flow cytometric sorting, Jennifer Smith for assistance with Bio-plex analyses, and Richard Heath and Muralidhar Reddivari for assistance with MOG protein preparation.
This work was supported by the National Institutes of Health Grant R01 AI056153 (to TLG) and by the American Lebanese Syrian Associated Charities/St. Jude Children's Research Hospital (to all authors).
Footnotes
Publisher's Disclaimer: This is an author-produced version of a manuscript accepted for publication in The Journal of Immunology (The JI). The American Association of Immunologists, Inc. (AAI), publisher of The JI, holds the copyright to this manuscript. This version of the manuscript has not yet been copyedited or subjected to editorial proofreading by The JI; hence, it may differ from the final version published in The JI (online and in print). AAI (The JI) is not liable for errors or omissions in this author-produced version of the manuscript or in any version derived from it by the U.S. National Institutes of Health or any other third party. The final, citable version of record can be found at www.jimmunol.org.
Reference List
- 1.Manning TC, Kranz DM. Binding energetics of T-cell receptors: correlation with immunological consequences. Immunol Today. 1999;20:417–422. doi: 10.1016/s0167-5699(99)01508-x. [DOI] [PubMed] [Google Scholar]
- 2.Kedl RM, Kappler JW, Marrack P. Epitope dominance, competition and T cell affinity maturation. Curr. Opin. Immunol. 2003;15:120–127. doi: 10.1016/s0952-7915(02)00009-2. [DOI] [PubMed] [Google Scholar]
- 3.Zehn D, Bevan MJ. T cells with low avidity for a tissue-restricted antigen routinely evade central and peripheral tolerance and cause autoimmunity. Immunity. 2006;25:261–270. doi: 10.1016/j.immuni.2006.06.009. [DOI] [PMC free article] [PubMed] [Google Scholar]
- 4.Gatzka M, Walsh CM. Apoptotic signal transduction and T cell tolerance. Autoimmunity. 2007;40:442–452. doi: 10.1080/08916930701464962. [DOI] [PubMed] [Google Scholar]
- 5.Holler PD, Kranz DM. Quantitative analysis of the contribution of TCR/pepMHC affinity and CD8 to T cell activation. Immunity. 2003;18:255–264. doi: 10.1016/s1074-7613(03)00019-0. [DOI] [PubMed] [Google Scholar]
- 6.Holler PD, Lim AR, Cho BK, Rund LA, Kranz DM. CD8(-) T cell transfectants that express a high affinity T cell receptor exhibit enhanced peptide-dependent activation. J Exp. Med. 2001;194:1043–1052. doi: 10.1084/jem.194.8.1043. [DOI] [PMC free article] [PubMed] [Google Scholar]
- 7.Hofstetter HH, Targoni OS, Karulin AY, Forsthuber TG, Tary-Lehmann M, Lehmann PV. Does the frequency and avidity spectrum of the neuroantigen-specific T cells in the blood mirror the autoimmune process in the central nervous system of mice undergoing experimental allergic encephalomyelitis? J Immunol. 2005;174:4598–4605. doi: 10.4049/jimmunol.174.8.4598. [DOI] [PubMed] [Google Scholar]
- 8.Amrani A, Verdaguer J, Serra P, Tafuro S, Tan R, Santamaria P. Progression of autoimmune diabetes driven by avidity maturation of a T-cell population. Nature. 2000;406:739–742. doi: 10.1038/35021081. [DOI] [PubMed] [Google Scholar]
- 9.Bettelli E, Pagany M, Weiner HL, Linington C, Sobel RA, Kuchroo VK. Myelin oligodendrocyte glycoprotein-specific T cell receptor transgenic mice develop spontaneous autoimmune optic neuritis. J Exp. Med. 2003;197:1073–1081. doi: 10.1084/jem.20021603. [DOI] [PMC free article] [PubMed] [Google Scholar]
- 10.Mendel I, Natarajan K, Ben-Nun A, Shevach EM. A novel protective model against experimental allergic encephalomyelitis in mice expressing a transgenic TCR-specific for myelin oligodendrocyte glycoprotein. J Neuroimmunol. 2004;149:10–21. doi: 10.1016/j.jneuroim.2003.12.007. [DOI] [PubMed] [Google Scholar]
- 11.Kuchroo VK, Anderson AC, Waldner H, Munder M, Bettelli E, Nicholson LB. T cell response in experimental autoimmune encephalomyelitis (EAE): role of self and cross-reactive antigens in shaping, tuning, and regulating the autopathogenic T cell repertoire. Annu. Rev. Immunol. 2002;20:101–123. doi: 10.1146/annurev.immunol.20.081701.141316. [DOI] [PubMed] [Google Scholar]
- 12.Holst J, Szymczak-Workman AL, Vignali KM, Burton AR, Workman CJ, Vignali DA. Generation of T-cell receptor retrogenic mice. Nat. Protoc. 2006;1:406–417. doi: 10.1038/nprot.2006.61. [DOI] [PubMed] [Google Scholar]
- 13.Holst J, Vignali KM, Burton AR, Vignali DA. Rapid analysis of T-cell selection in vivo using T cell-receptor retrogenic mice. Nat. Methods. 2006;3:191–197. doi: 10.1038/nmeth858. [DOI] [PubMed] [Google Scholar]
- 14.Inaba H, Geiger TL. Defective cell cycle induction by IL-2 in naive T-cells antigen stimulated in the presence of refractory T-lymphocytes. Int. Immunol. 2006;18:1043–1054. doi: 10.1093/intimm/dxl038. [DOI] [PubMed] [Google Scholar]
- 15.Duplan V, Suberbielle E, Napper CE, Joly E, Saoudi A, Gonzalez-Dunia D. Tracking antigen-specific CD8+ T cells in the rat using MHC class I multimers. J Immunol. Methods. 2007;320:30–39. doi: 10.1016/j.jim.2006.11.008. [DOI] [PubMed] [Google Scholar]
- 16.White J, Blackman M, Bill J, Kappler J, Marrack P, Gold DP, Born W. Two better cell lines for making hybridomas expressing specific T cell receptors. J Immunol. 1989;143:1822–1825. [PubMed] [Google Scholar]
- 17.Persons DA, Allay JA, Allay ER, Smeyne RJ, Ashmun RA, Sorrentino BP, Nienhuis AW. Retroviral-mediated transfer of the green fluorescent protein gene into murine hematopoietic cells facilitates scoring and selection of transduced progenitors in vitro and identification of genetically modified cells in vivo. Blood. 1997;90:1777–1786. [PubMed] [Google Scholar]
- 18.Moisini I, Nguyen P, Fugger L, Geiger TL. Redirecting Therapeutic T Cells against Myelin-Specific T Lymphocytes Using a Humanized Myelin Basic Protein-HLA-DR2-{zeta} Chimeric Receptor. J Immunol. 2008;180:3601–3611. doi: 10.4049/jimmunol.180.5.3601. [DOI] [PubMed] [Google Scholar]
- 19.Kappler JW, Skidmore B, White J, Marrack P. Antigen-inducible, H-2-restricted, interleukin-2-producing T cell hybridomas. Lack of independent antigen and H-2 recognition. J Exp. Med. 1981;153:1198–1214. doi: 10.1084/jem.153.5.1198. [DOI] [PMC free article] [PubMed] [Google Scholar]
- 20.Donnelly ML, Hughes LE, Luke G, Mendoza H, ten Dam E, Gani D, Ryan MD. The ‘cleavage’ activities of foot-and-mouth disease virus 2A site-directed mutants and naturally occurring ‘2A-like’ sequences. J. Gen. Virol. 2001;82:1027–1041. doi: 10.1099/0022-1317-82-5-1027. [DOI] [PubMed] [Google Scholar]
- 21.Donnelly ML, Luke G, Mehrotra A, Li X, Hughes LE, Gani D, Ryan MD. Analysis of the aphthovirus 2A/2B polyprotein ‘cleavage’ mechanism indicates not a proteolytic reaction, but a novel translational effect: a putative ribosomal ‘skip’. J. Gen. Virol. 2001;82:1013–1025. doi: 10.1099/0022-1317-82-5-1013. [DOI] [PubMed] [Google Scholar]
- 22.Wolff C, Hong S, vonGrafenstein H, Janeway C. TCR-CD4 and TCR-TCR interactions as distinctive mechanisms for the induction of increased intracellular calcium in T-cell signaling. J. Immunol. 1993;151:1337–1345. [PubMed] [Google Scholar]
- 23.Picca CC, Larkin J, III, Boesteanu A, Lerman MA, Rankin AL, Caton AJ. Role of TCR specificity in CD4+ CD25+ regulatory T-cell selection. Immunol. Rev. 2006;212:74–85. doi: 10.1111/j.0105-2896.2006.00416.x. [DOI] [PubMed] [Google Scholar]
- 24.van den Boorn JG, Le P, I, Luiten RM. T-cell avidity and tuning: the flexible connection between tolerance and autoimmunity. Int. Rev. Immunol. 2006;25:235–258. doi: 10.1080/08830180600743081. [DOI] [PMC free article] [PubMed] [Google Scholar]
- 25.Furtado GC, Olivares-Villagomez D, Curotto de Lafaille MA, Wensky AK, Latkowski JA, Lafaille JJ. Regulatory T cells in spontaneous autoimmune encephalomyelitis. Immunol. Rev. 2001;182:122–134. doi: 10.1034/j.1600-065x.2001.1820110.x. [DOI] [PubMed] [Google Scholar]
- 26.Sweenie CH, Mackenzie KJ, Rone-Orugboh A, Liu M, Anderton SM. Distinct T cell recognition of naturally processed and cryptic epitopes within the immunodominant 35-55 region of myelin oligodendrocyte glycoprotein. J Neuroimmunol. 2007;183:7–16. doi: 10.1016/j.jneuroim.2006.10.018. [DOI] [PubMed] [Google Scholar]
- 27.Arnold PY, Burton AR, Vignali DA. Diabetes incidence is unaltered in glutamate decarboxylase 65-specific TCR retrogenic nonobese diabetic mice: generation by retroviral-mediated stem cell gene transfer. J Immunol. 2004;173:3103–3111. doi: 10.4049/jimmunol.173.5.3103. [DOI] [PubMed] [Google Scholar]
- 28.Yang L, Qin XF, Baltimore D, Van PL. Generation of functional antigen-specific T cells in defined genetic backgrounds by retrovirus-mediated expression of TCR cDNAs in hematopoietic precursor cells. Proc. Natl. Acad. Sci. U. S. A. 2002;99:6204–6209. doi: 10.1073/pnas.092154599. [DOI] [PMC free article] [PubMed] [Google Scholar]
- 29.Shevach EM. CD4+ CD25+ suppressor T cells: more questions than answers. Nat. Rev. Immunol. 2002;2:389–400. doi: 10.1038/nri821. [DOI] [PubMed] [Google Scholar]
- 30.Price DA, Brenchley JM, Ruff LE, Betts MR, Hill BJ, Roederer M, Koup RA, Migueles SA, Gostick E, Wooldridge L, Sewell AK, Connors M, Douek DC. Avidity for antigen shapes clonal dominance in CD8+ T cell populations specific for persistent DNA viruses. J Exp. Med. 2005;202:1349–1361. doi: 10.1084/jem.20051357. [DOI] [PMC free article] [PubMed] [Google Scholar]
- 31.Fasso M, Anandasabapathy N, Crawford F, Kappler J, Fathman CG, Ridgway WM. T cell receptor (TCR)-mediated repertoire selection and loss of TCR vbeta diversity during the initiation of a CD4(+) T cell response in vivo. J Exp. Med. 2000;192:1719–1730. doi: 10.1084/jem.192.12.1719. [DOI] [PMC free article] [PubMed] [Google Scholar]
- 32.Malherbe L, Hausl C, Teyton L, McHeyzer-Williams M. Clonal selection of helper T cells is determined by an affinity threshold with no further skewing of TCR binding properties. Immunity. 2004;21:669–679. doi: 10.1016/j.immuni.2004.09.008. [DOI] [PubMed] [Google Scholar]
- 33.Rees W, Bender J, Teague TK, Kedl RM, Crawford F, Marrack P, Kappler J. An inverse relationship between T cell receptor affinity and antigen dose during CD4(+) T cell responses in vivo and in vitro. Proc. Natl. Acad. Sci. U. S. A. 1999;96:9781–9786. doi: 10.1073/pnas.96.17.9781. [DOI] [PMC free article] [PubMed] [Google Scholar]
- 34.Blair DA, Lefrancois L. Increased competition for antigen during priming negatively impacts the generation of memory CD4 T cells. Proc. Natl. Acad. Sci. U. S. A. 2007;104:15045–15050. doi: 10.1073/pnas.0703767104. [DOI] [PMC free article] [PubMed] [Google Scholar]
- 35.Butz EA, Bevan MJ. Massive expansion of antigen-specific CD8+ T cells during an acute virus infection. Immunity. 1998;8:167–175. doi: 10.1016/s1074-7613(00)80469-0. [DOI] [PMC free article] [PubMed] [Google Scholar]
- 36.Trudeau JD, Kelly-Smith C, Verchere CB, Elliott JF, Dutz JP, Finegood DT, Santamaria P, Tan R. Prediction of spontaneous autoimmune diabetes in NOD mice by quantification of autoreactive T cells in peripheral blood. J Clin. Invest. 2003;111:217–223. doi: 10.1172/JCI16409. [DOI] [PMC free article] [PubMed] [Google Scholar]
- 37.Moon JJ, Chu HH, Pepper M, McSorley SJ, Jameson SC, Kedl RM, Jenkins MK. Naive CD4(+) T cell frequency varies for different epitopes and predicts repertoire diversity and response magnitude. Immunity. 2007;27:203–213. doi: 10.1016/j.immuni.2007.07.007. [DOI] [PMC free article] [PubMed] [Google Scholar]