

Abstract
The equilibrium for formation of the intramolecular hydrogen bond (KHB) in a series of substituted salicylate monoanions was investigated as a function of ΔpKa, the difference between the pKa values of the hydrogen bond donor and acceptor, in both water and dimethyl sulfoxide. The dependence of log KHB upon ΔpKa is linear in both solvents, but is steeper in dimethyl sulfoxide (slope = 0.73) than in water (slope = 0.05). Thus, hydrogen bond strength can undergo substantially larger increases in nonaqueous media than aqueous solutions as the charge density on the donor or acceptor atom increases. These results support a general mechanism for enzymatic catalysis, in which hydrogen bonding to a substrate is strengthened as charge rearranges in going from the ground state to the transition state; the strengthening of the hydrogen bond would be greater in a nonaqueous enzymatic active site than in water, thus providing a rate enhancement for an enzymatic reaction relative to the solution reaction. We suggest that binding energy of an enzyme is used to fix the substrate in the low-dielectric active site, where the strengthening of the hydrogen bond in the course of a reaction is increased.
Keywords: hydrogen bonding, active site environments
Electronic rearrangement typically occurs in the course of a reaction, resulting in changes in the charge density of functional groups on the reactant. This is shown in Scheme SI for the example of the triosephosphate isomerase (TIM) reaction.
Scheme I.

As the reaction proceeds from the ground state to the transition state, negative charge accumulates on the carbonyl oxygen, as reflected by the ≈10-unit increase in the pKa of this group. [The pKa of the carbonyl oxygen in the ground state is estimated to be −2 to 0; the pKa of the enol hydroxyl in a fully enolic transition state is estimated to be ≈10 (1).] The hydrogen bond (H bond) from a histidine residue of TIM to the carbonyl oxygen can be strengthened by this charge buildup (depicted by the darker dots in Scheme SI). However, to obtain a rate enhancement relative to the solution reaction, the strengthening of an H bond to an enzymatic group in the course of a reaction must be greater than the strengthening of the corresponding H bond to water.
Could the environment of the enzyme active site increase the change in H bond strength accompanying charge rearrangements relative to that in water? To address this question, we used the aprotic organic solvent dimethyl sulfoxide (DMSO) as a crude mimic of the active site environment and investigated the energetics of the intramolecular H bond in a series of substituted salicylate monoanions in both DMSO and water. There is a larger increase in H bond strength in DMSO than in water as the pKa values of the H bonding groups are varied. We suggest that a substantial amount of catalysis can be obtained by enzymes from the greater strengthening of H bonds accompanying charge rearrangements in nonaqueous environments than in aqueous solutions.
MATERIALS AND METHODS
Materials.
The indicators 2,6-di-tert-butyl-4-nitrophenol and 9-carboxymethylfluorene were synthesized from 2,6-di-tert-butylphenol (Fluka) and 9-fluorenecarboxylic acid (Aldrich), respectively, as described (2–4). The indicator 2,4-dinitrophenol was from Sigma. Compounds 1-11 were from Aldrich. Compound 12 was a hydrolysis product of phthalide (Aldrich). Phosphoric acid, citric acid, and DMSO (>99.9%) were from J. T. Baker. Deuterated DMSO and water were from Cambridge Isotope Laboratories (Cambridge, MA). All compounds were of the highest commercial grade available and were dried in vacuo over P2O5 for >24 hr prior to use. Compounds with purity <98% were further purified by recrystallization.
Determination of pKaobsd in DMSO.
Observed pKa values (pKaobsd) of the carboxylic acid groups in compounds 1–11 in DMSO were measured by the overlapping indicator method at 25°C (2–4). The indicators used were 2,4-dinitrophenol, 2,6-di-tert-butyl-4-nitrophenol, and 9-carboxymethylfluorene [pKa values of 5.12, 7.30, and 10.35 in DMSO, respectively (2, 3)]. Each pKa in Table 1 was measured with two indicators whose pKa values bracket that of the compound of interest. Standard deviations in the pKaobsd values from independent determinations varied from ±0.02 to ±0.14, with an average standard deviation of ±0.06.
Table 1.
Formation constants and ΔpKa values of the H bond in substituted SA monoanions in DMSO and water
| Compound | pKaobsd*
|
pKaint†
|
ΔpKa*
|
log
KHB‡
|
||||
|---|---|---|---|---|---|---|---|---|
| DMSO | H2O | DMSO | H2O | DMSO | H2O | DMSO | H2O | |
| 4-OH-SA (1) | 7.1 | 3.2 | 13.7 | 5.0 | 0.1 | 3.0 | 6.6 | 1.8 |
| 4-Br-SA (2) | 5.5 | 2.7 | 11.9 | 4.4 | 0.8 | 3.3 | 6.4 | 1.7 |
| 4-OMe-SA (3) | 7.1 | 3.2 | 13.1 | 4.9 | 0.9 | 3.4 | 5.9 | 1.7 |
| 5-Br-SA (4) | 5.3 | 2.5 | 11.5 | 4.2 | 1.7 | 3.7 | 6.2 | 1.7 |
| 5-Cl-SA (5) | 5.4 | 2.5 | 11.5 | 4.2 | 2.0 | 3.8 | 6.1 | 1.8 |
| 4-Me-SA (6) | 7.0 | 3.0 | 12.7 | 4.7 | 2.2 | 3.9 | 5.8 | 1.7 |
| SA (7) | 6.6 | 2.9 | 12.4 | 4.6 | 2.2 | 3.9 | 5.8 | 1.7 |
| 5-F-SA (8) | 5.8 | 2.5 | 11.6 | 4.2 | 2.7 | 4.1 | 5.8 | 1.7 |
| 5-Me-SA (9) | 6.8 | 3.0 | 12.5 | 4.6 | 2.9 | 4.2 | 5.7 | 1.7 |
| 5-OMe-SA (10) | 6.6 | 2.8 | 12.1 | 4.5 | 3.1 | 4.3 | 5.5 | 1.7 |
| 5-OH-SA (11) | 7.1 | 2.8 | 12.1 | 4.5 | 4.5 | 4.9 | 5.0 | 1.6 |
Only one significant number is reported for the pKa values for clarity, though the more precise pKa values were used to calculate log KHB and ΔpKa.
Determined as described in Materials and Methods.
Values listed are the intrinsic pKa values of the COOH groups, determined as described in Materials and Methods. The intrinsic pKa values of the OH groups are not listed for simplicity, though they were used to calculate the ΔpKa values. These values can be obtained from pKaΦOH,int = pKaΦCOOH,int + ΔpKa (see Materials and Methods).
Obtained from the relationship: log KHB = log(Kaobsd/Kaint) = pKaint − pKaobsd, derived from Scheme SIIA.
Determination of pKaobsd in Water.
Observed pKa values in water were determined by spectral titrations. The spectra of 50 μM solutions of substituted salicylic acids were measured in buffered solutions with pH values from 0 to 6.0 at 25°C. The change in absorbance at appropriate wavelengths as a function of pH was fit to a titration curve. Absorbance changes were typically 0.2 to 0.3, and correlation coefficients of nonlinear least squares fits were >0.99. The buffers used were as follows: 1.0 M and 0.10 M hydrochloric acid (pH 0 and 1.0, respectively), 5 mM sodium phosphate (pH 1.6–3.0), and 5 mM sodium citrate (pH 2.8–6.0). The ionic strength was not held constant. The pKa values determined from absorbance changes at two wavelengths differ by 0.02 units on average, and are within 0.2 unit of reported literature values (5). These small differences do not change the conclusion that log KHB has a small dependence on ΔpKa in water. However, use of the same set of buffers for the pKa determination of all compounds results in less scatter in the plots of log KHB (water) versus ΔpKa and log KHB (DMSO) versus log KHB (water), presumably because of an increase in the precision of the data.
Determination of pKaint and ΔpKa.
The “intrinsic” pKa (pKaint; see also Results) represents the pKa of the functional group (OH or COOH) expected from the polar and resonance effects of the substituents in the absence of H bonding (Scheme SIIB).
Scheme II.
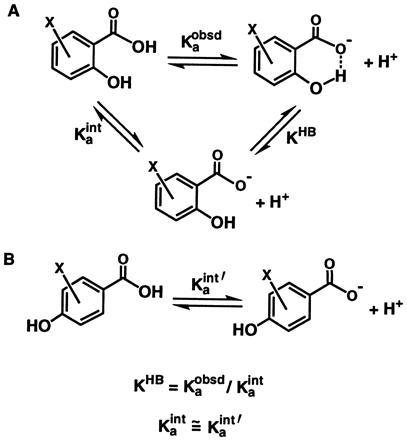
ΔpKa represents the difference in the intrinsic pKa values of the H bond donor and acceptor. Thus, the pKaint values of both the COOH and OH groups were determined to obtain the ΔpKa value for the H bond in each compound.
The pKaint value was estimated as the pKa of the functional group in a corresponding compound with the OH group para to the COOH instead of ortho, so that no intramolecular H bond can form (Scheme SIIB). For salicylic acid (SA), the intrinsic pKa of the COOH group [pKaΦCOOH,int(SA)] was estimated as the pKa value of 4-hydroxybenzoic acid [12.4 (6)]. For SAs with a substituent X at the 4- or 5-position (X-SA), the intrinsic pKa of the COOH group was calculated from: pKaΦCOOH,int (X-SA) = [pKaΦCOOH,int(SA) − σX∗ρΦCOOH], where σX is the Hammett constant describing the electron-withdrawing ability of the substituent X and ρΦCOOH is the slope of the linear dependence of pKa on the σ value of the substituent for benzoic acids. The intrinsic pKa of the OH group of SA was obtained from the relationship: pKaΦOH,int(SA) = pKaΦOH − σp-COOH∗ρΦOH, where σp-COOH is the Hammett constant of a p-COOH substituent and ρΦOH is the slope of the linear dependence of pKa on the σ value of the substituent for phenols. The intrinsic pKa of the OH group in substituted salicylates was calculated from: pKaΦOH,int(X-SA) = [pKaΦOH,int(SA) − σX∗ρΦOH]. The Hammett constants σm and σp were used for the ionization of COOH groups, since these constants are based on the pKa values of benzoic acids (7, 8). To account for the greater resonance contributions of substituents in the ionization of phenols than benzoic acids, the σ− scale was used for the pKa values of the OH groups (7, 8). The effect of a p-COOH substituent on the pKa of the phenol hydroxyl (i.e., σ−) cannot be obtained because the COOH group deprotonates before the OH group does; the σ− value of p-COOR was used instead to estimate the intrinsic effect of the p-COOH group. Any error introduced by this approximation is constant for the entire series of compounds and therefore does not affect the slopes of plots of log KHB versus ΔpKa or the conclusions derived herein (see also below). The ρ values used were 2.4 in DMSO and 1.0 in water for deprotonation of benzoic acids, and 5.3 in DMSO and 2.26 in water for deprotonation of phenols (4, 8).
The following suggest that the decrease of the pKa values of carboxylic acids in SAs arise from the H bonding interactions in their monoanions in both solvents, and that the determination of pKaint values described above are appropriate for the analysis herein. Ortho- and para-substituents generally have similar resonance and polar effects on the acidity of benzoic acids (7–9), so that the decreased pKa values for SAs relative to the corresponding para-compounds can be attributed to H bonding. In addition, comparison of the pKa values of benzoic acids with the same substituent at the 2- or 4-position suggests that ortho-specific effects from steric or electrostatic features of the OH and COOH groups are small, decreasing the pKa of benzoic acids by <1 pK unit in both solvents (see ref. 6 for a summary of the relevant pKa values in DMSO; the corresponding aqueous pKa values can be found in ref. 5). The similar pKa values for terephthalic acid and phthalic acid monomethyl ester, neither of which can form an intramolecular H bond in its anionic form, also suggest that the para-substituent constant provides a reasonable estimate for the intrinsic effect of an ortho-substituent (5, 10).
Determination of Brønsted Slopes for H Bonding.
Brønsted slopes for the H bond in SA monoanions were determined from linear least squares fit to plots of log KHB versus ΔpKawater. The slope is expected to provide information about properties of the H bond because a homologous series of compounds was used. Though a small systematic error in the estimated intrinsic effect of the ortho-OH or COOH group is possible, it is expected to be constant and not to affect the dependence of log KHB on ΔpKa (i.e., the slope). To avoid compounds that might show deviant behavior, additional substituents ortho to either the COOH or OH group were not used, nor were charged substituents included (7–9).
It should be noted that the Brønsted coefficient is typically defined as the slope of the linear dependence of log KHB on the pKa values of the donor or acceptor, while the other H bonding group remains constant (11–14). For the intramolecular H bond in SA monoanions, the pKa values of both the donor and acceptor are changed by the substituent as ΔpKa is varied. Some deviation from a simple linear correlation might therefore be anticipated. Such deviations are expected to be small, however, because the intrinsic pKa of the COOH group vary over a limited range and Brønsted slopes have small dependences on the pKa of the donor or acceptor (10–14).
NMR Spectroscopy.
All measurements were performed at 400 MHz, 15–20°C. Solutions of substituted SAs or their triethylammonium salts in DMSO-d6 (≈0.2 M) were used in chemical shift measurements. The isotope fractionation factor for the H-bonded proton in SA monoanion was measured by NMR spectroscopy as described (10, 15).
RESULTS
The equilibrium for formation of the intramolecular H bond between the hydroxyl proton and the carboxylate in a series of substituted salicylate monoanions was investigated as a function of ΔpKa, the difference in pKa between the H bond donor and acceptor.
Experimental Design.
The equilibrium for formation of the intramolecular H bond (KHB) was estimated according to Scheme SII. Stabilization of the salicylate monoanion by the H bond renders deprotonation of the carboxylic acid more favorable, thereby decreasing its pKa value (pKaobsd). The decrease of the observed pKa of the carboxylic acid relative to its intrinsic pKa value (pKaint) provides a measure of the strength of the H bond (Scheme SIIA, log KHB = pKaint − pKaobsd).‡ The intrinsic pKa of the carboxylic acid group refers to its pKa value expected in the absence of H bonding (Scheme SIIA, Kaint), which accounts for perturbation of the pKa of benzoic acid by the polar and resonance effects of the ortho-OH substituent (see Materials and Methods).
A substituent at the 4- or 5-position of SA provides a means of varying the relative pKa values of the donor and acceptor (ΔpKa). This is because deprotonation of the hydroxyl group has a steeper dependence on substituents than does the carboxylic acid group (ρ is ≈2.2-fold larger for ionization of phenols than benzoic acids, see Materials and Methods). In addition, the substituent has different substituent constants for ionization of the carboxylic acid and hydroxyl groups because it is para to one group and meta to the other (σp versus σm). This allows a ΔpKa range of 4.5 and 1.9 to be spanned in DMSO and water, respectively (Table 1).
Changes in H Bond Strength with Changes in ΔpKa in DMSO and Water.
The pKaobsd, pKaint, and log KHB values for each compound are summarized in Table 1. The free energy of H bonding (ΔGHB) changes from −6.6 to −9.0 kcal/mol as ΔpKa decreases from 4.9 to 0.1 in DMSO. For the same series of compounds, ΔGHB varies by only 0.2 kcal/mol, from −2.2 to −2.4 kcal/mol, with a change in ΔpKa of ≈2 units in water. Fig. 1 shows the dependence of log KHB on the ΔpKa values of the H bond. To allow a direct comparison of the magnitude of changes in H bond strength that accompanies a given change in the charge distribution of donor/acceptor, a common scale of ΔpKa in water was used for the H bond in both media.§ The Brønsted slope β, which describes the linear dependence of log KHB on ΔpKa, is 0.73 and 0.05 for the H bond in DMSO and water, respectively (Fig. 1)¶.
Figure 1.
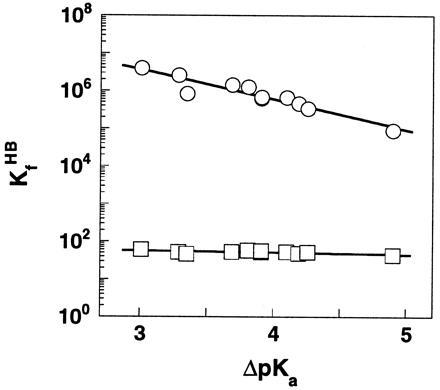
The dependence of log KHB upon ΔpKawater in DMSO (○) and H2O (□) for the H bond in substituted SA monoanions. The Brønsted slopes are 0.05 and 0.73 in water and DMSO, respectively. A common ΔpKa scale in water was used to allow a direct comparison of the magnitude of changes in H bond strength in the two solvents. Data are from Table 1.
The larger Brønsted slope in DMSO than in water indicates that there is a greater increase in H bond strength in a nonaqueous media than aqueous solution as the charge density on the donor/acceptor is increased. This is more clearly depicted in Fig. 2, in which the equilibrium of H bonding in DMSO and water were directly compared: KHB increases by two orders of magnitude in DMSO while it varies by <2-fold in water. The slope of log KHB in DMSO versus log KHB in water, which represents the different degree of strengthening of the H bond in the two media, is ≈15. Though the steep slope precludes a precise estimate of its absolute value, it is substantially greater than the slope of unity (Fig. 2, dashed line) that would be observed if H bond strength has the same dependence on ΔpKa in DMSO and water.
Figure 2.

A greater increase in H bond strength accompanying changes in the charge density of donor/acceptors in DMSO than in water. The logarithm of equilibrium constants for H bonding in DMSO are plotted against those in water for substituted salicylates (note the difference in scales). The solid line represents a least squares fit of the data and gives a slope of 15. The dashed line with a slope of unity, which represents the correlation expected if the strengthening of the H bond were the same in the two media, is shown for comparison. Data are from Table 1.
H Bonds Near Matched pKa.
The chemical shifts of the hydroxyl protons in SA monoanions are 4–5 ppm more downfield than those in the acid species, and fall in a range of ≈14-16 ppm (Table 2). In addition, the isotope fractionation factor for the hydroxyl proton in SA monoanion is 0.84 ± 0.03. These properties are consistent with general criteria suggested for “short, strong” or low-barrier H bonds (for simplicity, LBHB is used to refer to all classes of “special” H bonds; e.g., refs. 10 and 26–33). It has been suggested that these properties arise from the development of covalent character in H bonds between donor and acceptors with matched or similar pKa values, and that these H bonds may be especially strong due to additional stabilization from the covalent character (26–33).
Table 2.
Chemical shifts of the H-bonded proton in SA monoanions in DMSO
| Compound | ΔpKaDMSO* | δH (acid)† | δH (anion)† |
|---|---|---|---|
| 4-OMe-SA (3) | 0.9 | 11.5 | 15.6 |
| 5-Cl-SA (5) | 2.0 | 12.2 | 15.8 |
| SA (7) | 2.2 | 11.4 | 16.3 |
| 5-F-SA (8) | 2.7 | 11.6 | 15.2 |
| 5-Me-SA (9) | 2.9 | 11.3 | 14.9 |
| 5-OMe-SA (10) | 3.1 | 11.0 | 14.6 |
From Table 1.
Determined as described in Materials and Methods.
Unusual IR spectra, which may also reflect the covalent character of these H bonds, are observed in organic solvents for H bonds between groups with ΔpKaH2O < 1–2 units in organic solvents (e.g., refs. 34–36). However, the energetics of H bonds investigated to date provide no indication of a steeper increase in H bond strength in this ΔpKa region that might be expected from a special energetic contribution from covalent character. For example, the H bond in substituted salicylates investigated herein exhibits a linear dependence of log KHB on ΔpKa over a range of ΔpKaH2O values of 1.9, without any upward curvature near matched pKa in DMSO (Fig. 1; ΔpKaDMSO ranges from 0.1 to 4.5; Table 1). There is also no curvature in Brønsted slopes for H bonding between substituted phenols and phenolates in tetrahydrofuran (THF), over a ΔpKaH2O range from 0 to 3.1 units (10).
The following observation further suggests that the steep
dependence of H bond strength on ΔpKa persists even at
large values of ΔpKa, where covalent contributions to the
H bond are expected to be minimal. The energy of the H bond between the
CH2OH and COO− groups in
2-hydroxymethylbenzoic acid (12) was estimated to be 2.3
kcal/mol in DMSO by the procedure outlined in Scheme SII.
This compound exhibits a pKaobsd value of 9.6 in DMSO,
which is 1.7 units lower than the pKaint value of 11.3
estimated from p-hydroxymethylbenzoic acid. This H bond has
a ΔpKa of ≈10 in water [pKaint (COOH)
= 4.2 and pKaint (OH) ≈14 in water (5);
ΔpKa in DMSO is estimated to be >20 from the
ΔpKa value in water and the 2.4-fold larger ρ value for
ionizations in DMSO relative to water (2–4)]. Despite this large
ΔpKa, the H bond strength for 12 falls on the
linear Brønsted plot in Fig. 1 when this line is extended to
ΔpKa = 10 (there is a positive deviation in log
KHB of 0.2 from the extrapolated line). These results are
consistent with a continued linear decrease in H bond strength over a
wider ΔpKa range with no significant change in slope.
Though this compound is not homologous to the salicylates, we expect
the additional methylene group will have only a small effect on the H
bond strength.
DISCUSSION
The energetics of H bonds as a function of ΔpKa in nonaqueous and aqueous media provides a crude model for the changes in H bond strength accompanying charge rearrangements in the course of enzymatic and solution reactions, respectively. Results from this and previous studies suggest that the strengthening of the H bond is greater at a nonaqueous enzyme active site than in water; this could be used by enzymes to achieve a rate enhancement relative to the solution reaction.
Larger Increases of H Bond Strength in Nonaqueous Media: Implications for Enzymatic Catalysis.
In the course of a reaction, charge accumulation on a substrate functional group could lead to the strengthening of H bonds to this group. However, rate enhancement relative to the solution reaction requires that the strengthening of the H bond to enzymatic catalytic groups be greater than that to water. The steeper dependences of H bond strength on ΔpKa generally observed in organic solvents and the gas phase than in water suggested that this is possible (10, 11, 16–25, 36). However, we were aware of no direct comparison of these dependencies in nonaqueous and aqueous media.
We have compared the changes of H bond strength in DMSO and water for a series of substituted salicylate monoanions. There is a greater strengthening of the H bond with changes in the pKa values of donor/acceptors in DMSO than in water (Figs. 1 and 2). Analogously, a greater increase in H bond strength accompanying charge rearrangements at a nonaqueous active site than in water could contribute to rate enhancement by enzymes. This is illustrated in Fig. 3 for the example of the TIM reaction. The H bond to the substrate carbonyl oxygen from either the enzymatic histidine or water is strengthened as charge relocalizes in the course of the reaction. The strengthening of the H bond would be greater in the nonaqueous enzymatic interior than in water (ΔΔGE > ΔΔGsoln), provided that DMSO provides a reasonable, albeit crude, mimic of the active site environment (see below). The different degree of strengthening of the H bond provides rate enhancement for the enzymatic reaction relative to the solution reaction (ΔΔG≠ = ΔΔGE − ΔΔGsoln).
Figure 3.

Diagrammatic illustration of potential catalysis that can be obtained from a greater strengthening of H bonds accompanying charge rearrangements at a nonaqueous enzymatic active site than in water, using the example of the TIM reaction. The pKa of the substrate carbonyl oxygen increases during the course of reaction, so that ΔpKa between this oxygen atom and the enzymatic or solution H bond donor (His-E or HOH, respectively) decreases. This leads to an increase in H bond strength. This increase would be greater at the enzymatic active site (ΔΔGE) than in solution (ΔΔGsoln) because of the greater Brønsted slopes in nonaqueous environments. The amount of catalysis obtained from this strategy, relative to the solution reaction, is ΔΔG≠ = ΔΔGE − ΔΔGsoln.
If the linear dependences of H bond strength upon ΔpKa for the salicylates in water and DMSO [slopes of 0.05 and 0.73, respectively (Fig. 1)] were to hold for the solution and active site H bonds, respectively, the interaction shown in Fig. 3 would be expected to provide a rate enhancement of ≈106 fold for the enzymatic reaction [ΔpKawater ≈ 10; rate enhancement = 10 ΔpKa×Δβ = 1010×(0.73–0.05) = 6 × 10⁶; ΔΔG≠ ≈ 9 kcal/mol]. This very crude estimate does not take into account all the factors that contribute to the change in the strength of this H bond; nevertheless it suggests that substantial rate enhancements can be obtained from steep dependences of H bond strength upon ΔpKa at active sites and large changes in the pKa of the interacting groups.
These results support recent suggestions that H bond strength can undergo large changes in the course of an enzymatic reaction (e.g., 29–33). However, previous proposals emphasized the change in the nature of H bonds near matched pKa values to obtain a “special” resonance stabilization; the results presented here and elsewhere provide no indication of such a special energetic contribution (refs. 10, 16–25, and 34–36; see “H Bonds Near Matched pKa” in Results). The steep dependence of H bond strength appears to extend beyond the region near matched pKa values where there may be significant covalent bond character (Fig. 1; refs. 16–25). We therefore suggest that a large increase in H bond strength upon charge rearrangement can be achieved at enzyme active sites for H bonds that are predominantly electrostatic, and we discuss the results herein in terms of a simple electrostatic model for H bonding (see below).
It remains possible that a special energetic contribution from the covalent character of LBHBs may be observed in other systems. Even in the absence of a special contribution to the free energy of H bond formation, an LBHB might allow a greater precision of positioning within an active site because it is shorter and covalent in character. It is also conceivable that enzymes position functional groups closely in the ground state to create destabilization that is relieved in the transition state by the ability to form a short hydrogen bond (C. S. Cassidy, J. Lin, and P. A. Frey, personal communication).
Do Enzymes Exhibit Large Increases in H Bond Strength Upon Charge Rearrangement?
A recent investigation of the stability of a series of Staphylococcal nuclease mutants suggests that the enzymatic interior can provide an environment for large Brønsted slopes of H bonding (37). In these proteins, the acidity of a tyrosine hydroxyl group (Tyr-27) was varied by fluoro-substitutions on the aromatic ring (2-F,3-F, or 2,3,5,6-F4); this provides a protein model for the effects of charge rearrangment. As the tyrosine hydroxyl becomes more acidic, its H bond to Glu-10 becomes stronger, stabilizing the folded protein (Fig. 4A, KEHB); on the other hand, its H bond to water would also be strengthened, stabilizing the unfolded protein (Fig. 4A, KwaterHB). The observed stability of the protein (Fig. 4A, Kfoldingobsd) increases with increasing acidity of the tyrosine hydroxyl. This indicates that the strengthening of the H bond between the X-tyrOH·gluCOO− pair is greater than the strengthening of the H bond to water (Fig. 4B, Δlog Kfoldingobsd = Δlog KEHB − Δlog KwaterHB). The slope of the plot of log Kfoldingobsd versus the pKa of the tyrosine hydroxyl was 0.35–0.75 (37).‖ This suggests that the Brønsted slope is 0.35–0.75 larger for the X-tyrOH·gluCOO− H bond on the enzyme than for the X-tyrOH·water H bond in aqueous solutions (Fig. 4B).
Figure 4.
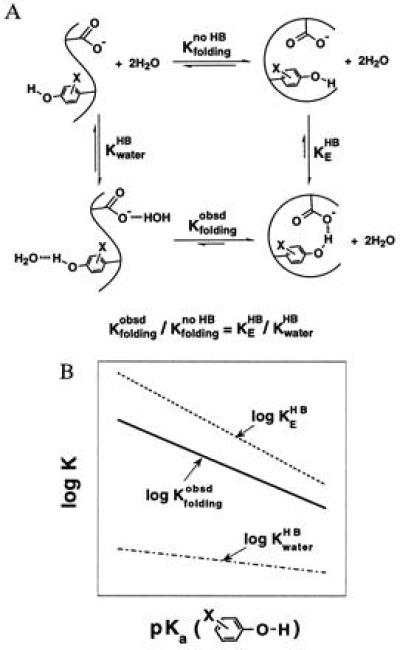
A large Brønsted slope for H bonding in proteins is inferred from folding studies of Staphylococcal nuclease mutants. (A) Thermodynamic analysis depicting the effect of changing the strength of the H bond donor, the substituted tyrosine hydroxyl, on the stability of the protein. The folding equilibrium of a hypothetical non-H-bonded species (Kfoldingno HB) is used to dissect the effects from H bonding. (B) Schematic depiction of the dependences of H bonding and folding equilibria on the pKa value of substituted tyrosines. As the tyrosine hydroxyl becomes more acidic, the strengthening of its H bond to the enzymatic glutamate and to water stabilizes the folded and unfolded protein, respectively. The slope of the plot of log Kfoldingobsd versus pKa is the difference between the slopes of plots of log KEHB versus pKa and KwaterHB versus pKa. This follows from the thermodynamic relationship shown in A, which gives Δlog Kfoldingobsd = Δlog KEHB − Δlog KwaterHB (i.e., the greater strengthening of the H bond on the protein results in a change in the observed stability of the protein. Note that Δlog Kfoldingno HB = 0 by definition because the folding equilibrium between the non-H-bonded species does not depend on the strength of the H bond donor.
Origins of the Larger Brønsted Slopes of H Bonding in Nonaqueous Environments.
The energetics of most H bonds can be described by a simple electrostatic model (Eqs. 1 and 2), in which H bond energy (EH) is dominated by the Coulombic interaction
 |
1 |
 |
2 |
between the partial effective charges on the donor and acceptor (q1 and q2, respectively), with an interaction coefficient that depends on the effective dielectric of the media (ɛeff) and the distance separating the partial charges (r). This model, though crude, provides a useful conceptual tool for considering factors that contribute to the greater sensitivity of H bond strength to charge rearrangements in nonaqueous media and enzymatic interior relative to water.
The enzyme active site can be considered as an environment of low effective dielectric (38–40). Such an environment would increase the change in H bond strength accompanying a charge redistribution [Eq. 2, (ΔEH/Δq1) ∝ (1/ɛeff)]. The effective dielectric is used as a simplified parameter to describe the ability of the environment to stabilize isolated charges and dipoles: the better this stabilization is accomplished, the less the energetic consequences of charge development. The effective dielectric is distinct from the bulk dielectric constant; it can account for the impact of the molecular properties of the local environment on interactions between adjacent groups, such as H bonds (41–45).
What are the molecular properties that contribute to the lower effective dielectric of nonaqueous solvents and enzymatic active sites relative to water? Water is a highly polar molecule that can effectively stabilize developing charges on a solute, thereby attenuating the observed increase in H bond strength between solutes. In addition, the ability of water molecules to rearrange further decreases the energetic difference between stronger and weaker solute/solute interactions. In contrast, the enzymatic interior is replete with hydrophobic residues, and the rigidity of the active site limits rearrangement of polar groups and bound water that are present. Similarly, DMSO is not capable of providing effective solvation to negative charges such as those in salicylates because it contains no effective H bond donor (see ref. 6). The larger size of DMSO also limits its ability to rearrange in the first solvation layer in response to charge redistribution. DMSO may therefore provide a crude mimic for the environment in an enzymatic interior, despite its high bulk dielectric constant. In general, larger Brønsted slopes for H bonds are observed in nonaqueous solutions than in water (10, 11, 16–25, 36).
The ability of enzyme active sites to provide functional groups that are stronger H bond donor/acceptors than water can also contribute to catalysis (46). Larger Brønsted slopes of H bonding for stronger donors or acceptors have been observed in previous model studies (12–14). This is consistent with expectations from the electrostatic model of H bonding, in which the change in H bond strength accompanying a change in the partial charge of the donor, for instance, is predicted to increase with increasing partial charges on the acceptor [Eq. 2, (ΔEH/Δq1) ∝ q2] (12–14, 46). This factor is not present in this model study, but may contribute in part to the larger Brønsted slope observed with Staphylococcal nuclease (see above).
What Provides the Driving Force for H Bond Formation in Nonaqueous Media?
The equilibria for formation of the H bond in SA monoanions are 104-fold more favorable in DMSO than in water (Fig. 1). This does not imply, however, that the H-bonded species are more stable in nonaqueous media than in aqueous solutions. As the equilibrium for H bond formation depends on the relative stability of the bonded and non-bonded species, the more favorable H bonding in nonaqueous media may rather reflect the high instability of isolated charges and dipoles in these environments relative to water, which is lessened by H bond formation. Binding interactions of an enzyme may be used to pay for the energetic penalty of desolvating the H bonding groups and fixing them in the low dielectric active site (47, 48), thereby allowing the enzyme to maximally discriminate between the different charge distributions of the ground state and transition state. The H bond donor and acceptor in the SA monoanions are fixed with respect to each other by covalent interactions, so that this system provides a model for the energetic effects of H bonding between groups that are already positioned at the enzyme active site by binding interactions.
Binding interactions can also be used to impose ground state interactions between the enzyme and the substrate that are unfavorable compared with their interactions with water (refs. 47–49 and references therein). This provides an additional way to maximize the difference between the ground state and transition state interactions, and thus the catalytic contribution of H bonds.
Positioning of substrates with respect to one another and with respect to catalytic active site residues, a catalytic mechanism that often utilizes H bonding, can lower the entropic barrier for reaction (47, 48). The concept of increasing the sensitivity of H bond strength to charge rearrangement at an enzymatic active site is conceptually distinct from catalysis via such induced intramolecularity. Nevertheless, the catalytic contributions from these mechanisms may be inextricably linked in that both mechanisms are effected through the rigidity and precise pre-organization of the active site, the energetic driving force for which is provided by folding of the protein and binding interactions of the substrate with the folded enzyme. That is, folding of the enzyme and its binding interactions with the substrate are responsible both for fixing the substrate in a low dielectric environment that maximizes the increase in H bond strength in the course of a reaction and for positioning reactants with respect to pre-aligned enzymatic catalytic groups that reduces the entropic barrier of a reaction (e.g., refs. 47, 48 and references therein).
Acknowledgments
We thank J. Brauman, W. Cleland, M. Kreevoy, and A. Williams for discussions; the Bordwell group for technical help; and P. Frey for permission to cite unpublished work. This work was supported by grants from the Lucille P. Markey Charitable Trust and the Chicago Community Trust to D.H. D.H. is a Lucille P. Markey Scholar and a Searle Scholar.
Footnotes
Abbreviations: DMSO, dimethyl sulfoxide; TIM, triosephosphate isomerase; SA, salicylic acid; LBHB, low-barrier H bonds.
H bonding between the COOH and OH groups may also be present in the neutral acids. This would increase the observed pKa values of the carboxylic acids, leading to underestimate of the strength of the H bond in the monoanion. This effect is expected to be small, however, because the H bonds involving neutral species in the acid form are generally much weaker than those involving charged species in the anionic form (10–14, 16–25).
The steeper dependence of log KHB upon ΔpKawater in DMSO can be broken down into two components. (i) The pKa scale in DMSO is expanded: for ionization of phenols and benzoic acids, a change in ΔpKa of 1 in water corresponds to a change in ΔpKa of ≈2.4 in DMSO (Table 1 and refs. 2–4). (ii) A steeper dependence of H bond strength on the proton affinity of the donor and acceptor: a plot of log KHB versus ΔpKaDMSO for the H bond in salicylates yields a Brønsted slope of 0.30 (not shown), whereas the slope is 0.05 for the corresponding H bonds in water (Fig. 1).
 |
3 |
The observed stability of the proteins at pH 7.0 as a function of the aqueous pKa of substituted tyrosines gives a Brønsted slope of 0.35 (37). The actual Brønsted slope for the H bond is likely to be larger because tetrafluorotyrosine is predominantly deprotonated in solution at pH 7.0 [pKa ≈ 5.3 (37)]. The folded protein with the deprotonated tetrafluorotyrosine is expected to be less stable than those with the protonated form because of electrostatic repulsion between the anionic glutamate and hydroxylate of tetrafluorotyrosine. This presumably leads to an underestimate of the stability of the protein with the neutral tetrafluorotyrosine. Correcting for the fraction of deprotonated species at pH 7.0, assuming that all of the folded proteins contain the protonated tetrafluorotyrosine, yields a Brønsted slope of 0.75. This provides an estimate for the upper limit of the Brønsted slope.
References
- 1.Kresge A J. Pure Appl Chem. 1991;63:213–221. [Google Scholar]
- 2.Bordwell F G. Acc Chem Res. 1988;21:456–463. [Google Scholar]
- 3.Bordwell F G, Branca J C, Hughes D L, Olmstead W N. J Org Chem. 1980;45:3305–3313. [Google Scholar]
- 4.Bordwell F G, McCallum R J, Olmstead W N. J Org Chem. 1984;49:1424–1427. [Google Scholar]
- 5.Kortum G, Vogel W, Andrussow K. Dissociation Constants of Organic Acids in Aqueous Solution. London: Butterworths; 1961. pp. 352–464. [Google Scholar]
- 6.Shan S, Herschlag D. J Am Chem Soc. 1996;118:5515–5518. [Google Scholar]
- 7.Exner O. Correlation Analysis of Chemical Data. New York: Plenum; 1988. pp. 439–540. [Google Scholar]
- 8.Wells P R. Linear Free Energy Relationships. New York: Academic; 1968. pp. 12–13. [Google Scholar]
- 9.Taft R W., Jr . Steric Effects in Organic Chemistry. New York: Wiley; 1956. pp. 426–442. [Google Scholar]
- 10.Shan S, Loh S, Herschlag D. Science. 1996;272:97–101. doi: 10.1126/science.272.5258.97. [DOI] [PubMed] [Google Scholar]
- 11.Jencks W P. Catalysis in Chemistry and Enzymology. 2nd Ed. New York: Dover; 1987. pp. 323–350. [Google Scholar]
- 12.Hine J. Physical Organic Chemistry. 2nd Ed. New York: McGraw–Hill; 1972. pp. 81–103. [Google Scholar]
- 13.Hine J. J Am Chem Soc. 1972;94:5766–5771. [Google Scholar]
- 14.Stahl N, Jencks W P. J Am Chem Soc. 1986;108:4196–4205. [Google Scholar]
- 15.Saunders M, Saunders S, Johnson S. J Am Chem Soc. 1984;106:3098–3110. [Google Scholar]
- 16.Pawlak Z, Zundel G, Fritsch J. Z Naturforsch A. 1984;29:391–395. [Google Scholar]
- 17.Albrecht G, Zundel G. Z Naturforsch A. 1984;39:986–992. [Google Scholar]
- 18.Albrecht G, Zundel G. J Chem Soc Faraday Trans 1. 1983;80:553–561. [Google Scholar]
- 19.Kaserde O, Zeegers-Huyskens Th. J Phys Chem. 1984;85:2636–2642. [Google Scholar]
- 20.Wilcox C S, Kim E, Romano D, Kuo L H, Bart A L, Curran D P. Tetrahedron. 1995;51:621–634. [Google Scholar]
- 21.Mock W L, Chua D C Y. J Chem Soc Perkin Trans. 1995;2:2069–2074. [Google Scholar]
- 22.Kely-Rowley A M, Lynch V M, Ansly E V. J Am Chem Soc. 1995;117:3438–3447. [Google Scholar]
- 23.Larson J W, McMahon T B. J Am Chem Soc. 1983;103:2944–2950. [Google Scholar]
- 24.Mihalick, J. E., Gatev, G. G. & Brauman, J. (1996) J. Am. Chem. Soc. 118, in press.
- 25.Meot-ner M, Sieck L W. J Phys Chem. 1986;90:6687–6690. [Google Scholar]
- 26.Hibbert F, Emsley J. Adv Phys Org Chem. 1990;26:255–379. [Google Scholar]
- 27.Perrin C L. Science. 1994;264:1665–1668. doi: 10.1126/science.266.5191.1665. [DOI] [PubMed] [Google Scholar]
- 28.Cleland W W. Biochemistry. 1992;31:317–319. doi: 10.1021/bi00117a001. [DOI] [PubMed] [Google Scholar]
- 29.Cleland W W, Kreevoy M M. Science. 1994;264:1887–1890. doi: 10.1126/science.8009219. [DOI] [PubMed] [Google Scholar]
- 30.Gerlt J A, Gassman P G. Biochemistry. 1993;32:11943–11952. doi: 10.1021/bi00096a001. [DOI] [PubMed] [Google Scholar]
- 31.Gerlt J A, Gassman P G. J Am Chem Soc. 1993;115:11552–11568. [Google Scholar]
- 32.Tobin J, Whitt S, Cassidy C, Frey P. Biochemistry. 1995;34:6919–6924. doi: 10.1021/bi00021a002. [DOI] [PubMed] [Google Scholar]
- 33.Frey P, Whitt S, Tobin J. Science. 1994;264:1927–1930. doi: 10.1126/science.7661899. [DOI] [PubMed] [Google Scholar]
- 34.Bohner U, Zundel G. J Phys Chem. 1986;90:964–973. [Google Scholar]
- 35.Johnson S L, Rumon K A. J Phys Chem. 1965;69:74–86. [Google Scholar]
- 36.Brzezinski B, Zundel G. J Phys Chem. 1983;87:5461–5464. [Google Scholar]
- 37.Thorson J S, Chapman E, Murphy E C, Schultz P G. J Am Chem Soc. 1995;117:1157–1158. [Google Scholar]
- 38.Sharp K A, Honig B. Annu Rev Biophys Biophys Chem. 1990;19:301–332. doi: 10.1146/annurev.bb.19.060190.001505. [DOI] [PubMed] [Google Scholar]
- 39.Honig B, Nicholls A. Science. 1995;268:1144–1149. doi: 10.1126/science.7761829. [DOI] [PubMed] [Google Scholar]
- 40.King G, Lee F S, Warshel A. Chem Phys. 1991;95:4366–4377. [Google Scholar]
- 41.Beeson C, Pham N, Shipps G, Jr, Dix T A. J Am Chem Soc. 1993;115:6803–6812. [Google Scholar]
- 42.Beeson C, Dix T A. J Am Chem Soc. 1993;115:10275–10282. [Google Scholar]
- 43.Abraham M H, Grellier P L, Abboud J-L M, Doherty R M, Taft R W. Can J Chem. 1988;66:2673–2686. [Google Scholar]
- 44.Reichardt C. Mol Interact. 1982;3:241–285. [Google Scholar]
- 45.Swain C G, Swain M S, Powell A L, Alunni S. J Am Chem Soc. 1983;105:502–513. [Google Scholar]
- 46.Herschlag D, Eckstein F, Cech T R. Biochemistry. 1993;32:8312–8321. doi: 10.1021/bi00083a035. [DOI] [PubMed] [Google Scholar]
- 47.Jencks W P. Adv Enzymol Relat Areas Mol Biol. 1975;43:219–410. doi: 10.1002/9780470122884.ch4. [DOI] [PubMed] [Google Scholar]
- 48.Page M I, Jencks W P. Proc Natl Acad Sci USA. 1971;68:1678–1683. doi: 10.1073/pnas.68.8.1678. [DOI] [PMC free article] [PubMed] [Google Scholar]
- 49.Narlikar G J, Gopalakrishnan V, McConnell T S, Usman N, Herschlag D. Proc Natl Acad Sci USA. 1995;92:3668–3672. doi: 10.1073/pnas.92.9.3668. [DOI] [PMC free article] [PubMed] [Google Scholar]