

The pathophysiology underlying the nephrotic syndrome is becoming clear for several inherited podocytopathies; the mechanisms of injury that lead to the acquired forms of this disease are not well understood. We explored these mechanisms using the mouse model of adriamycin-induced proteinuria. We estimated the fractional clearances for FITC-Ficolls, albumin, and neutral albumin in cooled, isolated, perfused kidneys (cIPK) in situ. Treatment with adriamycin led to a significant increase in the fractional clearance of albumin and of Ficoll with radii larger than 20 Å. Neutral albumin (33.4 Å) and similarly sized Ficoll behaved similarly to each other. In addition, adriamycin led to a significant loss of charge density and size selectivity of the glomerular barrier. The thickness of the glomerular endothelial surface layer (i.e., or the glycocalyx) in adriamycin-treated animals was only 20% of that in normal animals. Finally, several proteoglycans were downregulated in isolated glomeruli. In summary, adriamycin thins the glomerular glycocalyx, perhaps by downregulating proteoglycan synthesis, and alters glomerular charge- and size selectivity. These data suggest that the glomerular endothelium may play a role in the pathogenesis of proteinuric renal diseases.
Nephrotic syndromes are important and dramatic clinical conditions in which the underlying mechanisms are poorly understood and the treatment is unspecific and often ineffective.1 The evidence for a highly size- and charge-selective glomerular barrier is overwhelming,2 but there are alternative views3 as is elaborated in a recent review.1 The glomerular barrier consists of a fenestrated endothelium covered with a surface layer, the glomerular basement membrane (GBM), and podocyte foot processes.1 Recent advances concerning podocyte biology4,5 have revealed the molecular mechanism behind several genetic disorders,6 but less is known about the acquired diseases.7 Studies on laminin-deficient mice suggest that the changes in the GBM may precede those in the podocyte.8 Furthermore, the glomerular endothelial surface layer (ESL) may offer significant restriction to macromolecules.9,10,7,11–13 Thus, proteinuria is likely to occur after damage to any one of the components of the glomerular barrier.1
The study presented here was undertaken to further explore the intricate mechanisms underlying nephrotic syndrome. As an experimental model, we chose adriamycin, which induces proteinuria in mice.14–16 The glomerular damage was estimated using functional, morphologic, and molecular techniques. In vivo studies of proteinuria in patients or animals have the major disadvantage that proteins can be reabsorbed, secreted, or degraded in the tubules. Consequently, the protein concentration in final urine may differ considerably from that of primary urine. To overcome these limitations, one may use the inert polysaccharides dextran or Ficoll as markers instead of albumin. A few years ago, we published the first analysis of glomerular size and charge selectivity in mice using albumin and Ficoll.13 In the study presented here, we extend this analysis using charge-modified neutral albumin as well. Electron microscopy was used to measure the thickness of the glomerular ESL.11 Moreover, gene and protein expressions of several proteoglycans and glycosaminoglycan (GAG) synthesis enzymes were analyzed with techniques established in the lab.10,12,17
RESULTS
Mice with the high dose of adriamycin (AD mice, 25 mg/kg) had a significant weight-loss from day 3 and onward whereas there was no difference between controls and low-dose adriamycin mice (ADL mice, 10 mg/kg) (Figure 1). The albumin/creatinine ratio measured in vivo at day 6 from spot urine was significantly increased from 0.10 (SEM + 0.022, −0.018) in controls to 0.67 (+0.272, −0.194) in AD mice (P < 0.001). There was no significant increase for ADL mice, 0.16 (+0.030, −0.025).
Figure 1.

Mean ± SEM for the body weight for controls (black, n = 10), ADL (white, n = 9), and AD (gray, n = 9). Statistical analysis was made by comparing the body weights each day with the body weight at day 0. * P < 0.05, ** P < 0.01, *** P < 0.001.
Functional Properties of the Glomerular Barrier
The fractional clearances for all Ficoll sizes, 12 to 70 Å, are shown in Figure 2. There was a significantly increased fractional clearance of Ficoll in AD mice compared with controls and ADL mice, at least for Stokes-Einstein radii (aSE) exceeding 20 Å (P < 0.01, Figure 2). Because there was no difference between controls and ADL mice, further analyses were done for controls and AD mice only. The GFRs were similar for controls and AD mice as shown in Table 2.
Figure 2.

Mean ± SEM for the fractional clearance of Ficolls (12 to 70Å) in controls and AD mice. There is a significant difference (P < 0.01) between controls (n = 10) and AD (n = 9) for all Ficolls. Note the logarithmic scale: only every 10th value is shown for clarity.
Table 2.
GFRs and fractional clearance ratiosa
| Data from cIPK | Control | AD |
|---|---|---|
| GFR (ml/min/100 bw) | 0.034 (+0.007, −0.006) | 0.033 (+0.015, −0.101) |
| Clearance ratio | 5.2 | 11.8 |
| HSA/Ficoll 35.5 Å (%) | (+0.9, −0.8) | (+2.3, −2.2)** |
| Clearance ratio | 4.1 | 18.4 |
| HSA/nHSA (%) | (+0.8, −0.6) | (+6.7, −4.9)*** |
P < 0.01,
P < 0.001. bw, body weight.
The fractional clearance for albumin (HSA) was significantly increased from 0.0042 (+0.0008, −0.0007) in controls to 0.0150 (+0.0047, −0.0036) in the AD group (P < 0.01, Figure 3). Neutral Ficoll of similar size as albumin (aSE 35.5 Å) had a fractional clearance of 0.089 (±0.0042) in controls and was significantly increased to 0.107 (±0.010) in AD mice (P < 0.01, Figure 3). Neutral HSA (nHSA, aSE 33.4 Å) had a fractional clearance of 0.11 (±0.007) and 0.10 (+0.011, −0.010) for controls and AD mice, respectively (Figure 3).
Figure 3.

Mean ± SEM for the fractional clearance for HSA, nHSA, and Ficolls in controls (n = 10) and AD (n = 9) mice. Note the logarithmic scale. * P < 0.05, ** P < 0.01.
The ratio between HSA and Ficoll 35.5 Å was found to be significantly increased from 5.2% (+0.9, −0.8) in controls to 11.8% (+2.3, −2.2) in AD mice (P < 0.01). When comparing HSA with nHSA the results were similar: an increase from 4.1% (+0.8, −0.6) in controls to 18.4% (+6.7, −4.9) in AD mice (P < 0.001, Table 2). The ratio between nHSA and neutral Ficoll of similar size (aSE 33.4 Å, see Materials and Methods) was found to be 107% (+6.1, −5.8) in control animals; that is, there was no difference in clearance between protein and Ficoll polymer of similar charge and size.
According to the gel membrane model, several parameters were altered in the AD mice. The most pronounced change was the significantly decreased charge density in the glomerular barrier from 46.9 (+2.9, −2.7) mEq/L in controls to 26.5 (+5.4, −4.4) mEq/L (P < 0.01) in AD mice. There were also significant changes in size selectivity; both the pore radii and the number of large pores were increased (P < 0.05, Table 3). These changes of the functional properties of the glomerular barrier were accompanied by a significant decrease in ESL thickness from 126 nm (+39, −30) in controls to 27 nm (+13, −9) in AD mice (20% of control, P < 0.001, Figure 4). Electron micrographs also showed podocyte foot-process flattening in more than 70% of glomeruli in AD mice (Figure 5).
Table 3.
Summary of the results from the gel-membrane modela
| Data from cIPK | Control | AD | AD/Control (%) |
|---|---|---|---|
| Charge density (mEq/L) | 46.9 (+2.9, −2.7) | 26.5 (+5.4, −4.4)** | 69 |
| Small pore radius (Å) | 46.5 (±0.35) | 47.8 (±0.32)* | 103 |
| Large pore radius (Å) | 106 (+4.2, −4.1) | 122 (+6.4, −6.1)* | 116 |
| Large pore LpS (%) | 1.00 (+0.24, −0.20) | 2.10 (+0.57, −0.45)* | 210 |
| Area parameter, A0/Δx | 4496 (+1076, −869) | 5209 (+2465, −1673) | 116 |
P < 0.05,
P < 0.01.
Figure 4.

Mean ± SEM for the ESL in controls (four animals, n = 88 glomeruli) and AD mice (three animals, n = 79 glomeruli). *** P < 0.001.
Figure 5.

Electron micrographs of glomerular capillaries showing Intralipid droplets and the podocyte foot-process flattening in AD mice.
Expression of mRNA and Proteins
Real-time PCR revealed a significant regulation in isolated glomeruli of several genes in AD mice compared with controls, Figure 6. The mRNA expression of the chondroitin sulfate proteoglycan versican was found to be significantly upregulated in AD mice (P < 0.001, Figure 6). Western blot for versican showed a loss of protein (Figure 7, see Discussion). In addition, a receptor for hyaluronan, RHAMM, and hyaluronidase was significantly downregulated in AD mice (P < 0.01 and P < 0.001, Figure 6). Furthermore, heparan sulfate proteoglycans were also altered. There were significant downregulations of glypican-1 and glypican-4 (P > 0.001), but not of perlecan, agrin, syndecan-1, and syndecan-4 (Figure 6 and 8). In addition, the EXT-1 and HS2ST1 enzymes, which are important for the elongation and sulfation of heparan sulfate chains, were found to be downregulated (P < 0.001). As for the small leucine-rich proteoglycans, decorin was upregulated in AD (P < 0.05), fibromodulin was downregulated (P < 0.05), and no change was found for biglycan. The expression of podocin was downregulated in AD (P < 0.01), whereas nephrin was unchanged (Figure 9).
Figure 6.

Mean ± SEM for mRNA expression relative to housekeeping genes and controls (1) for RHAMM (hyaluronic acid motility receptor), hyaluronidase (Hyal), versican, perlecan, agrin, matrix metallopeptidase 9 (MMP-9), and protein kinase C δ (PKCδ) in AD mice. Note the logarithmic scale. n = 7 for controls and AD mice. * P < 0.05, ** P < 0.01 *** P < 0.001.
Figure 7.
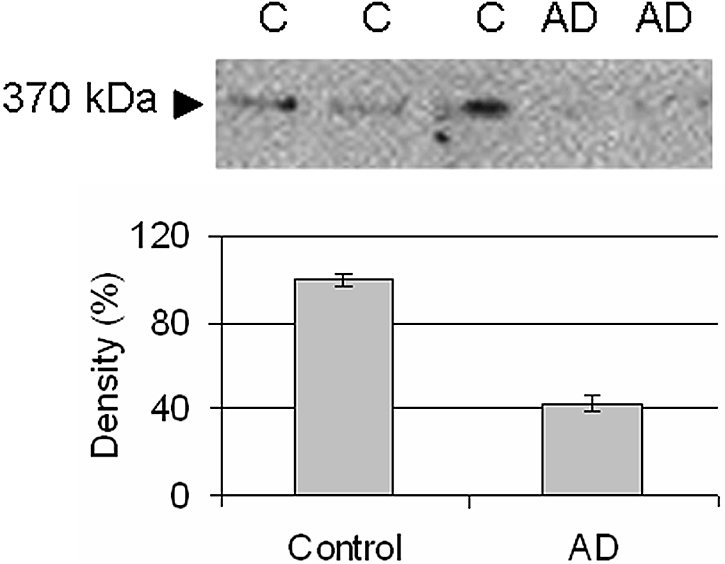
Western blot for versican (370 kD).
Figure 8.

Mean ± SEM for mRNA expression relative to housekeeping genes and controls (1) for the heparan sulfate proteoglycans glypican-1, glypican-4, syndecan-1, syndecan-4, nephrin, and podocin. Note the logarithmic scale. n = 7 for controls and AD mice. *** P < 0.001.
Figure 9.

Mean ± SEM for mRNA expression relative to housekeeping genes and controls (1) for the small leucine rich proteoglycans biglycan, decorin, and fibromodulin. Also shown are enzymes important for the elongation and sulfation of side chains (GAGs) on heparan sulfate proteoglycans EXT-1, HS2ST1, and NDST3. See Table 1 for abbreviations. Note the logarithmic scale. n = 7 for both controls and AD mice. * P < 0.05, ** P < 0.01, *** P < 0.001.
DISCUSSION
In mice made proteinuric with adriamycin, we found the glomerular ESL thickness to be only 20% of that in normal animals. This alteration seems to have been caused by downregulation of the glomerular synthesis of certain proteoglycans and enzymes required for the production of GAGs. Consequently, the glomerular charge selectivity was diminished, causing albuminuria and flattening of the podocyte foot processes. There was also an effect on glomerular size selectivity as shown by the Ficoll sieving curves in Figure 2. Furthermore, the study gives important insights into the normal glomerular barrier, which demonstrate marked size- and charge selectivity in support of the classical concept.7 The so-called “albumin retrieval hypothesis”1,3 can therefore (once again) be rejected.1,2 Also, the study shows that proteins such as albumin behave as Ficoll polymers of similar size and charge.
The ESL is an intricate structure to study because its highly hydrated morphology is altered by the tracers used for its visualization.11 The ESL includes glycocalyx components attached to the endothelial cell membrane (e.g., glypican and syndecan) together with secreted proteoglycans, GAGs, hyaluronan, and certain plasma proteins that are bound to the glycocalyx mainly by charge-charge interactions. Intravital microscopy with a fluorescence tracer has been used in several organs to identify and measure an “exclusion zone,”18 but the technique is less suitable for the kidney. We have developed a technique for the glomeruli using electron microscopy and Intralipid droplets (see Figure 5) that reflects alterations of the ESL thickness; for example, in response to enzyme treatment.11 In the study presented here, we found that adriamycin-treatment drastically reduced the thickness of ESL from 126 to 27 nm; that is, to 20% of normal (see Figure 4), a finding that coincides with the development of proteinuria.
Adriamycin is known to cause proteinuria in rats19–21 and BALB/c mice.16 In the latter study, 10 mg/kg of adriamycin was found to produce marked proteinuria within 1 wk, which was maintained over a period of 6 wk. However, the mice lost one-third of their body weight within 1 wk and then gradually gained weight again.16 In this study, BALB/c mice could not be used because of unforeseen, not previously reported, vasoconstriction in response to artificial perfusion. We therefore studied C57BL/6 mice, which are more commonly used in experimental work, but could not find any signs of renal damage at a dose of 10 mg/kg of adriamycin. Indeed, most investigators consider C57BL/6 to be resistant to the proteinuric effect of adriamycin, but the reason for this difference between strains is not known. Our mice were found to be sensitive to higher doses; hence, dose-response experiments were done.16 We decided to use 25 mg/kg adriamycin together with twice daily intraperitoneal injections of glucose-electrolyte solution, which induced proteinuria in the mice, but not as severe weight losses as seen in other studies using BALB at lower doses.16,22 Similar doses (26 mg/kg) have previously been reported to be required in BALB/c mice (2 × 13 mg/kg) to achieve stable proteinuria.15
Bertolatus et al.19,20 studied the proteinuric effect of adriamycin in rats using a tissue uptake technique that more recently has been reintroduced by one of the coauthors (O.T.).23,24 In rats, adriamycin reduced charge selectivity as revealed by anionic an neutral IgG19 and native and neutral bovine albumin,20 with no detectable effect on the size barrier. Also, in our study the effect on size selectivity was minimal for aSE below 40 Å, but became evident for larger Ficolls, reflecting an increased number of large pores (see Figure 2). In that figure, the effect of a low dose (10 mg/kg) of adriamycin is also shown, and the Ficoll sieving curve is close to that of the control mice. Despite differences in experimental technique, the results obtained using tissue uptake in intact rats20 are remarkably close to the data obtained in the study presented here from cooled, isolated, perfused kidneys (cIPKs), albeit that the absolute values are higher using the latter approach. Indeed, the tissue uptake technique is likely to underestimate the “true” clearance values, whereas trauma is likely to slightly increase the clearance for the cIPK model.
There are surprisingly few studies of glomerular sieving of neutral albumin, most likely because of the instability of the modified protein. Thus, the charged-modified albumin will slowly regain anionic net charge, making it necessary to characterize the protein in plasma and in urine. Moreover, charged-modified proteins may alter their molecular size, which also has to be monitored and reported. In the study presented here, we have made serious efforts to characterize the tracers in all of these respects. Thus, the charge-modified HSA gave rise to bands close to the isoelectric point of 7.4; that is, neutral, with an aSE of 33.4 Å (i.e., 2 Å less than native albumin). Comparing the nHSA with a Ficoll of similar size gave a fractional clearance ratio of 1.07 for the control mice. These findings are in agreement with studies on isolated GBMs,25 nanopore membranes26 [for solute-over-pore radius (λ) 0.0 to 0.7, but not for λ > 0.8], and other globular proteins,27 but in contrast to recent reports by Rippe et al. 23,28 Moreover, the clearance ratio of native over nHSA of 4% in the study presented here (Table 2) is close to the value of 2% reported by Bertolatus,20 but less than the value of 10% reported by Lund et al.23 These differences may be reconciled by differences in the biochemical properties of the modified protein. We therefore conclude that neutral globular proteins and Ficolls have similar behavior in their passage across the glomerular barrier.
The diminished thickness of the ESL and the changes in functional properties was coupled to several changes in glomerular gene expression. The downregulation of the heparan sulfate proteoglycans glypican-1 and glypican-4 together with the downregulation of EXT-1 and HS2ST show that in addition to the loss of core protein, there is less elongation (EXT-1) and sulfation (HS2ST) of heparan sulfate chains. To our knowledge, there is no previous report of downregulation of glypican in proteinuria. Furthermore, our lab has shown a downregulation of the chondroitin sulfate proteoglycan versican in several models of renal disease. Nonobese diabetic mice showed a downregulation of versican,12 as did puromycin-induced nephrotic syndrome in rats and puromycin in cultured glomerular endothelial cells and podocytes.10,17 To our surprise, adriamycin-induced proteinuria showed an increase of versican mRNA in the glomerulus. However, when performing Western blotting it was evident that despite the increase in mRNA there was a loss of versican protein compared with controls. The real-time PCR detects versican isoform V0 and V1, whereas the antibody detects isoforms V0, V1, V2, and V3. Because we only detected a 370-kD band in our Western blotting, this suggests that only versican V0 is present in adult mice glomeruli. We speculate that the difference between versican mRNA and protein in AD mice can be due to loss of binding partners in the ESL. Thus, versican is produced and secreted into the ESL, but because of its size (approximately 1000 kD with GAG chains) and binding partners, versican has a slow turnover and a long diffusion distance to the plasma. However, in AD mice the glycocalyx thickness is decreased to approximately 20% of that in control mice, and there are less binding partners for versican. Therefore, there may be an increased loss of protein, for which the cell compensates by increasing the translation of versican (Figure 10). It is known that versican binds to hyaluronan, CD44, type I collagen, fibronectin, P- and L-selectin, integrin β1, and EGF receptor.29 In this study, we found that RHAMM (hyaluronan receptor) and hyaluronidase (hyaluronan degradation) were downregulated. Although we have not measured hyaluronan, this could indicate a loss of hyaluronan. It is also possible that versican binds to other proteoglycans such as glypican; however, that still needs to be investigated. In addition, it should be noted that glomerular cells other than the endothelium produce proteoglycans and their synthesis may be affected as well in AD. The unaltered expression of two major components of the GBM, perlecan and agrin, suggests that the GBM is unlikely to be involved in adriamycin-induced proteinuria. However, electron microscopy revealed morphologic changes of the podocyte foot processes, which may be a direct effect of adriamycin, a secondary phenomenon of proteinuria, or both.
Figure 10.

Speculative diagram of the versican mRNA and protein expression. In the normal endothelial cell, versican (in black) is produced and secreted into the ESL. Because of its size (approximately 1000 kD with GAG chains) and binding partners, versican has a slow turnover and a long diffusion distance to the plasma. However, in AD mice the glycocalyx thickness is decreased to approximately 20% of that in control mice and there is a loss of potential binding partners for versican. The consequence of this will be an increased loss of protein, for which the cell tries to compensate by increasing the translation of versican.
In summary, adriamycin was found to reduce glomerular cell synthesis of certain proteoglycans and GAGs, causing a diminution of the glomerular ESL. In addition, glomerular charge selectivity was markedly reduced and the restriction of larger solutes impaired, causing proteinuria. Adriamycin did not seem to affect the GBM, but there was flattening of the podocyte foot processes. We conclude that adriamycin-induced proteinuria may involve dysfunction of the glomerular endothelial cells.
CONCISE METHODS
Experiments were performed in female C57BL/6 mice (B&K Universal Limited Grimston, Aldbrough, England). Mice were kept on standard chow and had free access to water. The local ethics review committee approved the experiments. Adriamycin (adriamycin hydrochloride, Sigma-Aldrich, Sweden) or saline (controls) was injected in a tail vein in isoflurane-anesthetized animals at day 0. Initially, we intended to use BALB/c mice, in which 10 mg/kg of adriamycin induces massive proteinuria. However, the BALB/c mice responded to isolated perfusion of the kidneys with a massive vasoconstriction and anuria. Therefore, C57BL/6 mice were used, but in these animals, the dose of 10 mg/kg (ADL) did not induce renal damage. Several doses were tested (3 × 10, 20, 25, and 30 mg/kg), before the dose of 25 mg/kg (AD) was chosen. On day 1 to 5, the mice were given 2 daily intraperitoneal injections of 2 ml of a glucose-electrolyte solution to prevent weight loss due to low appetite. The nutrient solution (peritoneal dialysis fluid) had the following composition: 85 mM glucose, 41 mM lactate, 133 mM Na+, 1.79 mM Ca2+, 0.26 mM Mg2+, 96.2 mM Cl− (Gambrosol Trio, Gambro AB, Lund, Sweden). The body weight was measured daily. At day 6, spot-urine was collected and the glomerular barrier evaluated using the cIPK model. After the cIPK model, glomeruli were isolated for analysis of mRNA and protein expression. Furthermore, mice were also used at day 6 for estimation with electron microscopy including calculations of endothelial glycocalyx thickness based on the distribution of Intralipid droplets.
cIPKs at 8°C
Anesthesia was induced and continued by inhalation of isoflurane (2 to 3% vol/vol, Isoflurane, Baxter Medical AB, Kista, Sweden). The mouse was eviscerated and the intestines removed. A cannula (PE-25) was put in the bladder for collection of urine. The aorta and caval vein were clamped distal to the renal arteries and the aorta was cannulated in a retrograde direction with a T-tube (PE-25), connected to a pressure transducer. The clamp was removed, allowing perfusion of the kidneys by means of a pulsatile pump (Ismatec IPC, Zurich, Switzerland) at approximately 100 mmHg. The aorta was then ligated proximal to the renal arteries and the caval vein was opened for venous outflow distal to the renal arteries. Cutting the heart ventricles open killed the animal. After a short period of equilibration, urine samples were collected and weighed. Great care was taken not to touch the kidneys and to provide adequate perfusion with either blood or perfusate during the preparation procedure. The temperature of the perfusate was kept at 8°C to inhibit tubular function as well as energy consumption. Perfusion pressure and urine weight changes were monitored by computer using AcqKnowledge v 3.7.3 (Biopac Systems Inc., Goleta, California) computer software.
Perfusate was prepared using a modified Tyrode solution with the addition of 125I-nHSA, HSA (18 g/L; Baxter Medical AB, Kista, Sweden), 51Cr-EDTA and FITC-labeled Ficoll in the size range 12 to 70 Å. The solution had the following composition: 113 mmol/L NaCl, 4.3 mmol/L KCl, 2.5 mmol/L CaCl2, 0.8 mmol/L MgCl2, 25.5 mmol/L NaHCO3, 0.5 mmol/L NaH2PO4, 5.6 mmol/L glucose, 0.9 mmol/L nitroprusside (Merck, Darmstadt, Germany), 10 mg/L furosemide, 200 mg/L FITC-labeled Ficoll (TdB Consultancy AB, Uppsala, Sweden), 0.16 MBq/L 51Cr-EDTA (Amersham Pharmacia Biotech, Buckinghamshire, United Kingdom). The perfusate (pH 7.4) was protected from light and gassed with 5% CO2 in O2.
Neutralization of HSA (nHSA)
The nHSA was obtained by a graded modification of the carboxyl groups using a procedure modified from that described by Hoare and Koshland as follows.30 HSA (1.5 g) was dissolved in 15 ml of 0.133 M glycine methyl ester (pH 4.75) at room temperature. A solution of 5 ml of 0.04 M N-ethyl-N′-(3-dimethylaminopropyl) carbodiimide hydrochloride was then added to the mixture to initiate the reaction. The pH was kept at 4.75 by addition of 0.1 M NaOH. Aliquots (1 ml) were removed every 5 min for 60 min and immediately added to 1 ml of 4.0 M acetate buffer at pH 4.75 to quench the reaction. The aliquots were dialyzed overnight against twochanges of 10 L of distilled water. The dialysate was freeze-dried and stored at −20°C. The effect of the reaction was evaluated by isoelectric focusing using a vertical system and Novex precast gels (Novel Experimental Technology, San Diego, California). Albumin with an average isoelectric point close to 7.4 was obtained by a reaction time of 45 min. For the experiments, freeze-dried nHSA was dissolved in PBS and labeled with 125I using Iodogen (Pierce, Rockford, Illinois) according to the manufactures instructions. The labeling of nHSA was done as close to the experiments as possible and any dissolved and/or labeled nHSA not used within a week was discarded. The hydrodynamic radius of labeled nHSA was measured in pooled and concentrated (10×) perfusate samples after the experiments using a Superose 12 HR 10/30 column connected to a Gamma-C 250-μl flow cell (Radiomatic 610TR Perkin Elmer, Waltham, Massachusetts). A 0.1-M phosphate buffer (pH 7.0) with addition of 0.1 M Na2SO4 was used as eluent, and BSA, ovalbumin, chymotrypsinogen, and ribonuclease were used as molecular weight standards. Neutralized and radiolabeled albumin showed a slightly smaller aSE (33.4 Å) than its anionic control (35.5 Å) obtained from the Institute for Energy Technology, Kjeller, Norway.
Data Analysis
Perfusate and urine samples from cIPK experiments were analyzed for 51Cr-EDTA and 125I-nHSA in a γ-counter (Cobra, AutoGamma Counting systems, Packard Instrument Company, Meriden, Connecticut) and corrected for background and spillover. The concentration of HSA was determined with ELISA (Bethyl Laboratories Inc., Montgomery, Texas). GFR was calculated from the urine over perfusate concentration ratios (CU/CP) for 51Cr-EDTA times urine flow (QU). Fractional clearance for a solute is given by its urine-over-plasma concentration corrected for the residual tubular reabsorption (approximately 1.15) using 51Cr-EDTA or the smallest Ficolls. Two mice from the AD group showed no signs of renal disease (fractional clearance for albumin was lower than mean value in controls) and were excluded.
The fractional clearance for different radii of FITC-Ficoll was calculated by subjecting perfusate and urine samples to gel filtration (TSK-gel G4000PWXL, Tosoh Bioscience, Stuttgart, Germany) and detection of fluorescence (Dionex fluorimeter RF-2000 Dionex Softron, Gynkotek, Germering, Germany) using Chromeleon (Gynkotek, Germering, Germany) software. A 0.05-mol/L phosphate buffer with 0.15 mol/L NaCl (pH 7.0) was used as eluent. A volume of 5 μl from each sample was analyzed at an excitation wavelength of 492 nm and an emission wavelength of 560 nm. The flow rate (0.3 ml/min) and the sampling frequency (1/sec) were maintained constant during the analysis and so were pressure (approximately 2 MPa) and temperature (8°C).
Spot-urine albumin was determined using ELISA for mouse albumin (Bethyl Laboratories Inc., Montgomery, Texas) according to the manufactures instructions. All of urine samples were corrected for the urine-creatinine concentration measured with a creatinine assay (Sigma Diagnostics, Sigma-Aldrich Company Ltd., Dorset, United Kingdom).
ESL Thickness
Intralipid droplets (Fresenius Kabi, Sweden) were used as indirect markers of the thickness of the ESL, as described before.11 Briefly, the Intralipid solution was prepared by discarding the top lipid layer of the solution after a night at 4°C. An enriched floating fraction of lipid droplets was obtained after centrifugation at 3000 g for 10 min, and 100 μl was administrated in the jugular vein at day 6 of controls or AD animals (30 mg/kg). After the lipids were allowed to mix in the circulation for 10 min, the left renal artery and vein was clamped and the kidney was fixed by subcapsular injection of Karnovsky's fixative (2.5% paraformaldehyde and 2% glutaraldehyde in 0.05 M sodium -cacadylate buffer, pH 7.2). Sections were examined in a Leo 912AB Omega electron microscope (Leo Electron Microscopy, Cambridge, United Kingdom). Micrographs of glomerular capillaries at a magnification of 8000 were obtained from four controls and three AD mice giving a total of 167 glomerular capillaries for measurements. For each micrograph, the distance between the lipid droplet and the endothelial cell membrane surface was measured up to 500 nm from the endothelium using EsiVision Pro (Soft Imagine System, Münster, Germany). In total, the distance for approximately 500 droplets was measured.
Real-Time PCR and Western Blotting
RNA was prepared from sieved isolated glomeruli after the cIPK using the Qiagen mini kit (Roche Diagnostics, Bromma, Sweden). The concentration and quality of the RNA was evaluated by the Agilent 2100 bioanalyzer (Nano LabChip, Agilent Technologies, Waldbronn, Germany). After synthesis of cDNA the expression of each target gene (Table 1) was quantified by real-time PCR on the ABI Prism 7900 sequence detection system (Taqman, Applied Biosystems Inc., Foster City, California) using the low-density array. The low-density array detects 24 genes in one run in duplicates including endogenous controls (18S and β-actin) and was designed including primers and probes for the genes summarized in Table 1. All samples were averaged from the corrections with the two endogenous controls 18S and β-actin. The comparative ΔΔCT method of relative quantification was used to calculate for differences in gene expression using the software for ABI Prism 7900 Sequence Detection system (Taqman, Applied Biosystems Inc., Foster City, California). Agrin was quantified separately using an assay from Applied Biosystems and corrected against β-actin after calculating the concentrations using a standard curve.
Table 1.
Target genes analyzed by real-time PCRa
| Protein | Accession No. | Protein Description |
|---|---|---|
| 18S | Endogenous control | |
| Beta-actin | NM_007393 | Endogenous control |
| Biglycan | NM_007542 | CS/DS, SLRP, secreted |
| Decorin | NM_007833 | CS/DS, SLRP, secreted |
| Fibromodulin | NM_021355 | KS, SLRP, secreted |
| Versican | D28599 | CSPG, secreted |
| Perlecan | M77174 | HS/CSPG, secreted |
| Glypican-1 | NM_016696 | HSPG, GPI-anchored |
| Glypican-4 | NM_008150 | HSPG, GPI-anchored |
| Syndecan-1 | NM_011519 | HSPG, membrane bound |
| Syndecan-4 | NM_011521 | HSPG, membrane bound |
| Nephrin | NM_019459 | Podocyte slit |
| Podocin | NM_130456 | Podocyte slit |
| PKCδ | NM_011103 | Protein kinase C |
| MMP-9 | NM_013599 | Matrix metalloprotease-9 |
| EXT-1 | NM_010162.2 | Exostoses 1 |
| HS2ST1 | NM_010489.2 | Heparan sulphate 2-O-sulfotransferase 1 |
| NDST3 | NM_031186.2 | N-deacetylase/N-sulfotransferase 3 |
| RHMMR | NM_013552.1 | Hyaluronan mediated motility receptor |
| Hyaluronidase | NM_010489.2 | Hyaluronoglucosaminidase 2 |
| Agrin | NM_021604.2 | HSPG, secreted |
CS, chondroitin sulfate; DS, dermatan sulfate; SLRP, small leucine-rich proteoglycan; KS, keratin sulfate; HS, heparan sulfate; PG, proteoglycan; GPI, glycosyl phosphatidylinositol.
Western blotting for versican was done using protein lysates from isolated glomeruli pretreated with 0.4 U chondroitinase ABC (Sigma-Aldrich, Stockholm, Sweden) in ABC-buffer (100 mM Tris-HAc, 10 mM EDTA, 3 mM CaCl2, pH 7.3) for 14 h at 37°C to remove glycosaminoglycan chains. Protein lysates were separated on NuPAGE 3 to 8% Tris-acetate gels (Novex) and transferred to nitrocellulose membrane. Membranes were blocked and immunological detection was done using a goat anti-versican antibody (Santa Cruz Biotechnology, Santa Cruz, CA). Anti-rabbit IgG (Amersham Life Science, Amersham, United Kingdom) was used to visualize immunoreactive bands with enhanced chemiluminiscence (ECL plus, Amersham Biosciences, Uppsala, Sweden) in a CCD camera (LAS1000, Fujifilm, Tokyo, Japan).
The Gel-Membrane Model
The properties of the glomerular barrier were described using the gel-membrane model.13,27 According to the gel-membrane model, the glomerular barrier is composed of two separate compartments in series: one charge selective (gel) and one size selective (membrane). The gel is in contact with plasma and contains fixed negative charges, reducing the concentration of anionic solutes, such as albumin. The second compartment of the barrier behaves as membrane exerting size discrimination but no charge selectivity. The calculation of charge selectivity was done by comparing the fractional clearance of HSA with that of its neutral counterparts nHSA and Ficoll, 35.5 Å, giving an estimation of the charge density. Size-selective properties are described using a two-pore model with experimental fractional clearance data for Ficolls (12 to 70 Å). The exchange can be described using the following parameters: the small pore radius, the large pore radius, the large pore fraction of the glomerular filtrate (large pore hydraulic conductance), and the area parameter, A0/Δx.27
Statistics
Results are presented as mean ± SEM. Variables were tested for uneven distribution (skewness > 2 SD) and unequal variance. Logarithmic values were used for variables with uneven distribution; that is, GFR, fractional clearances, albumin/creatinine ratio, surface layer thickness, modeled data, and mRNA expressions. Statistical comparisons were made to controls using t test. A P value less than 0.05 was considered statistically significant.
DISCLOSURES
None.
Acknowledgments
We gratefully acknowledge Ann Nehlmark Lundgren for technical assistance. The Swedish Medical Research Council 9898, the Knut and Alice Wallenberg Research Foundation, the IngaBritt and Arne Lundbergs Research Foundation, the National Association for Kidney Diseases, The Swedish Diabetes Association Research Foundation, the John and Brit Wennerströms Research Foundation, and a Sahlgrenska University Hospital Grant supported this study.
Published online ahead of print. Publication date available at www.jasn.org.
REFERENCES
- 1.Haraldsson B, Nyström J, Deen WM: Properties of the glomerular barrier and mechanisms of proteinuria. Physiol Rev 88: 451–487, 2008 [DOI] [PubMed] [Google Scholar]
- 2.Comper WD, Haraldsson B, Deen WM: Resolved: Normal glomeruli filter nephrotic levels of albumin. J Am Soc Nephrol 19: 427–432, 2008 [DOI] [PubMed] [Google Scholar]
- 3.Russo LM, Sandoval RM, McKee M, Osicka TM, Collins AB, Brown D, Molitoris BA, Comper WD: The normal kidney filters nephrotic levels of albumin retrieved by proximal tubule cells: Retrieval is disrupted in nephrotic states. Kidney Int, 71: 504–513, 2007 [DOI] [PubMed] [Google Scholar]
- 4.Roselli S, Gribouval O, Boute N, Sich M, Benessy F, Attie T, Gubler MC, Antignac C: Podocin localizes in the kidney to the slit diaphragm area. Am J Pathol 160: 131–139, 2002 [DOI] [PMC free article] [PubMed] [Google Scholar]
- 5.Ruotsalainen V, Ljungberg P, Wartiovaara J, Lenkkeri U, Kestilä, M, Jalanko H, Holmberg C, Tryggvason, K: Nephrin is specifically located at the slit diaphragm of glomerular podocytes. Proc Natl Acad Sci U S A 96: 7962–7967, 1999 [DOI] [PMC free article] [PubMed] [Google Scholar]
- 6.Tryggvason K, Patrakka J, Wartiovaara J: Hereditary proteinuria syndromes and mechanisms of proteinuria. N Engl J Med 354: 1387–1401, 2006 [DOI] [PubMed] [Google Scholar]
- 7.Deen WM: Cellular contributions to glomerular size-selectivity. Kidney Int 69: 1295–1297, 2006 [DOI] [PubMed] [Google Scholar]
- 8.Jarad G, Cunningham J, Shaw AS, Miner JH: Proteinuria precedes podocyte abnormalities inLamb2-/- mice, implicating the glomerular basement membrane as an albumin barrier. J Clin Invest 116: 2272–2279, 2006 [DOI] [PMC free article] [PubMed] [Google Scholar]
- 9.Avasthi PS, Koshy V: Pathophysiology and clinical relevance of proteinuria: Glomerular endothelial glycocalyx. Contrib Nephrol 68: 104–113, 1988 [DOI] [PubMed] [Google Scholar]
- 10.Björnson A, Moses J, Ingemansson A, Haraldsson B, Sörensson J: Primary human glomerular endothelial cells produce proteoglycans, and puromycin affects their posttranslational modification. Am J Physiol Renal Physiol 288: F748–F756, 2005 [DOI] [PubMed] [Google Scholar]
- 11.Hjalmarsson C, Johansson BR, Haraldsson B: Electron microscopic evaluation of the endothelial surface layer of glomerular capillaries. Microvasc Res 67: 9–17, 2004 [DOI] [PubMed] [Google Scholar]
- 12.Jeansson M, Granqvist AB, Nyström JS, Haraldsson B: Functional and molecular alterations of the glomerular barrier in long-term diabetes in mice. Diabetologia, 49: 2200–2209, 2006 [DOI] [PubMed] [Google Scholar]
- 13.Jeansson M, Haraldsson B: Glomerular size and charge selectivity in the mouse after exposure to glucosaminoglycan-degrading enzymes. J Am Soc Nephrol 14: 1756–1765, 2003 [DOI] [PubMed] [Google Scholar]
- 14.Guo J, Ananthakrishnan R, Qu W, Lu Y, Reiniger N, Zeng S, Ma W, Rosario R, Yan SF, Ramasamy R, D’Agati V, Schmidt, AM: RAGE mediates podocyte injury in adriamycin-induced glomerulosclerosis. J Am Soc Nephrol 19: 961–972, 2008 [DOI] [PMC free article] [PubMed] [Google Scholar]
- 15.Vielhauer V, Berning E, Eis V, Kretzler M, Segerer S, Strutz F, Horuk R, Grone HJ, Schlondorff D, Anders HJ: CCR1 blockade reduces interstitial inflammation and fibrosis in mice with glomerulosclerosis and nephrotic syndrome. Kidney Int 66: 2264–2278, 2004 [DOI] [PubMed] [Google Scholar]
- 16.Wang Y, Wang YP, Tay YC, Harris DC: Progressive adriamycin nephropathy in mice: Sequence of histologic and immunohistochemical events. Kidney Int 58: 1797–1804, 2000 [DOI] [PubMed] [Google Scholar]
- 17.Björnson Granqvist A, Ebefors K, Saleem MA, Mathieson PW, Haraldsson B, Sörensson Nyström J: Podocyte proteoglycan synthesis is involved in the development of nephrotic syndrome. Am J Physiol Renal Physiol 291: F722–F730, 2006 [DOI] [PubMed] [Google Scholar]
- 18.Vink H, Duling BR: Identification of distinct luminal domains for macromolecules, erythrocytes, and leukocytes within mammalian capillaries. Circ Res 79: 581–589, 1996 [DOI] [PubMed] [Google Scholar]
- 19.Bertolatus JA, Abuyousef M, Hunsicker LG: Glomerular sieving of high molecular weight proteins in proteinuric rats. Kidney Int 31: 1257–1266, 1987 [DOI] [PubMed] [Google Scholar]
- 20.Bertolatus JA, Hunsicker LG: Glomerular sieving of anionic and neutral bovine albumins in proteinuric rats. Kidney Int 28: 467–476, 1985 [DOI] [PubMed] [Google Scholar]
- 21.Kramer A, van den Hoven M, Rops A, Wijnhoven T, van den Heuvel L, Lensen J, van Kuppevelt T, van Goor H, van der Vlag J, Navis G, Berden JH: Induction of glomerular heparanase expression in rats with adriamycin nephropathy is regulated by reactive oxygen species and the renin-angiotensin system. J Am Soc Nephrol 17: 2513–2520, 2006 [DOI] [PubMed] [Google Scholar]
- 22.Kairaitis L, Wang Y, Zheng L, Tay YC, Harris DC: Blockade of CD40-CD40 ligand protects against renal injury in chronic proteinuric renal disease. Kidney Int 64: 1265–1272, 2003 [DOI] [PubMed] [Google Scholar]
- 23.Lund U, Rippe A, Venturoli D, Tenstad O, Grubb A, Rippe B: Glomerular filtration rate dependence of sieving of albumin and some neutral proteins in rat kidneys. Am J Physiol Renal Physiol 284: F1226–F1234, 2003 [DOI] [PubMed] [Google Scholar]
- 24.Tenstad O, Williamson HE, Clausen G, Oien AH, Aukland K: Glomerular filtration and tubular absorption of the basic polypeptide aprotinin. Acta Physiol Scand 152: 33–50, 1994 [DOI] [PubMed] [Google Scholar]
- 25.Bolton GR, Deen WM, Daniels BS: Assessment of the charge selectivity of glomerular basement membrane using Ficoll sulfate. Am J Physiol, 274: F889–F896, 1998 [DOI] [PubMed] [Google Scholar]
- 26.Fissell WH, Manley S, Dubnisheva A, Glass J, Magistrelli J, Eldridge AN, Fleischman AJ, Zydney AL, Roy S: Ficoll is not a rigid sphere. Am J Physiol Renal Physiol 293: F1209–F1213, 2007 [DOI] [PubMed] [Google Scholar]
- 27.Sörensson J, Ohlson M, Haraldsson B: A quantitative analysis of the glomerular charge barrier in the rat. Am J Physiol Renal Physiol 280: F646–F656, 2001 [DOI] [PubMed] [Google Scholar]
- 28.Venturoli D, Rippe B: Ficoll and dextran vs. globular proteins as probes for testing glomerular permselectivity: Effects of molecular size, shape, charge, and deformability. Am J Physiol Renal Physiol 288: F605–F613, 2005 [DOI] [PubMed] [Google Scholar]
- 29.Rahmani M, Wong BW, Ang L, Cheung CC, Carthy JM, Walinski H, McManus BM: Versican: Signaling to transcriptional control pathways. Can J Physiol Pharmacol 84: 77–92, 2006 [DOI] [PubMed] [Google Scholar]
- 30.Hoare DG, Koshland, DE Jr: A method for the quantitative modification and estimation of carboxylic acid groups in proteins. J Biol Chem 242: 2447–2453, 1967 [PubMed] [Google Scholar]