

Abstract
Thalamic firing synchrony is thought to ensure selective transmission of relevant sensory information to the recipient cortical neurons by rendering them more responsive to temporally correlated input spikes. However, direct evidence for a synchrony code in the thalamus is limited. Here, we directly measure thalamic firing synchrony and its stimulus-induced modulation over time, using simultaneous single unit recordings from individual thalamic barreloids in the rat somatosensory whisker/barrel system. Employing whisker deflections varying in velocity or frequency and a cross-correlation approach, we find systematic changes in both time course and strength of thalamic firing synchrony as a function of stimulus parameters and sensory adaptation. Synchrony develops faster and is greater with higher velocity deflections. Greater firing synchrony reflects stimulus-dependent increases in instantaneous firing rates, greater spike time precision relative to stimulus onset as well as common input that likely arises from divergent trigeminothalamic and corticothalamic neurons. With adaptation, synchrony decreases and takes longer to develop but is more dependent on the cells' common inputs. Rapid, sharp increases in thalamic synchrony mirroring quick increases in whisker velocity occur also during ongoing random, high-frequency whisker vibrations. Together, results demonstrate millisecond by millisecond changes in thalamic near-synchronous firing during complex patterns of ongoing vibrissa movements that may ensure transmission of preferred sensory information in local thalamocortical circuits during whisking and active touch.
Keywords: thalamocortical, firing synchrony, somatosensory, barreloid, barrel cortex, whiskers
Introduction
Rodents are capable of fine tactile discrimination tasks that require detection and processing of rapid whisker movements occurring in close succession (Carvell and Simons, 1990). Thalamic barreloid neurons respond typically with 0–3 spikes per stimulus to single or periodic whisker deflections, with a mean of <2 spikes/stimulus (Simons and Carvell, 1989; Hartings and Simons, 1998). This sparse firing indicates that a neuronal code based on single cell response magnitudes or interspike intervals is unlikely to be used. Rather, the data suggest the existence of a population code wherein groups of neurons fire only one or a few spikes but in close temporal relationship to one another.
Using a population code based on firing synchrony, brief, sparse thalamic responses would be well suited for encoding rapid changes in whisker movement. In support of this view, cells in layer IV of visual and somatosensory cortex are thought to respond preferentially to near-synchronous firing of their thalamic input neurons (Alonso et al., 1996; Usrey et al., 2000; Roy and Alloway, 2001; Bruno and Sakmann, 2006). For example, two spikes from different thalamic neurons are more likely to evoke a cortical spike if they occur within <8 ms from each other (Usrey et al., 2000; Roy and Alloway, 2001). Two spikes traveling down the same thalamic axon have stronger excitatory effects if they arrive within 15 ms of each other. The time courses of these heterosynaptic and homosynaptic interactions suggest that sharp firing synchrony among thalamic neurons, along with increases in their instantaneous firing rates, are critically important for encoding peripheral sensory information.
In the whisker/barrel somatosensory system, single-unit recordings performed one-at-a-time in cortical barrels and thalamic barreloids have indicated that whisker stimuli, such as high-velocity deflections, that evoke larger initial responses among populations of thalamic neurons also evoke larger responses in barrel neurons (Pinto et al., 2000). The magnitude and time course of thalamic local field potentials, likely an indirect reflection of synchronous activity among groups of neighboring thalamic neurons, vary systematically with deflection acceleration/velocity as well as with the deflection location (receptive field center) and angular direction (Temereanca and Simons, 2003).
Here we investigate firing synchrony among thalamic neurons directly, by simultaneously recording through a multielectrode array the activity of pairs of single thalamocortical units located in the same electrophysiologically identified barreloid. Using periodic and random whisker deflections varying in velocity or frequency, we made novel use of a cross-correlation approach to examine how thalamic firing synchrony varies with time-varying whisker stimuli and sensory adaptation. In particular, we assess stimulus-dependent changes in response precision, firing rates and the contribution of common input to stimulus-driven thalamic firing synchrony. Results provide a first report of systematic changes in both onset time and strength of thalamic synchrony as a function of stimulus velocity and frequency. Rapid changes in synchrony occur also during random whisker vibrations and sensory adaptation, both of which decrease overall synchrony, demonstrating that time-varying thalamic synchrony can encode complex patterns of vibrissa deflections and thus presumably natural stimuli during active touch.
Materials and Methods
Surgical procedures
Data are reported from seven adult female albino rats (Sprague Dawley strain; Hilltop Lab Animals) prepared for electrophysiological recordings using surgical procedures described in detail previously (Simons and Carvell, 1989; Temereanca and Simons, 2003). Under halothane anesthesia, the skull was exposed and a small craniotomy, including removal of dura, was made in the right hemisphere overlying the ventral posteromedial (VPm) nucleus. After surgery halothane was discontinued, and the animal was immobilized using pancuronium bromide (∼1.6 mg · kg−1 · h−1), artificially respired through a tracheal cannula, and kept warm by means of a servo-controlled heating blanket. A steel post, fixed to the skull with dental acrylic, was used to hold the rat's head without pressure points and without obstructing whiskers on the left face. The rat was subsequently maintained in a lightly narcotized state by continuous infusion of fentanyl (Sublimaze, Janssen Pharmaceuticals; ∼10 μg · kg−1 · h−1). Neuromuscular blockade was used to prevent spontaneous whisker movements that would prevent use of our electromechanical stimulators. The condition of the animal was assessed using a computer program that continuously monitored EEG, femoral arterial blood pressure, heart rate, respiration rate and tracheal airway pressure, all of which remained within normal physiological ranges throughout the experiments. At the termination of the recording session the rat was deeply anesthetized with pentobarbital sodium (Nembutal 100 mg/kg, i.v.) and perfused transcardially. The brain tissue was subsequently sectioned in the coronal plane (60 μm sections) and processed for cytochrome oxidase (CO) histochemistry with Nissl counterstain. Sections were examined to confirm the location of electrode tracks in VPm.
Multiple single-unit recordings
Multiple extracellular single-unit recordings were made with quartz-insulated, platinum/tungsten (90%/10%) microelectrodes (Uwe; Thomas Recording). The electrodes were pulled and ground in our laboratory. In preliminary experiments we found that quartz electrodes made from 60 μm diameter stock and having impedances of 6–12 MΩ yielded well isolated, large-amplitude thalamic spikes. Two such electrodes were advanced into the brain independently using a Thomas Recording Eckhorn microdrive system. A customized LABView data acquisition program was used to record, from each channel, the analog signal of spike waveforms sampled at 32 kHz together with spike time stamps, stimulus codes and trial numbers. Spike waveforms were parsed on-line using an amplitude threshold and saved on disk for detailed off-line analysis based on waveform shape and interspike interval (MClust version 2.0; A. David Redish, University of Minnesota, Minneapolis, MN).
Pairs of single thalamocortical (TC) units were recorded simultaneously via the two electrodes placed in the same electrophysiologically identified barreloid as follows. The electrodes were positioned 80–120 μm apart on the cortical surface, and then each of them was advanced independently into VPm thalamus. During electrode advancement through VPm hand-held glass probes were used to identify the whisker that evoked the most robust response from an isolated unit. This whisker was designated the principal whisker (PW). Recordings were obtained in which both microelectrodes sampled well isolated single units having the same PW, indicating that both microelectrodes were located in the same whisker-related barreloid. Most VPm neurons have multi-whisker receptive fields. In cases where the PW was not clearly distinguishable from other effective whiskers using manual stimuli, the suspected PW as well as adjacent whiskers that evoked strong responses were deflected using an electromechanical stimulator attached separately to each whisker (see below). Response magnitudes to different whiskers were quantified online to determine the neuron's PW.
Vibrissa stimulation and experimental design
Controlled deflections of the PW were produced using stimulators constructed from piezoelectric “bimorphs.” One stimulator was used to deflect the PW in eight different directions using 200 ms long ramp-and-hold stimulus waveforms having onset and offset velocities of ∼125 mm/s (Simons, 1983); such stimuli, delivered 10 times in each direction, were used to deflect different whiskers for determining the PW and for assessing a cell's directional preference. This stimulator was also used to produce relatively low velocity, periodic whisker deflections. The other stimulator was used to deflect whiskers using noise/ramp hybrid stimuli of low amplitude (<500 μm) but having high frequency components. Both types of stimulators were designed to produce deflections with virtually no mechanical ringing within the chosen velocity/acceleration ranges (Simons, 1983); the actual movements of the stimulators were verified using a photodiode based circuit. Stimuli were presented in blocks of trials, and individual stimuli within a block were presented in pseudorandom order at 1.5 s intervals.
Periodic whisker deflections.
We used periodic stimuli to produce sensory adaptation known to induce changes in thalamic response magnitudes and spike timing. A piezoelectric stimulator, identical to that used previously (Pinto et al., 2000), was used to deflect the PW in a single direction (caudal) using periodic waveforms that differed in velocity or frequency; caudal deflections were used so that all units were studied with the same stimulus and to compare data with previous findings from our laboratory investigating deflection velocity and thalamic population firing (Pinto et al., 2000; Temereanca and Simons, 2003). One set of periodic stimuli consisted of movements of three different velocities (80, 50, and 16 mm/s) delivered at repetition rates of eight per second (see Fig. 1). Each deflection was ∼1 mm in amplitude and began from the whisker's neutral position as the trough (phase of 3 π/2) of a single sine wave, ending smoothly at the same neutral position. The 80 mm/s stimulus was generated by taking one 40 Hz sine wave and delivering it every 125 ms (8 Hz) for 2 s; the average onset velocity of 80 mm/s was calculated as the deflection amplitude (1.0 mm) divided by the time from neutral to peak deflection (12.5 ms). The other two stimuli were generated similarly, by taking one cycle of a 25 Hz sine wave (50 mm/s) and one cycle of an 8 Hz sine wave (16 mm/s). The neurons' common PW was deflected pseudorandomly using the three stimuli, and pseudorandomized blocks were delivered 50 times, with interstimulus intervals of 1.5 s.
Figure 1.

Thalamic responses and firing synchrony to periodic whisker deflections of different velocities. A, Thalamic population PSTHs in response to caudal periodic sine waves of different velocities but identical amplitude (1 mm) and frequency (8 Hz). Population PSTHs are based on 40 cells (20 pairs). Each cycle begins at the resting or neutral position of the whisker. Bin widths = 1 ms. Same scales are used for all panels. B, Population CTHs showing responses to the first and last stimulus cycles. CTHs begin at the time of onset of each deflection in the train. Higher velocity deflections evoke greater initial population firing rates and shorter population response latencies for both first and last stimulus cycles. Response adaptation, which is more pronounced with low velocity deflections, is accompanied by lower initial firing rates and longer response latencies. C, Magnitudes of individual thalamic neuron responses to first-cycle deflections, which vary with respect to deflection velocity. D, Raw cross-correlogram (top) of an illustrative pair of TC neurons recorded simultaneously from the same thalamic barreloid in response to periodic sine waves of low velocity. Gray line indicates the shift predictor. The inset illustrates the cross-correlogram for the same pair during spontaneous activity. Stimulus-corrected cross-correlogram (bottom) was computed by subtracting the shift predictor from the raw cross-correlogram. The broken lines indicate the significance level set to 3.5 SD of the shift predictor. The two neurons receive significant shared input, as indicated by the peak of the correlogram exceeding the significance level. E, Thalamic firing synchrony is stronger during stimulus-evoked than spontaneous firing and increases systematically with higher velocity deflections. Gray squares, average peak correlation coefficients computed for each pair (N = 20) over all spikes; black squares, average strength computed over lags of −10 ms to + 10 ms.
In the second set of stimuli, deflection velocity remained constant but the repetition rate varied. Pulse-like deflections were generated by taking one cycle of a 40 Hz sine wave, as above (80 mm/s), and delivering it at uniform repetition rates of two per second for 4 s and at 8, 12, 20 and 40 per second for 2 s (see Fig. 4); hereafter repetition rate is described as stimulus frequency (Hz). The neurons' PW was deflected pseudorandomly using the five stimuli, and pseudorandomized blocks were delivered with interstimulus intervals of 1.5 s. Because of the large number of stimuli and long stimulus trains, 30, rather than 50, pseudorandomized blocks were delivered. Similar, brief periodic pulses having higher velocities have been used previously in our laboratory to study the response properties of VPm and thalamic reticular nucleus (Rt) neurons to low-frequency (1–10 Hz) (Hartings and Simons, 1998) and relatively high-frequency (12–40 Hz) whisker deflections (Hartings et al., 2003). To avoid possible saturation of firing synchrony resulting from high velocity whisker deflections, the present stimulus was of lower velocity (80 vs 140 mm/s). There were no discontinuities in the stimulus waveform or mechanical ringing of the stimulator as the whisker returned to baseline; this is evident in the cycle-time histograms (see Fig. 1B) as the absence of firing peaks at the beginnings and ends of the stimulus cycles.
Figure 4.

Thalamic responses and firing synchrony to periodic whisker deflections of different repetition rates. A, Thalamic population PSTHs to caudal periodic deflections of different frequencies but identical amplitude (1 mm) and velocity (80 mm/s). PSTHs were computed over 34 cells (17 pairs). Each cycle begins at the resting or neutral position of the whisker. Bin widths = 1 ms. Same scales are used for all panels. B, Population CTHs for first and last stimulus cycles. CTHs begin at the time of deflection onset; below, stimulus waveform. C, Raw cross-correlogram (top) from an illustrative pair of TC neurons recorded simultaneously from the same thalamic barreloid in response to periodic deflections at 20 Hz. This pair receives significant shared input, as indicated by the peak of the correlogram exceeding the significance level set to 3.5 SD of the shift predictor (gray line). E, Thalamic firing synchrony is stronger during stimulus-evoked than spontaneous firing and varies with deflection frequency. Conventions as in Figure 1E.
Noise/ramp hybrid stimuli.
The noise/ramp hybrid stimulus was designed to test the firing synchrony of simultaneously recorded TC neurons to the onset of a discrete whisker movement followed by an extended period of rapid, nonperiodic whisker deflections (Jones et al., 2004b). These stimuli were created to introduce a random component to deflection trains that might mimic more closely stimuli that occur naturally during whisking (Hipp et al., 2006). The stimulus consists of a ramp and hold deflection, with onsets having two different velocities (∼140 mm/s and ∼385 mm/s) and an amplitude of 500 μm. Superimposed on the plateau of the stimulus is a random noise vibration consisting of small, rapid whisker movements. The waveform was constructed by generating a random series of 0's and 1's in 1 ms intervals and filtering it using digital bessel filters to create high-frequency (10–700 Hz) and low-frequency (10–200 Hz) (i.e., velocity) domains (see Fig. 7); the vibrations last 2000 ms. The noise pattern is always the same, i.e., it is “frozen” noise. It was constructed by seeding a random noise generator with the same initial value and passing the waveform through the digital filter. For the high-frequency domain stimulus, the mean amplitude (trough-to-peak) of the perturbations was ∼.290 mm, and the mean velocity (calculated from trough-to-peak) was ∼150 mm/s; for the low-frequency domain stimulus, values were 0.250 and 50 mm/s, respectively. The neurons' PW was deflected pseudorandomly using the two stimuli, and each stimulus was delivered 50 times with interstimulus intervals of 1.5 s. The noise stimuli were identical to those used by Jones et al. (2004b) to study responses of primary afferent neurons in the trigeminal ganglion. Primary afferent neurons respond in highly time-locked manner to the rapid transitions in whisker movement produced by these stimuli. Reverse correlation analyses using similar stimuli showed that responses were most strongly related to the acceleration/velocity components of the noise stimulus (Jones et al., 2004a).
Figure 7.

Thalamic responses and firing synchrony to random noise whisker vibrations having high (10–700 Hz) and low (10–200 Hz) frequency/velocity domains. A, Thalamic population PSTHs (N = 24 cells) to high and low frequency/velocity noise vibrations. Bottom traces represent stimulus waveforms. B, Individual thalamic neuron responses either increase, decrease, or remain unchanged with low- versus high-frequency domain stimuli. Spike counts were computed over the 2000 ms period of the noise stimuli. C, Example raw cross-correlogram (top) showing correlated firing during stimulus-evoked activity in response to high frequency/velocity noise vibrations. The gray line represents the shift predictor; this pair receives significant shared input, as indicated by the peak of the correlogram exceeding the significance level set to 3.5 SD of the shift predictor. Note sharp (1–2 ms wide) peaks in the cross-correlograms. Stimulus-corrected cross-correlogram (bottom) was computed by subtracting the shift predictor from the raw cross-correlogram. D, Raw cross-correlogram (top) from a different pair of neurons showing a pronounced trough representing anti-correlated firing evoked during high frequency/velocity noise vibrations. Stimulus-corrected cross-correlogram (bottom) was computed by subtracting the shift predictor from the raw cross-correlogram; this pair did not receive common input. Conventions as in C.
Recordings were obtained from 23 pairs of TC cells. For nine pairs all three sets of stimuli were used, whereas for the rest only a single set or two sets were used, depending on the stability of the recordings.
Data analysis
Spike times were resampled to 1.0 ms bins and accumulated into peristimulus time histograms (PSTHs). Quantification of unit firing was derived from spike counts computed over time periods of interest, e.g., spontaneous activity, stimulus-driven activity. Closely related cycle time histograms (CTHs) were computed by taking spikes in each stimulus cycle, beginning at the times of deflection onsets. Spike counts were derived from the first and last cycles of each deflection in a train of periodic stimuli. First- and last-cycle responses provide measures of neuronal firing in the absence and presence of stimulation-induced adaptation (Khatri et al., 2004). CTHs were also used to identify the first spikes evoked in each cycle. We first defined the beginning and end of the population response to each stimulus cycle as the first and last 1 ms bins in a population CTH that were larger than 3.0 SDs from the mean spontaneous firing (p < 0.01). For each neuron, the first spike to each whisker deflection was then determined on a trial by trial basis as the first spike within this time window. The average latencies of these first spikes relative to deflection onset across trials and neurons were computed separately for the first and last deflections in the train.
Cross-correlation analysis.
The near-synchronous firing of simultaneously recorded TC spike trains and its dependence on stimulus parameters were assessed using cross-correlation analysis (Perkel et al., 1967). Cross-correlograms having 1 ms bins were computed separately for stimulus-evoked and spontaneous firing. Firing synchrony was quantified using two different measures.
First, a modified correlation coefficient computed as the peak of the normalized cross-correlogram using the normalization factor described by Aertsen et al. (1989):
 |
where NCCδ is the number of near-coincident events within the largest 1-ms bin of the correlogram within a lag (δ) range of −15 ms to + 15 ms, Tδ is the duration of the selected time window for which the correlogram is computed, and N1δ and N2δ are the number of spikes of the target and reference neurons during time Tδ. The lag range used was large enough to capture all peaks in the cross-correlograms. The measure assesses stimulus-dependent firing synchrony induced by both the stimulus and common inputs from other sources (Alloway et al., 1995) (see below). The correlation coefficient is a symmetrical measure of synchrony, that is, it does not distinguish between presynaptic and postsynaptic spikes; the analysis is appropriate for pairs of neurons that do not have connections with each other, such as the thalamocortical cells in VPm.
A second measure, strength (Alonso and Martinez, 1998; Bruno and Sakmann, 2006), was calculated as the number of near-synchronous events that occur within windows of ±5, 10 and 15 ms, normalized to the firing rates of the two neurons during the analysis period, e.g., prestimulus spontaneous activity, stimulus-evoked activity:
 |
where NCC is the sum of correlated events within a chosen synchrony window in the raw cross-correlogram, N1 and N2 are the number of spikes used from the two cells to compute the cross-correlogram. Unlike the above correlation coefficient, this value is based on near-synchronous spikes occurring within 5, 10 or 15 ms of each other, not just on the peak bin in the cross-correlogram.
A shift predictor was used to estimate the degree of correlation resulting from excitatory common input, likely from afferent neurons in brainstem trigeminal nuclei. The shift predictor was constructed by correlating spike times in a given trial with those occurring during the previous trial. The SD of the shift predictor was computed as the square root of the value in each 1 ms bin (Aertsen et al., 1989). A criterion significance level was set to 3.5 times the SD of each bin; this corresponds to a probability of <0.1% (p < 0.001). If a peak in the within-trial cross-correlogram, centered −15 to +15 ms around 0 time lag, exceeded this limit, synchrony resulting from common input was deemed statistically significant. Because there are 30 samples in this analysis window, the criterion level corresponds to a probability of <3% (p < 0.03).
Joint peristimulus time histograms.
To examine how thalamic firing synchrony varies in time as a function of the stimulus, we constructed normalized joint PSTHs (nJPSTHs) based on the approach described by Aertsen et al. (1989). In joint PSTHs (JPSTHs) the firing of one neuron in a given (1 ms) time bin is plotted with respect to the firing of the other neuron for individual time bins. The nJPSTH is a two-dimensional diagram of the normalized correlation (i.e., correlation coefficient) of the two neurons with respect to their instantaneous firing rates. Values on the diagonal represent the normalized numbers of coincidences at 0 lag, as a function of time. Within each point (pixel) of this matrix, firing synchrony was calculated as:
 |
where P1(t) and P2(t + δ) are the spiking probabilities of the two neurons at times t and t + δ, respectively, and P12(t,t + δ) is the probability that both neuron 1 spikes at time t and neuron 2 spikes at time t + δ (i.e., joint spiking probability). The equation is closely related to that used above for quantifying the degree of overall correlation, but here the calculation takes into account the time course of each cell's response. As above, this measure reflects both the correlation caused by direct stimulus modulation of the two neurons' firing rates and the correlation resulting from common input. By comparison, the measure originally used by Aertsen et al. (1989) is adjusted by the shift predictor (see below), and as such it reflects only the correlation resulting from common input alone.
For each stimulus condition, an average nJPSTH across all recorded pairs was constructed (see Figs. 3, 6). To measure the stimulus-induced modulation of synchrony, values corresponding to lags of ±5 ms, ±10 ms or ±15 ms at each side of the diagonal were averaged, resulting in an average normalized coincidence histogram. This is a population measure of stimulus-locked modulation of near-coincident firing (e.g., lags of −10 ms to +10 ms). Coefficients are not adjusted by a shift predictor, because we wished to assess firing synchrony induced by the stimulus as well as by potential common inputs.
Figure 3.
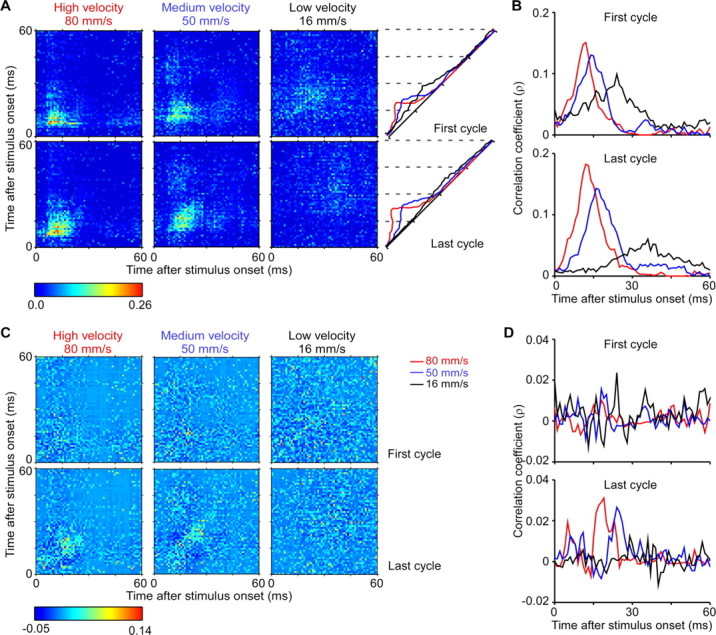
Evolution of thalamic firing synchrony. A, Population nJPSTHs from 20 pairs of neurons in response to the first and last cycles of periodic stimuli having different velocities. Bright yellow-to-red pixels along the diagonal indicate increasingly stronger correlations with 0 ms lag. Higher velocity deflections generate clusters of brighter pixels along the diagonals that are closer to the onset of the stimulus cycle. Right panels, values in the population nJPSTHs over lags of −10 to +10 ms were averaged and plotted separately for first and last cycles. Red, blue, and black traces depict high, medium, and low velocity deflections. B, Higher resolution plots of cycle-time nJPSTHs at right in A. C, Population averages from shift predictor-adjusted and normalized JPSTH (pJPSTH) over the same 20 pairs of neurons as above, in response to the first and last cycles of periodic stimuli having different velocities. Teal and yellow-to-red pixels along the diagonal indicate increasingly stronger correlations with 0 ms lag above those induced by chance or by stimulus alone; blue and darker blue pixels indicate correlations below those expected by chance and stimulus alone. D, Values in the population pJPSTHs over lags of −10 to +10 ms were averaged and plotted separately for first and last cycles. Red, blue, and black traces depict high, medium and low velocity deflections.
Figure 6.

Evolution of thalamic firing synchrony during periodic deflections of different frequencies. Conventions as in Figure 3. A, Population nJPSTHs from 17 pairs of neurons in response to the first and last cycles of a periodic stimulus of different frequencies. Values in the population nJPSTHs over lags of −10 to +10 ms were averaged. For the last stimulus cycle, higher frequency deflections generate clusters of less bright pixels along the diagonals that are further away from the onset of stimulus cycle. B, Higher resolution plots from A.
To assess whether correlations resulting from common input alone contribute to variations in firing synchrony that occur during ongoing stimulation, we also computed a shift-predictor adjusted and normalized JPSTH (pJPSTH) as described originally in Aertsen et al. (1989).
 |
where P1(t), P2(t + δ), and P12(t,t + δ) are the spiking probabilities described above. An average pJPSTH across all recorded pairs was constructed (see Fig. 3C) and values corresponding to lags of −10 ms to + 10 ms at each side of the diagonal were averaged (Fig. 3D), as described above.
Periodic and noise stimuli were always delivered in the caudal direction. We performed the following analysis to examine the extent to which firing synchrony was related to the directional preferences of the cells. For each cell, a polar plot was constructed based on the spike count evoked by stimulus onset (the first 20 ms of the response) at each of the eight directions tested with the multi-angle stimulator (above). The directional preference of the cell was quantified by calculating a vector from the polar plot, and the angle was found between that vector and the caudal direction (i.e., the direction of the periodic and noise stimuli). The obtained angles were then averaged for the cells in each pair, yielding an index of how much the pair's angular preference differed from caudal. This index was subsequently regressed with synchrony measures derived from the periodic and noise stimuli.
Statistical analysis. One-way ANOVAs with repeated measures were used to assess effects of different stimulus parameters, e.g., deflection velocity, on measures of response magnitude or firing synchrony. Factorial ANOVAs for repeated measures were used to compare data in the first- and last-cycles of periodic stimuli to determine whether response measures are affected by stimulus adaptation. t tests were used to compare effects of each two stimulus conditions on response measures.
Results
Responses of VPm neurons to periodic whisker deflections of different velocities
In 20 pairs of simultaneously recorded thalamocortical cells from the same physiologically identified barreloid we investigated the relationship between thalamic firing synchrony and whisker deflection velocity and stimulus-induced adaptation. We deflected the cells' common Principal Whisker with periodic deflections of identical amplitude and repetition rate but differing in velocity. Figure 1A shows population PSTHs from all 40 TC neurons in response to 8 Hz whisker deflections having average velocities of 80 (high), 50 (medium) and 16 (low) mm/s. Responses to the first deflection in each train are velocity-dependent with faster whisker movements evoking greater initial firing rates within the population. As reported previously (Hartings et al., 2003; Khatri et al., 2004), adaptation effects are also velocity-dependent such that, compared with the medium and high velocity deflections, responses to the second and subsequent presentations of the low velocity deflections are noticeably reduced relative to the response evoked by the first deflection in the train.
Velocity and adaptation effects are seen more clearly in cycle-time histograms depicting responses to the first and last stimuli in the train (Fig. 1B). Two activity peaks per stimulus cycle can be discerned with the medium and low velocity stimuli; these correspond to the positive-going and negative-going phases of the whisker movement and are analogous to the phasic ON and OFF responses to the onset and offset of a ramp-and-hold deflection. With the high velocity deflection the secondary response is greatly attenuated because of the short interval between stimulus “onset” and “offset” (Kyriazi et al., 1994). Consistent with previous results (Pinto et al., 2000), spike counts of individual thalamic neurons as a function of deflection velocity varied (Fig. 1C, first cycle). Among the 80 neurons, slopes were mixed, positive, negative or flat. Population spike counts during the response duration decrease in magnitude with increasing deflection velocities (ANOVA, p values <0.0001; paired t test, p values <0.0001) for both the first (low to high velocity, 3.2 vs 2.2 vs 1.7 spikes/stimulus) and last stimuli in the trains (3.3 vs 2.2 vs 1.8 spikes/stimulus). The larger spike counts for the low velocity stimulus reflect the longer period of the 8 Hz sinusoid used as the deflecting stimulus (125 ms). When spike counts were normalized to response duration, mean firing rates increase with faster deflections for both the first and last stimuli in the trains (ANOVA, p values <0.0001; paired t test, p values <0.0001).
We investigated the simultaneous firing of thalamic neurons by quantifying firing synchrony. Synchrony was assessed for each simultaneously recorded pair of neurons by first constructing cross-correlograms separately for evoked and spontaneous firing (Fig. 1D) and then computing a modified correlation coefficient that takes into account the firing rates of the neurons (Methods). Correlograms for all analyzed pairs had peaks corresponding to time lags of 0–15 ms. Synchrony above that induced by chance and/or by the stimulus alone was assessed by comparing the peak in the correlogram with the shift predictor. The example in Figure 1D illustrates a pair of near-synchronously firing neurons that receives significant shared input, as indicated by the peak of the correlogram exceeding the significance level set to 3.5 SD of the shift predictor. Analyses using shift-predictors showed that 9 of 19 pairs received significant shared input, likely arising from a common brainstem afferent (see Discussion).
Correlation coefficients for 20 pairs of thalamic neurons are plotted as a function of deflection velocity in Figure 1E. Coefficients are larger during evoked than spontaneous firing and significantly increase with higher velocity deflections (ANOVA, p < 0.0002, all paired t tests, p values <0.02). Even the lowest velocity stimulus was associated with correlation coefficients greater than spontaneous activity (t test, p = 0.016). Similar results were obtained for the measure of strength computed over lags of ±5, 10 and 15 ms (ANOVA, p values <0.007, see Materials and Methods). The strength values over lags of ±10 ms showed the largest variation with velocity and are depicted in Figure 1E.
Thalamic barreloid neurons respond sparsely to a discrete (i.e., ramp-and-hold) whisker deflection, typically firing 0–3 spikes/stimulus and in many cases only a single spike (Pinto et al., 2000). This suggests that the first spike in the response is important for encoding stimulus information. We examined this by analyzing the time of the first spike evoked by each whisker deflection (see Materials and Methods). Figure 2A shows PSTHs constructed for first-spikes, illustrating that the earliest responses of thalamic neurons occur with greater temporal precision and with shorter latencies for higher velocity deflections (ANOVA, p < 0.00001; paired t tests, p values <0.00001). Moreover, with the high velocity deflections, average first-spike latencies were similar for the first and the last stimuli in the train (first: 10.7 ms, last: 11.5 ms), whereas for the low velocity deflections the latency difference was >15 ms (first, 29.5 ms; last, 48.6 ms). Correspondingly, first-spike firing synchrony increases in a velocity-dependent manner for both first- and last-cycle deflections (Fig. 2B, ANOVA, p < 0.0005; paired t test, p values <0.007). First-spike synchrony is generally smaller with last-cycle deflections, although significantly so only for the lowest velocity (paired t test, p < 0.001).
Figure 2.

Velocity-dependent changes in spike timing and synchrony of the first spike evoked by whisker deflection. A, Population PSTHs constructed for first spikes on a trial-by-trial basis for the first (white) and last (gray) stimulus cycles. Thalamic neurons respond with greater temporal precision (less spike timing variability) and shorter latencies to higher velocity deflections. B, Synchrony of first spikes for first and last stimulus cycles as a function of deflection velocity.
The all-spikes and first-spikes PSTHs in Figures 1 and 2 indicate that thalamic responses begin earlier and are less temporally dispersed when whiskers are moved rapidly. The temporal development of firing synchrony was examined using population normalized Joint-Peristimulus Time Histograms (nJPSTHs) from all 20 pairs of neurons. A JPSTH was constructed for each cell pair on a millisecond by millisecond basis and then normalized to take into account the firing rates of the neurons (see Materials and Methods). Values along the diagonal correspond to the correlation coefficient with 0 ms lags. Bright yellow to red pixels along the diagonal indicate increasingly stronger correlation values for two cells firing at exactly the same time. Values in pixels along parallel lines moving away from the diagonal correspond to correlations at progressively larger positive or negative time lags. The different panels show population nJPSTHs to the first or last stimulus cycles. High velocity deflections are associated with a clear clustering of brightly colored pixels along the diagonals for both first- and last-cycle responses, whereas low velocity deflections are associated with relatively few bright pixels, even for first cycle responses. Moreover, brightly colored pixels are located nearer to the onset of the stimulus cycle for the high velocity deflections than for the medium and low velocity ones.
To examine further the time course of near-synchronous firing, values in the population nJPSTHs over a set of bins corresponding to time lags of ±5 ms, ±10 ms and ±15 ms were averaged. Time-dependent changes in firing synchrony over lags of ±10 ms are plotted for the full cycle period in the diagonals at the right of panel A and also with expanded time scales in panel B. The resulting waveforms illustrate the stimulus-locked modulation of near-coincident firing and indicate that firing synchrony is greater and develops more quickly with higher velocity deflections. Qualitatively similar results were obtained for all three lag windows, but peak values were largest for the ±5 ms lag window (e.g., 22–39% increase compared with the ±10 ms lag window).
To examine the contribution of common input to the overall time-varying synchrony during ongoing stimuluation, we subtracted the shift predictor from the JPSTH and normalized the difference. The shift-predictor adjusted and normalized JPSTH (pJPSTH), averaged across all pairs, is depicted in Figure 3C. The time course of near-synchrony was examined further by averaging values in the population pJPSTH corresponding to lags of ±10 ms at each side of the diagonal (Fig. 3D). The resulting waveforms reflect near-coincident firing above (positive values) or below (negative values) levels attributable to chance or to the effects of the stimulus alone. Results indicate a contribution of common input to overall firing synchrony during repetitive whisker deflections. This contribution depends on both deflection velocity and the degree of sensory adaptation.
Responses of VPm neurons to periodic whisker deflections of different frequencies
We have demonstrated that, for a given repetition rate (i.e., 8 Hz), firing rate adaptation is more pronounced with lower velocity deflections, and this is accompanied by a greater loss of firing synchrony. Repetition rate itself is also associated with response adaptation and diminished firing synchrony. Figure 4 shows data from 17 pairs of TC neurons obtained using periodic whisker deflections of different repetition rates (2, 8 12, 20 and 40 Hz) but identical velocity (80 mm/s). At the two stimulus frequencies >12 Hz (20, 40 Hz), population responses across the 34 cells were significantly depressed, exhibiting smaller peak magnitudes from the first to subsequent stimulus cycles (ANOVA, p < 0.02) and longer latencies to response onsets and response peaks. Effects were evident starting from the second stimulus cycle. Cross-correlation analysis reveals frequency-dependent changes in thalamic firing synchrony (Fig. 4C,D) (ANOVA, p < 0.02). Similar to the results for periodic stimuli of different velocities, correlograms had peaks at time lags of 0–15 ms. Synchrony decreases for deflection frequencies of 20 and 40 Hz, as illustrated in Figure 4D for the correlation coefficient and strength values over a lag window of ±10 ms. Similar results were obtained for strength values over time lags of ±5 and ± 15 ms. Significant correlations because of common input were detected in 8 of 17 pairs (p values <0.03).
Weak correlation coefficients for repetition rates of 2 and 8 Hz reflect the short duration of the whisker deflection (25 ms) relative to the total time of the stimulus cycle (i.e., 500, 125 ms) and hence the inclusion of many non-stimulus driven spikes. Cross-correlation analyses of first-spikes, all of which are presumably evoked directly by whisker deflection, indicate that firing synchrony is as robust at 2 Hz and 8 Hz stimulus trains as it is with 12 Hz trains (Fig. 5B). Indeed, first-spike synchrony was similar across frequencies when examined for the first stimulus cycle in the periodic train (ANOVA, p > 0.5). During the last cycle, however, firing synchrony decreases with increasing stimulus frequency (ANOVA, p < 0.007), at trend level for frequencies >8 Hz and reaching significance at 20 Hz (Fig. 5B, paired t test for 20 Hz, p < 0.02). Thus, adaptation is associated with a decrease in thalamic firing synchrony.
Figure 5.

Frequency-dependent changes in spike timing and synchrony for the first spike evoked by each whisker deflection. A, First-spike population PSTHs constructed for the first (white) and last (gray) stimulus cycles. B, First-spike synchrony for first and last cycles as a function of stimulus frequency. During the last cycle, synchrony decreases with increasing stimulus frequency, reaching significance at 20 Hz (see Results).
Examination of the first spike histograms in Figure 5A indicates that first-spike responses to the last deflection in the stimulus train are frequency-dependent. With frequencies >8 Hz the probability of a response decreases (ANOVA, p < 0.002) and those spikes that do occur do so at longer latency (ANOVA, p < 0.00001; paired t test, p values <0.0001). As illustrated in the population nJPSTHs in Figure 6, in the adapted state firing synchrony takes longer to develop during the stimulus cycle. Values in the population nJPSTHs were averaged as before over a set of bins corresponding to time lags of ±5 ms, ±10 ms, and ±15 ms and results for the lag window of ±10 ms are illustrated in Figure 6B. With 40 Hz stimuli, firing synchrony during the last deflection is low and nearly uniform across the stimulus cycle. Similar time-varying changes in near-synchrony were observed for all three lag windows, although peak values were largest for the ±5 ms lag window(e.g., up to 40% increase compared with the ±10 ms lag window). Consistent with the aforementioned results for the velocity stimuli, the population pJPSTH adjusted by the shift predictor indicates that contributions from common input become evident during the second and subsequent deflections within a train (data not shown); this stimulus-related pattern of positive values in the pJPSTH was evident for stimulus frequencies of 8–20 Hz, but disappeared for 40 Hz deflections, when adaptation becomes more pronounced.
Responses of VPm neurons to small, random whisker vibrations
Thalamic synchrony during random, small whisker vibrations having higher (10–700 Hz) and lower (10–200 Hz) frequency (i.e., velocity) domains (Fig. 7A) were investigated in 12 simultaneously recorded TC-TC pairs. Higher frequency vibrations either increase (13 of 24) or decrease (11 of 24) the overall firing rates of individual TC cells (Fig. 7B). Mean firing rates were similar during the noise component of the two stimuli (70.46 ± 6.68 vs 66.82 ± 6.09 spikes/stimulus, paired t test p > 0.5), despite larger peaks present in the population PSTH for the former stimulus (Fig. 7). Near-equivalent overall firing rates likely reflect, in the case of the higher-frequency noise, countervailing effects of high velocity deflections, that evoke higher afferent firing rates, and more frequent deflections, which lead to stronger sensory adaptation (see Discussion).
For each pair of units the low- and high-frequency domain stimuli enhance thalamic firing synchrony relative to spontaneous firing (paired t tests, p values <.04), although measures of strength do not differ (p values <0.18). Correlation coefficients measuring overall firing synchrony are similar for the two stimuli (p > 0.4). However, in contrast to the broad peaks and regular patterns observed for correlograms based on periodic deflections, cross-correlograms obtained for random whisker vibrations typically have sharp peaks that are only a few ms wide (Fig. 7C). Moreover, whereas peaks in the correlograms for periodic deflections occurred at time lags of 0–15 ms, those for the noise vibrations occurred at lags of only 0–5 ms. In addition, many of the correlograms had distinct troughs (Fig. 7D), likely reflecting feedback inhibition from the thalamic reticular nucleus. The troughs are visible in the noise-associated cross-correlograms because, unlike cross-correlograms from the periodic stimuli, they have elevated, uniform baselines.
Examination of population nJPSTHs (Fig. 8A) indicated that, with the greater resolution provided by this analysis, the high velocity ramp deflection and the following high frequency noise vibrations were associated with brief epochs in which firing synchrony was clearly higher relative to that evoked by the low velocity ramp and low frequency noise. This is evident in the expanded time-dependent correlation traces reflecting averaged near-synchronous firing over lags of ±5 ms (Fig. 8B). Consistent with synchrony peaks that are sharp and close to 0 time lag, averaging values in the population nJPSTHs over a set of bins corresponding to time lags of ±10 ms resulted in a pronounced drop in peak values to ∼65% of those computed for the ±5 lag window. The high noise stimulus is associated with brief but larger peak correlations and, consistent with Figure 7C,D, deeper troughs. Comparison of the correlation coefficients in the 2000 noise-associated bins in the population nJPSTHs (Fig. 8C) indicated that the high-frequency stimulus was associated with larger overall values (p < 0.0001), larger above baseline values (p = 0.0002) and smaller below baseline values (p = 0.01); the latter two measures were computed after subtracting from each point the mean value calculated over all 2000 points.
Figure 8.

Evolution of firing synchrony during random noise whisker vibrations having high (10–700 Hz) and low (10–200 Hz) frequency/velocity domains. A, Population nJPSTHs from 12 pairs of neurons illustrate stimulus-locked modulations of synchrony beginning from ramp onset (0 ms; first row) and during a subsequent period of random noise vibrations (600–725 ms after ramp onset; second row). Conventions as in Figure 3. Higher velocity deflections both during the ramp and the noise vibrations generate clusters of brighter pixels along the diagonals; clusters are more focused during the noise vibrations. B, Values in the population nJPSTHs over lags of −5 to +5 ms were averaged and plotted for the stimulus periods illustrated in A. C, Averages in the population nJPSTHs over lags of −5 to + 5 ms are plotted here for the full duration of the stimulus; ramp onset denoted by arrow in bottom graph. Synchrony is at baseline levels during the first 2 s of spontaneous firing. The high (red) versus low (black) frequency noise is associated with brief epochs of increased synchrony and also deeper troughs.
Angular tuning and firing synchrony
We investigated whether the degree of firing synchrony among pairs of neurons is greater when the cells have more similar angular preferences. Using vectors obtained from polar plots generated by deflecting the whisker in eight different directions, we calculated for each pair the average difference of the cells' angular preference from 0 degrees, the direction in which the periodic and noise stimuli were delivered. A large average difference indicates that one or both cells responded better to deflections at angles other than the test angle. Average vector difference was regressed with the synchrony correlation coefficient separately for the velocity, frequency and noise stimuli. For each type of velocity or frequency stimulus used, p values were inversely related to average vector difference (all p values <0.05), indicating that when both cells had angular preferences similar to the tested angle of 0 degrees, they fired more synchronously. Regression coefficients for the noise stimuli were not statistically significant, although the relationship was stronger for the low (R2 = 0.44, p = 0.16) vs the high frequency stimuli (R2 = 0.06, p = 0.85).
The shift predictor analyses indicated common input in 40% of the 23 unique cell pairs (duplicate pairs used for more than one stimulus protocol were counted only once). We predicted that such pairs should have more similar angular tuning preferences than cell pairs not receiving common input. To examine this we calculated the difference in vector angles of the polar plots and compared the difference values between cells pairs having common input and those that did not. Mean differences were smaller for the common input group (54.6 ± 58 vs 119 ± 56 deg, t test, p = 0.016). A second analysis compared the shapes of the polar plots using a correlation coefficient calculated by regressing the responses of the two cells (in mean spikes/stimulus) to the eight different directions of whisker movement; the polar plots were first normalized to the maximum angle firing rate. A value of 1.0 indicates that two cells have identically shaped polar plots, whereas an index of –1.0 indicates opposite directional preferences. Cell pairs having common input had more similarly shaped polar plots than cells lacking common input, which tended to have oppositely shaped polar plots (0.34 ± 0.60 vs −0.23 ± 0.52, t test, p = 0.03).
Discussion
Signal transmission in thalamocortical circuits is thought to be enhanced by synchronous or near-synchronous firing of thalamic neurons (Sillito et al., 1994; Alonso et al., 1996; Roy and Alloway, 2001), a necessity, perhaps, because of the relatively weak postsynaptic effects of individual thalamocortical synapses (Bruno and Sakmann, 2006). Direct evidence for a synchrony code in the thalamus is, however, limited. Here, we directly measured thalamic firing synchrony in the somatosensory whisker/barrel system by simultaneously recording pairs of TC cells located in the same electrophysiologically identified thalamic barreloid and likely projecting to the same cortical barrel in layer 4. Thalamic firing synchrony changes systematically with stimulus parameters known to affect both population activity of TC neurons and firing of cortical neurons. We also examined the time course of near-synchronous firing using a cross-correlation approach based on computation of joint peristimulus time histograms normalized (nJPSTH) to take into account the instantaneous firing rates of the neurons (Aertsen et al., 1989). Unlike the classic cross-correlogram that considers all stimulus-evoked spikes over time together, this measure revealed that, depending on deflection velocity, frequency and degree of sensory-evoked adaptation, thalamic firing synchrony develops within a few mss of the onset of the thalamic response and that it changes quickly corresponding to rapid changes in stimulus velocity.
Thalamic firing synchrony is greater and develops more quickly after higher velocity whisker deflections. These velocity-dependent increases in thalamic synchrony reflect, in part, velocity-dependent increases in the early firing rates of the neurons. Consistent with previous reports (Pinto et al., 2000), we found that total response magnitudes of individual TC cells in VPm either increase, decrease or remain constant with higher velocity deflections. At the population level, however, instantaneous firing rates are larger during the first several ms of the response evoked by high velocity deflections (Pinto et al., 2000; Hartings et al., 2003). This is consistent with recent in vitro and theoretical work reporting that firing synchrony is directly related to overall firing rate (de la Rocha et al., 2007). In addition, we found that higher velocity deflections are associated with shorter and less variable first-spike latencies and also with greater first-spike firing synchrony, indicating that enhanced thalamic synchrony also reflects greater thalamic spike time precision relative to stimulus onset. High-velocity whisker deflections evoke precisely timed, short-latency and highly consistent responses in trigeminal ganglion neurons (Shoykhet et al., 2000; Jones et al., 2004a), and these temporal patterns appear to be preserved in brainstem relay neurons (Minnery and Simons, 2003). Within VPm, sensory-driven inhibitory feedback from the thalamic reticular nucleus onto proximal and distal dendrites of barreloid neurons (Peschanski et al., 1983) also likely affects the whisker-evoked timing and rates of TC cell firing (Hartings et al., 2003).
Using a shift-predictor based analysis, we found in ∼40% of our recorded TC pairs evidence for common input, another factor contributing to firing synchrony. Cell pairs having common input have more similar angular preferences than those that do not. Because TC neurons do not make connections with each other (Barbaresi et al., 1986), these common inputs arise from divergent synaptic connections (Veinante and Deschênes, 1999) from brainstem afferent neurons. Trigeminothalamic inputs elicit fast-rising, large-amplitude postsynaptic potentials in TC cells (Brecht and Sakmann, 2002; Castro-Alamancos, 2002). Corticothalamic feedback could also contribute to spike-time precision and thalamic synchrony directly via excitatory inputs onto distal dendrites of TC cells and indirectly via synapses onto inhibitory cells in Rt (Rouiller and Welker, 2000; Sillito and Jones, 2002; Andolina et al., 2007). Interestingly, stimulus-related fluctuations in the relative contribution of common input to firing synchrony became apparent only after the first deflection in the train. This suggests that, during ongoing whisker deflections such as those associated with active touch, circuitry providing common inputs to TC cells plays a greater role in generating synchronous firing, and thus in the transmission of sensory information through the thalamocortical system.
Thalamic firing synchrony decreases and develops more slowly in an adapted state produced by repetitive whisker deflections. This is clearly evident in Figure 8 where the onset ramps, which are not preceded by previous whisker deflection, evoke more firing synchrony than the noise stimuli, which follow the onset ramps and themselves produce on-going adaptation. Adaptation effects were most prominent for trains of low-velocity, continuous sinusoidal deflections. Similar decreases and slower time courses of evoked synchrony were observed for high velocity deflections delivered periodically at high frequency. Thalamic sensory adaptation is caused by frequency-dependent depression of trigeminothalamic synapses (Castro-Alamancos, 2002, 2004; Deschênes et al., 2003) and Rt-mediated inhibition (Hartings et al., 2003). The net effect is a decrease in evoked firing rates and less temporal precision of thalamic spiking. Both would in turn decrease thalamic firing synchrony. The sharp peaks and troughs evident in the cross-correlograms of the high-frequency noise stimulus (Fig. 8) suggest, however, that diminution of firing synchrony associated with sensory adaptation can be at least partially mitigated when sequential whisker deflections are of high velocity/acceleration. Such perturbations may occur during active touch in the context of grip-slip movements of the whiskers (Ritt et al., 2008).
We used a frozen noise stimulus to examine how thalamic firing synchrony might encode continually varying, rapid random changes in whisker deflection that could occur naturally during active touch when animals are exploring objects with their whiskers. Such rapid changes in firing synchrony can be readily measured using the nJPSTHs. Overall mean firing rates were equivalent for the two stimuli. However, both stimuli were associated with sharp peaks and troughs in instantaneous population firing rates and firing synchrony. Synchrony differences between peaks and troughs were more pronounced for the high-velocity domain stimulus. On the basis of our analyses of firing synchrony associated with periodic deflections, we attribute the larger momentary increases in synchrony to higher velocity deflections and the more pronounced decreases to more frequent deflections that produce trigeminothalamic synaptic depression and strong Rt-mediated inhibition. Interestingly, the precise pattern of firing synchrony differs at many time points from the pattern of population firing. This reflects the fact that synchrony measures, which depend on precise spike timing of neurons relative to each other during a single stimulus, varies with but it is not identical to instantaneous firing rates measured by population PSTHs accumulated across different trials. If barrel circuitry is more sensitive to population firing synchrony than firing rate per se (see below), the millisecond-by-millisecond firing of cortical neurons in response to this complex stimulus should follow more closely the pattern revealed by the population nJPSTH (Fig. 8C) than that of the population PSTH (Fig. 7A). This prediction has not been tested yet.
We found that peaks in individual cross-correlograms occurred at lags of 0–15 ms during periodic whisker movements of frequencies <40 Hz, but only at lags <5 ms during random high frequency noise vibrations. Moreover, peaks were often tens of ms wide for the periodic stimuli, but only 1–2 ms wide for the more rapidly changing random noise vibrations. Interestingly, examination of near-synchronous firing at the population level using population nJPSTHs revealed peak values that were largest when evaluated over lags of ±5 ms and increasingly smaller for larger lag windows of ±10 ms (Figs. 3B, 6B) or ±15 ms. Consistent with sharper, near-0 time lag peaks observed for the noise vs periodic stimuli, this tendency was more pronounced during higher frequency domain noise vibrations. Thus, rapid changes in whisker velocity are best represented by groups of TC cells generating closely timed spikes within <5 ms of each other (Fig. 8). The time scale of near-synchrony suggested here to be relevant for afferent information encoding is consistent with previous findings that two spikes from different TC neurons are more likely to drive a common postsynaptic cortical cell if they occur within <8 ms of each other (Alloway et al., 1995; Usrey et al., 2000, Roy and Alloway, 2001). Cortical EPSPs produced by individual TC synapses are small relative to depolarizations produced by effective whisker deflections (e.g., ∼0.5 vs 15 mV) (Bruno and Sakmann 2006), suggesting that converging near-synchronous inputs from at least 30 TC neurons are required to sum for cortical spiking. Intracellular recordings in vivo reveal that cortical neurons are sensitive to the rate of depolarization, changing their spike threshold as a function of EPSP slope (Wilent and Contreras, 2005). Steeper EPSPs, such as those evoked by more closely timed TC inputs, could therefore drive a cortical cell to fire sooner and with higher probability. This cellular mechanism renders cortical responses selective to different degrees of thalamic synchrony and has been proposed to enhance feature selectivity in barrel cortex (Wilent and Contreras, 2005). Convergent, synchronous thalamic inputs evoked by high velocity movements are thought to engage momentarily the excitatory network in layer 4 before activity is damped by strong feedforward and feedback inhibition (Pinto et al., 2000; Wilent and Contreras, 2004).
The time scale of near-synchrony that is presumably relevant for encoding deflection velocity is consistent with our previous reports using local field potential recordings in VPm. The magnitude of the early component of thalamic LFPs, lasting 1.2–7 mss, increases with deflection velocity but also in response to other stimuli that optimally engage cortical activity, including deflections of principal vs adjacent whiskers and deflections in preferred vs nonpreferred directions (Temereanca and Simons, 2003). TC neurons having different directional preferences terminate in different angular tuning domains within layer 4 barrels, where they preferentially contact cortical cells having similarly shared directional preferences (Bruno and Simons, 2002; Bruno et al., 2003). Thus, synchronous activity among converging TC neurons is thought to determine directional tuning of cortical neurons, which is further sharpened by the neuron's sensitivity to the slope of depolarization (Wilent and Contreras 2005). This view is supported by our finding that firing synchrony among pairs of thalamocortical neurons is greater when the cells have more similar angular preferences. Together with previous work, present results support the view that millisecond by millisecond changes in thalamic near-synchronous firing encode complex stimuli that optimally engage cortical circuitry during active touch.
Footnotes
This work was supported by Natinal Institutes of Health Grants NS19950 (D.J.S), HD050627 (S.T.), DA015644 (E.N.B.), and MH59733 (E.N.B.). We thank Dr. Harold Kyriazi for expert technical assistance with data recordings and Dr. Robert Haslinger for helpful discussions and technical assistance with data analysis.
References
- Aertsen AM, Gerstein GL, Habib MK, Palm G. Dynamics of neuronal firing correlation: modulation of “effective connectivity”. J Neurophysiol. 1989;61:900–917. doi: 10.1152/jn.1989.61.5.900. [DOI] [PubMed] [Google Scholar]
- Alloway KD, Johnson MJ, Aaron GB. A comparative analysis of coordinated neuronal activity in the thalamic ventrobasal complex of rats and cats. Brain Res. 1995;691:46–56. doi: 10.1016/0006-8993(95)00602-m. [DOI] [PubMed] [Google Scholar]
- Alonso JM, Martinez LM. Functional connectivity between simple cells and complex cells in cat striate cortex. Nat Neurosci. 1998;1:395–403. doi: 10.1038/1609. [DOI] [PubMed] [Google Scholar]
- Alonso JM, Usrey WM, Reid RC. Precisely correlated firing in cells of the lateral geniculate nucleus. Nature. 1996;383:815–819. doi: 10.1038/383815a0. [DOI] [PubMed] [Google Scholar]
- Andolina IM, Jones HE, Wang W, Sillito AM. Corticothalamic feedback enhances stimulus response precision in the visual system. Proc Natl Acad Sci U S A. 2007;104:1685–1690. doi: 10.1073/pnas.0609318104. [DOI] [PMC free article] [PubMed] [Google Scholar]
- Barbaresi P, Spreafico R, Frassoni C, Rustioni A. GABAergic neurons are present in the dorsal column nuclei but not in the ventroposterior complex of rats. Brain Res. 1986;382:305–326. doi: 10.1016/0006-8993(86)91340-5. [DOI] [PubMed] [Google Scholar]
- Brecht M, Sakmann B. Whisker maps of neuronal subclasses of the rat ventral posterior medial thalamus, identified by whole-cell voltage recording and morphological reconstruction. J Physiol. 2002;538:495–515. doi: 10.1113/jphysiol.2001.012334. [DOI] [PMC free article] [PubMed] [Google Scholar]
- Bruno RM, Simons DJ. Feedforward mechanisms of excitatory and inhibitory cortical receptive fields. J Neurosci. 2002;22:10966–10975. doi: 10.1523/JNEUROSCI.22-24-10966.2002. [DOI] [PMC free article] [PubMed] [Google Scholar]
- Bruno RM, Sakmann B. Cortex is driven by weak but synchronously active thalamocortical synapses. Science. 2006;312:1622–1627. doi: 10.1126/science.1124593. [DOI] [PubMed] [Google Scholar]
- Bruno RM, Khatri V, Land PW, Simons DJ. Thalamocortical angular tuning domains within individual barrels of rat somatosensory cortex. J Neurosci. 2003;23:9565–9574. doi: 10.1523/JNEUROSCI.23-29-09565.2003. [DOI] [PMC free article] [PubMed] [Google Scholar]
- Carvell GE, Simons DJ. Biometric analyses of vibrissal tactile discrimination in the rat. J Neurosci. 1990;10:2638–2648. doi: 10.1523/JNEUROSCI.10-08-02638.1990. [DOI] [PMC free article] [PubMed] [Google Scholar]
- Castro-Alamancos MA. Properties of primary sensory (lemniscal) synapses in the ventrobasal thalamus and the relay of high-frequency sensory inputs. J Neurophysiol. 2002;87:946–953. doi: 10.1152/jn.00426.2001. [DOI] [PubMed] [Google Scholar]
- Castro-Alamancos MA. Absence of rapid sensory adaptation in neocortex during information processing states. Neuron. 2004;41:455–464. doi: 10.1016/s0896-6273(03)00853-5. [DOI] [PubMed] [Google Scholar]
- de la Rocha J, Doiron B, Shea-Brown E, Josić K, Reyes A. Correlation between neural spike trains increases with firing rate. Nature. 2007;448:802–806. doi: 10.1038/nature06028. [DOI] [PubMed] [Google Scholar]
- Deschênes M, Timofeeva E, Lavallée P. The relay of high-frequency sensory signals in the Whisker-to-barreloid pathway. J Neurosci. 2003;23:6778–6787. doi: 10.1523/JNEUROSCI.23-17-06778.2003. [DOI] [PMC free article] [PubMed] [Google Scholar]
- Hartings JA, Simons DJ. Thalamic relay of afferent responses to 1- to 12-Hz whisker stimulation in the rat. J Neurophysiol. 1998;80:1016–1019. doi: 10.1152/jn.1998.80.2.1016. [DOI] [PubMed] [Google Scholar]
- Hartings JA, Temereanca S, Simons DJ. Processing of periodic whisker deflections by neurons in the ventroposterior medial and thalamic reticular nuclei. J Neurophysiol. 2003;90:3087–3094. doi: 10.1152/jn.00469.2003. [DOI] [PubMed] [Google Scholar]
- Hipp J, Arabzadeh E, Zorzin E, Conradt J, Kayser C, Diamond ME, König P. Texture signals in whisker vibrations. J Neurophysiol. 2006;95:1792–1799. doi: 10.1152/jn.01104.2005. [DOI] [PubMed] [Google Scholar]
- Jones LM, Depireux DA, Simons DJ, Keller A. Robust temporal coding in the trigeminal system. Science. 2004a;304:1986–1989. doi: 10.1126/science.1097779. [DOI] [PMC free article] [PubMed] [Google Scholar]
- Jones LM, Lee S, Trageser JC, Simons DJ, Keller A. Precise temporal responses in whisker trigeminal neurons. J Neurophysiol. 2004b;92:665–668. doi: 10.1152/jn.00031.2004. [DOI] [PMC free article] [PubMed] [Google Scholar]
- Khatri V, Hartings JA, Simons DJ. Adaptation in thalamic barreloid and cortical barrel neurons to periodic whisker deflections varying in frequency and velocity. J Neurophysiol. 2004;92:3244–3254. doi: 10.1152/jn.00257.2004. [DOI] [PubMed] [Google Scholar]
- Kyriazi HT, Carvell GE, Simons DJ. OFF response transformations in the whisker/barrel system. J Neurophysiol. 1994;72:392–401. doi: 10.1152/jn.1994.72.1.392. [DOI] [PubMed] [Google Scholar]
- Minnery BS, Simons DJ. Response properties of whisker-associated trigeminothalamic neurons in rat nucleus principalis. J Neurophysiol. 2003;89:40–56. doi: 10.1152/jn.00272.2002. [DOI] [PubMed] [Google Scholar]
- Perkel DH, Gerstein GL, Moore GP. Neuronal spike trains and stochastic point processes. II. Simultaneous spike trains. Biophys J. 1967;7:419–440. doi: 10.1016/S0006-3495(67)86597-4. [DOI] [PMC free article] [PubMed] [Google Scholar]
- Peschanski M, Ralston HJ, Roudier F. Reticularis thalami afferents to the ventrobasal complex of the rat thalamus: an electron microscope study. Brain Res. 1983;270:325–329. doi: 10.1016/0006-8993(83)90607-8. [DOI] [PubMed] [Google Scholar]
- Pinto DJ, Brumberg JC, Simons DJ. Circuit dynamics and coding strategies in rodent somatosensory cortex. J Neurophysiol. 2000;83:1158–1166. doi: 10.1152/jn.2000.83.3.1158. [DOI] [PubMed] [Google Scholar]
- Ritt JT, Andermann ML, Moore CI. Embodied information processing: vibrissa mechanics and texture features shape micromotions in actively sensing rats. Neuron. 2008;57:599–613. doi: 10.1016/j.neuron.2007.12.024. [DOI] [PMC free article] [PubMed] [Google Scholar]
- Rouiller EM, Welker E. A comparative analysis of the morphology of corticothalamic projections in mammals. Brain Res Bull. 2000;53:727–741. doi: 10.1016/s0361-9230(00)00364-6. [DOI] [PubMed] [Google Scholar]
- Roy SA, Alloway KD. Coincidence detection or temporal integration? What the neurons in somatosensory cortex are doing. J Neurosci. 2001;21:2462–2473. doi: 10.1523/JNEUROSCI.21-07-02462.2001. [DOI] [PMC free article] [PubMed] [Google Scholar]
- Shoykhet M, Doherty D, Simons DJ. Coding of deflection velocity and amplitude by whisker primary afferent neurons: implications for higher level processing. Somatosens Mot Res. 2000;17:171–180. doi: 10.1080/08990220050020580. [DOI] [PubMed] [Google Scholar]
- Sillito AM, Jones HE. Corticothalamic interactions in the transfer of visual information. Philos Trans R Soc Lond B Biol Sci. 2002;357:1739–1752. doi: 10.1098/rstb.2002.1170. [DOI] [PMC free article] [PubMed] [Google Scholar]
- Sillito AM, Jones HE, Gerstein GL, West DC. Feature-linked synchronization of thalamic relay cell firing induced by feedback from the visual cortex. Nature. 1994;369:479–482. doi: 10.1038/369479a0. [DOI] [PubMed] [Google Scholar]
- Simons DJ. Multi-whisker stimulation and its effects on vibrissa units in rat SmI barrel cortex. Brain Res. 1983;276:178–182. doi: 10.1016/0006-8993(83)90561-9. [DOI] [PubMed] [Google Scholar]
- Simons DJ, Carvell GE. Thalamocortical response transformation in the rat vibrissa/barrel system. J Neurophysiol. 1989;61:311–330. doi: 10.1152/jn.1989.61.2.311. [DOI] [PubMed] [Google Scholar]
- Temereanca S, Simons DJ. Local field potentials and the encoding of whisker deflections by population firing synchrony in thalamic barreloids. J Neurophysiol. 2003;89:2137–2145. doi: 10.1152/jn.00582.2002. [DOI] [PubMed] [Google Scholar]
- Usrey WM, Alonso JM, Reid RC. Synaptic interactions between thalamic inputs to simple cells in cat visual cortex. J Neurosci. 2000;20:5461–5467. doi: 10.1523/JNEUROSCI.20-14-05461.2000. [DOI] [PMC free article] [PubMed] [Google Scholar]
- Veinante P, Deschênes M. Single- and multi-whisker channels in the ascending projections from the principal trigeminal nucleus in the rat. J Neurosci. 1999;19:5085–5095. doi: 10.1523/JNEUROSCI.19-12-05085.1999. [DOI] [PMC free article] [PubMed] [Google Scholar]
- Wilent WB, Contreras D. Synaptic responses to whisker deflections in rat barrel cortex as a function of cortical layer and stimulus intensity. J Neurosci. 2004;24:3985–3998. doi: 10.1523/JNEUROSCI.5782-03.2004. [DOI] [PMC free article] [PubMed] [Google Scholar]
- Wilent WB, Contreras D. Stimulus-dependent changes in spike threshold enhance feature selectivity in rat barrel cortex neurons. J Neurosci. 2005;25:2983–2991. doi: 10.1523/JNEUROSCI.4906-04.2005. [DOI] [PMC free article] [PubMed] [Google Scholar]