Abstract
Computational electromagnetics models of microwave interactions with the human breast serve as an invaluable tool for exploring the feasibility of new technologies and improving design concepts related to microwave breast cancer detection and treatment. In this paper we report the development of a collection of anatomically realistic 3D numerical breast phantoms of varying shape, size, and radiographic density which can be readily used in FDTD computational electromagnetics models. The phantoms are derived from T1-weighted magnetic resonance images (MRIs) of prone patients. Each MRI is transformed into a uniform grid of dielectric properties using several steps. First, the structure of each phantom is identified by applying image processing techniques to the MRI. Next, the voxel intensities of the MRI are converted to frequency-dependent and tissue-dependent dielectric properties of normal breast tissues via a piecewise-linear map. The dielectric properties of normal breast tissue are taken from the recently completed large-scale experimental study of normal breast tissue dielectric properties conducted by the Universities of Wisconsin and Calgary. The comprehensive collection of numerical phantoms is made available to the scientific community through an online repository.
Keywords: Biomedical applications of electromagnetic radiation, Biomedical electromagnetic imaging, Breast cancer detection, Breast cancer treatment, finite-difference time-domain (FDTD) methods, Microwave imaging, Microwave hyperthermia
I. INTRODUCTION
Many candidate microwave techniques for breast cancer detection and treatment applications have been proposed in recent years. The growing interest in microwave breast imaging is evidenced by the increasing number of publications on the topic. In the 1990’s, there were approximately a dozen journal papers related to microwave breast imaging (see, for example, [1]–[4]), whereas between 2000 and the present nearly 100 journal papers have appeared (see, for example, [5] and references therein) with over a quarter of those published last year. The body of work on microwave breast cancer detection is quite diverse, and includes narrowband and wideband inverse scattering or tomographic techniques [6]–[10]; ultrawideband radar and other time-domain techniques such as time reversal [11]–[15]; microwave-induced thermoacoustic tomography [16], [17]; microwave radiometry [18]–[20]; and microwave holography [21]. There is also continuing interest in research and development of microwave therapeutic techniques for the breast, such as microwave-induced hyperthermia and microwave ablation. Numerous technological advancements for treatment and temperature monitoring techniques have been reported recently (see, for example, [22]–[28]).
Research on both diagnostic and therapeutic microwave techniques benefits from anatomically realistic numerical breast phantoms that model structural complexities, tissue heterogeneity, and dispersive dielectric properties. One well-accepted tool used in the investigation of these microwave techniques is a finite-difference time-domain (FDTD) [29] computational electromagnetics model of the breast (referred to here as a numerical breast phantom). To date, most numerical breast phantoms have been limited to anatomically realistic 2D phantoms [7], [13] or relatively simple 3D phantoms [13], [30]. In all of these cases, as well as the few examples of anatomically realistic 3D phantoms [14], [31], the accuracy of the assumed dielectric properties of the various tissues in the breast has been limited by gaps and discrepancies in previously published small-scale experimental dielectric spectroscopy studies. None of these previous phantoms are consistent with the comprehensive findings on normal breast tissue dielectric properties reported recently in the large-scale Wisconsin-Calgary dielectric characterization study [32], [33]. FDTD models of other parts of the human body - namely those that are comprised of well delineated tissue types, each with spatially invariant dielectric properties - are derived from magnetic resonance images (MRIs) with relative ease and are arguably commonplace these days. In contrast, the accurate derivation of numerical breast phantoms from MRIs is a non-trivial and in fact quite involved process due to the complex network of glandular, adipose, and fibroconnective tissue in the breast and the significant heterogeneity of dielectric properties of normal breast tissue, as revealed by the Wisconsin-Calgary study.
In this paper we report for the first time the development of a collection of anatomically and dielectrically realistic 3D numerical breast phantoms of varying shape, size, and radiographic density. The structural heterogeneity of the breast is derived from 3D MRIs of patients with normal breast tissue (no malignancy or other abnormality) while the frequency-dependent and tissue-dependent dielectric properties are derived from the Wisconsin-Calgary study. The primary novel contribution is the introduction of a physiologically realistic method for mapping breast MRI voxel intensity to accurate dielectric properties of normal breast tissue. Our mapping is based on a two-component Gaussian Mixture Model (GMM) [34] and is motivated by the fact that normal breast tissue is composed of two tissue types that are distinctly different in terms of both physiology and dielectric properties. The numerical breast phantoms presented in this paper are not intended to exactly mimic any specific patient’s breast, but rather to serve as representative models of the human breast for use in computational studies. The phantoms will support further development of novel diagnostic and therapeutic microwave techniques for breast cancer detection and treatment, and provide common grounds for comparison among methods.
The rest of the paper is organized as follows. Section II is divided into two parts. Section II-A describes in detail the image processing steps used to construct anatomical models from MRIs. Section II-B discusses the mapping between the voxel intensity of the anatomical models and the dielectric properties of normal breast tissue. Examples of 3D anatomically realistic numerical breast phantoms are illustrated in Section III and are followed by concluding remarks in Section IV.
II. METHOD FOR DEVELOPING A NUMERICAL BREAST PHANTOM
The goal is to create a collection of realistic numerical breast phantoms where the breast tissue is modeled as a uniform grid of spatially dependent dielectric properties. We seek to capture in a representative sense both the structural heterogeneity of normal tissue and the dispersive dielectric properties of normal breast tissue. Structural realism is achieved in the proposed phantoms through the use of 3D breast MRIs while dielectric properties realism is achieved through the use of data from the Wisconsin-Calgary study [32], [33]. The key steps are described below.
A. MRI processing and structural development
The numerical phantoms are derived from T1-weighted MRIs of prone patients. The anonymous breast MRI datasets are obtained from the University of Wisconsin Hospital and Clinics. Each breast MRI is assigned a classification based on the standard tissue composition descriptors used by radiologists to classify X-ray mammograms. The American College of Radiology (ACR) defines four categories of breast composition according to the radiographic density of the breast: (I) almost entirely fat, (II) scattered fibroglandular, (III) heterogeneously dense, and (IV) extremely dense [35]. A series of sagittal slices comprises each 3D MRI. The spacing between slices is typically 1.5 mm but varies from patient to patient. Each sagittal slice contains 256 × 256 pixels. The field-of-view for a sagittal slice varies from patient to patient depending on breast size, but for a typical field-of-view of 16 cm × 16 cm, the MRI voxel size is 0.625 mm × 0.625 mm × 1.5 mm. Several image processing steps are applied to the original MRIs to remove image artifacts and to automate the structural development of the numerical phantoms.
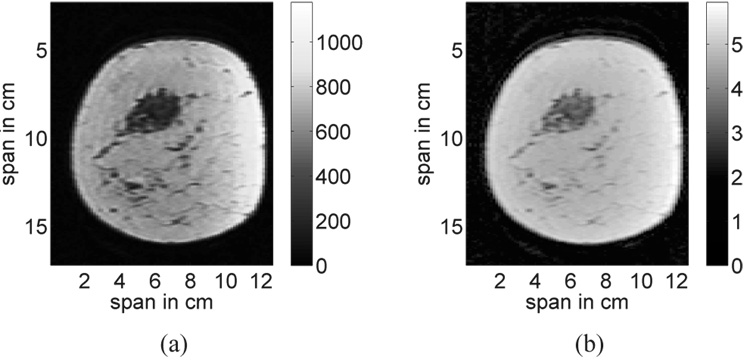
The first step in the structural development of the phantoms is to reduce the dominant artifact in the breast MRI. Non-uniformity of the magnetic fields leads to slowly varying intensity gradients in the image, particularly in the tissue region near the coils. This image artifact is illustrated in Fig. 1(a) for a coronal slice through the 3D image. A homomorphic filter [36] is applied to the MRI to mitigate these effects by filtering out the low-frequency spatial variations in the image. Figure 1(b) shows the same coronal slice after homomorphic filtering.
Fig. 1.
A coronal slice from a 3D MRI of the breast (a) before, and (b) after homomorphic filtering is applied to reduce the slowly varying gradient artifact. The color bars represent MRI voxel intensity before and after filtering.
Next, the MRI is linearly interpolated to achieve a 3D grid of 0.5-mm cubic voxels while preserving the physical dimensions of all structures in the MRI. The grid cell size of 0.5 mm × 0.5 mm × 0.5 mm is chosen to satisfy the grid resolution requirements for FDTD computational electromagnetics modeling in the microwave frequency range. For example, at 10 GHz, this grid cell size corresponds to a sampling density of approximately 10 points per wavelength in those grid cells containing the densest tissue properties (which, for the phantoms discussed in this paper, correspond to glandular/fibroconnective tissue, with peak values of εr = 52.64, σ = 14.97, λ = 4 mm).
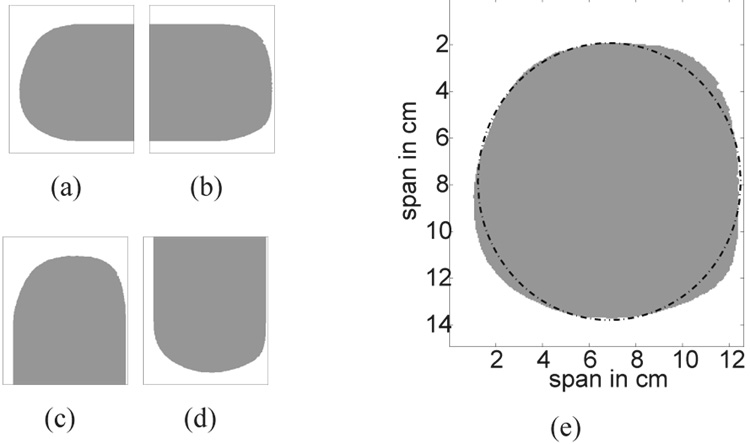
The breast volume is then segmented from the background by applying an edge finding algorithm to each coronal slice of the interpolated 3D image. Each coronal slice is treated as a 2D matrix where the matrix elements are the MRI voxel intensities. We traverse each line in the matrix (either a row or column) in four directions: left to right, right to left, top to bottom, and bottom to top. For each direction of traversal, we create a logical mask - a matrix containing 1’s and 0’s. For example, while traversing each row of the coronal slice shown in Fig. 1(b) from left to right, each matrix element in the logical mask is set to zero until a voxel intensity in the coronal slice is found to exceed a specified threshold; the threshold value is usually chosen to be the voxel intensity close to that of the skin or the subcutaneous fat layer near the skin contour. The remaining matrix entries along that row are set to one. The resulting logical mask is shown in Fig. 2(a). An analogous procedure is used to create the three other logical masks shown in Figs. 2(b), 2(c), and 2(d). The four masks are combined using element-by-element matrix multiplication to produce a coronal composite mask that is used to segment the breast interior from the background. The coronal composite mask of the coronal slice shown in Fig. 1(b) is shown as the shaded area in Fig. 2(e).
Fig. 2.
Breast segmentation masks which result from traversing the coronal slice shown in Fig. 1(b) from (a) left to right, (b) right to left, (c) top to bottom and, (d) bottom to top. (e) The resulting coronal composite mask and its best-fit ellipse. White and gray areas represent matrix elements that are set to 0 and 1, respectively.
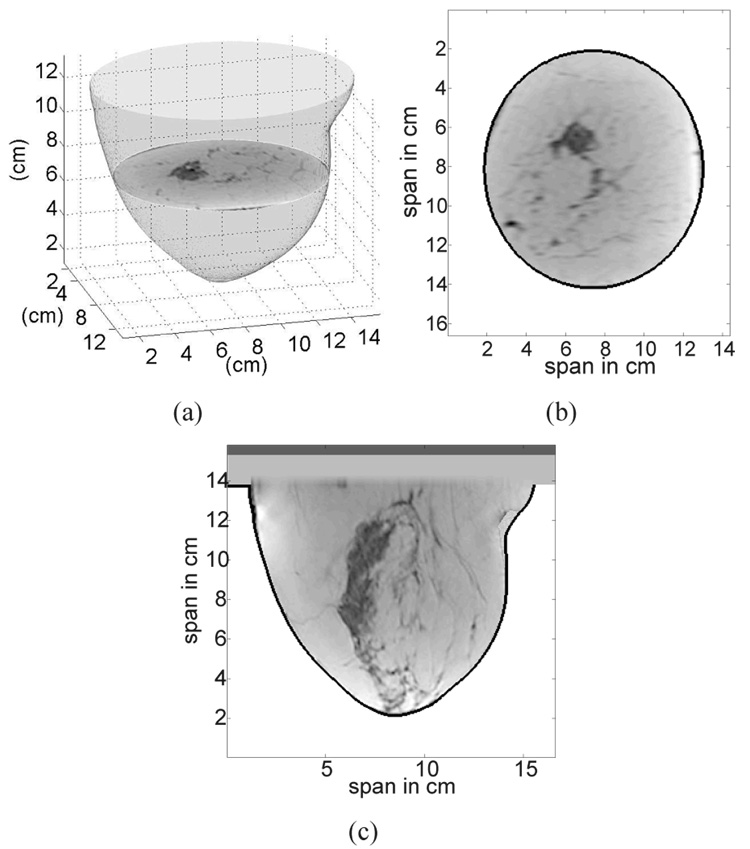
The segmentation works particularly well on coronal slices where there is a well-defined contrast between the MRI voxel intensity of the tissue and the background region. However imperfections still arise in the coronal composite masks. For example, the coronal composite mask in Fig. 2(e) does not have a smooth edge. Such roughness, which is non-physical and may lead to unrealistic scattering, is eliminated by fitting each coronal composite mask with an ellipse to ensure smooth contours on the 3D phantom. An example of a best-fit ellipse for a coronal composite mask is plotted in Fig. 2(e) as a dashed-dotted line. The ellipse is fit to boundary points of the previously identified coronal composite mask using a penalized least-squares criterion to select the coordinates of the center of the ellipse and the major and minor axes that minimize the penalized error. The penalty function is chosen to give preference to ellipses whose contours fall on or inside the segmented tissue region and to discourage those extending beyond the segmented tissue region and into the background region. The selected ellipses, one from each coronal slice, are stacked to form a smooth 3D breast surface as illustrated in Fig. 3(a). The breast interior is now defined by the volume enclosed by the smooth breast surface.
Fig. 3.
Illustration of a 3D anatomical breast model created from a 3D MRI. (a) Smooth 3D surface of the breast formed by stacking the best-fit ellipses from each coronal slice. (b) Coronal view of the 3D anatomical model. (c) Sagittal view of the 3D anatomical model. In (b) and (c) the skin layer is identified by the black contour.
The skin is usually not imaged with high fidelity and is mostly eliminated during segmentation. Hence, a 1.5-mm-thick skin layer is artificially introduced into the model by performing image erosion [37] on the previously obtained smooth breast surface. The thickness of the skin layer is chosen to be the average value of breast skin thickness reported in [38]. Finally, the breast interior region comprises all voxels contained within the 3D breast surface after image erosion is performed. The skin region comprises all the voxels contained between the surfaces before and after erosion. A 1.5-cm-thick subcutaneous fat layer and a 0.5-cm-thick muscle chest wall are introduced at the base of the breast to complete the structural development of the model. The chosen thickness of the subcutaneous fat layer represents the average thickness from 35 MRI datasets; this parameter can be easily adjusted to account for more or less fat on the chest wall. Figures 3(b) and 3(c) show coronal and sagittal slices of the resulting 3D anatomical model.
B. Dielectric properties mapping
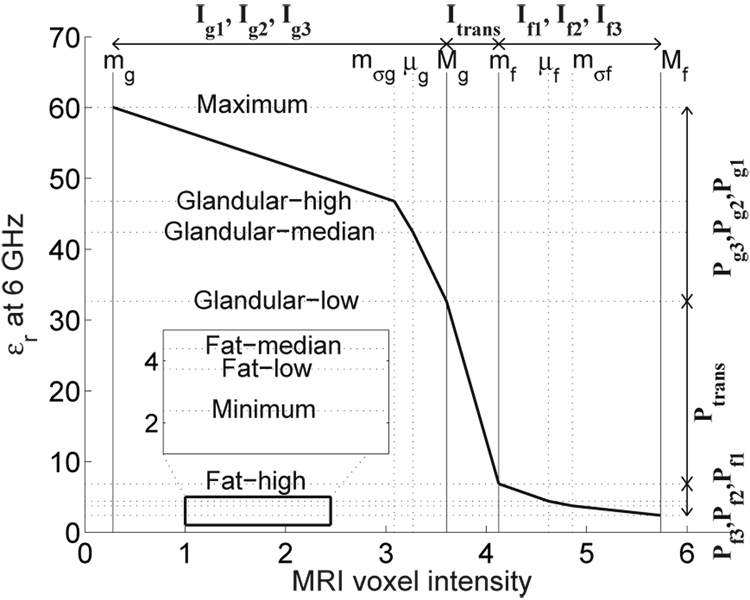
The voxel intensities within the 3D anatomical model are transformed into dielectric properties via a piecewise-linear map. An example of a piecewise-linear mapping between MRI voxel intensity and dielectric properties is illustrated in Fig. 4. The piecewise-linear map provides the necessary flexibility to account for the facts that a) the MRI voxel intensities of fatty and fibroconnective/glandular tissue tend to exhibit bimodal distributions, and b) while the the dielectric properties of normal breast tissue in the microwave regime span a wide and continuous range of values, they too are clustered based on tissue type.
Fig. 4.
A representative piecewise-linear map illustrating the linear mapping between seven intervals along the MRI voxel intensity axis (Ig1, Ig2, Itrans, If1, If2, If3) and seven intervals along the dielectric properties axis (Pg1, Pg2, Ptrans, Pf1, Pf2, Pf3). The MRI in this example is of a patient with extremely dense breast tissue.
Our mapping between MRI voxel intensity and dielectric properties consists of seven linear segments, each corresponding to a specific tissue category. We define the seven tissue categories as follows: glandular/fibroconnective-1, glandular/fibroconnective-2, glandular/fibroconnective-3, transitional, fatty-1, fatty-2, and fatty-3. Our decision to use seven categories was motivated by the format of the dielectric properties data reported in the Wisconsin-Calgary study. A minimum of three categories is needed to account for physiological heterogeneity in the breast. The use of seven linear segments, instead of three, provides greater flexibility in capturing the dielectric heterogeneity reported in [32], [33]. The corresponding voxel intensity intervals are denoted as Ig1, Ig2, Ig3, Itrans, If1, If2, and If3. Similarly, the dielectric properties intervals are denoted as Pg1, Pg2, Pg3, Ptrans, Pf1, Pf2, and Pf3. The range of intensity values for each I is linearly mapped to the corresponding properties range for each P, as illustrated in Fig. 4. The next subsection describes our procedure for identifying the intensity intervals for each tissue category. The second subsection describes the procedure for assigning ranges of dielectric properties to each properties interval.
1) The seven intervals of MRI voxel intensity
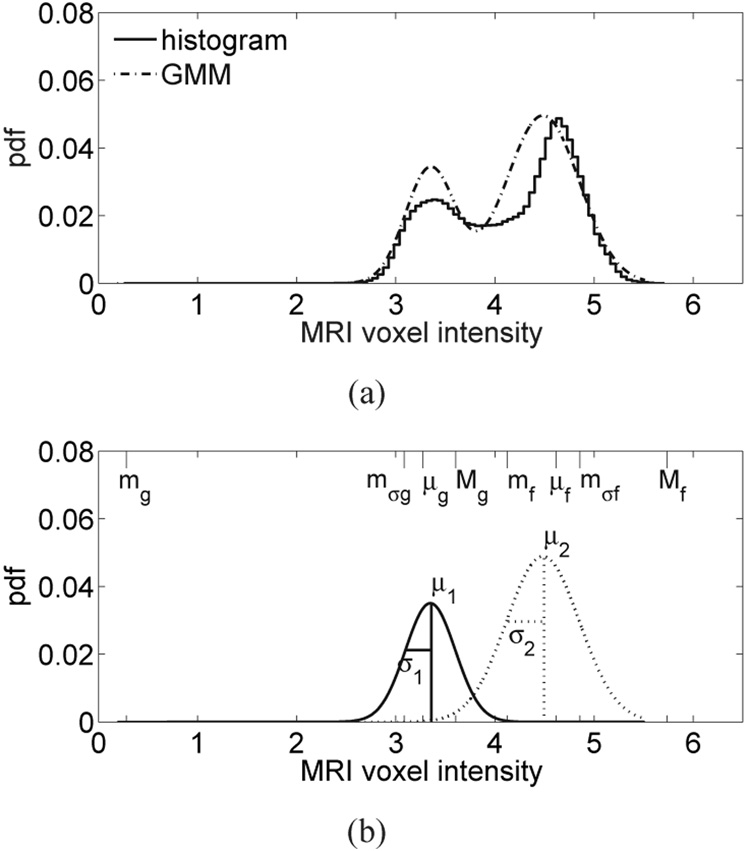
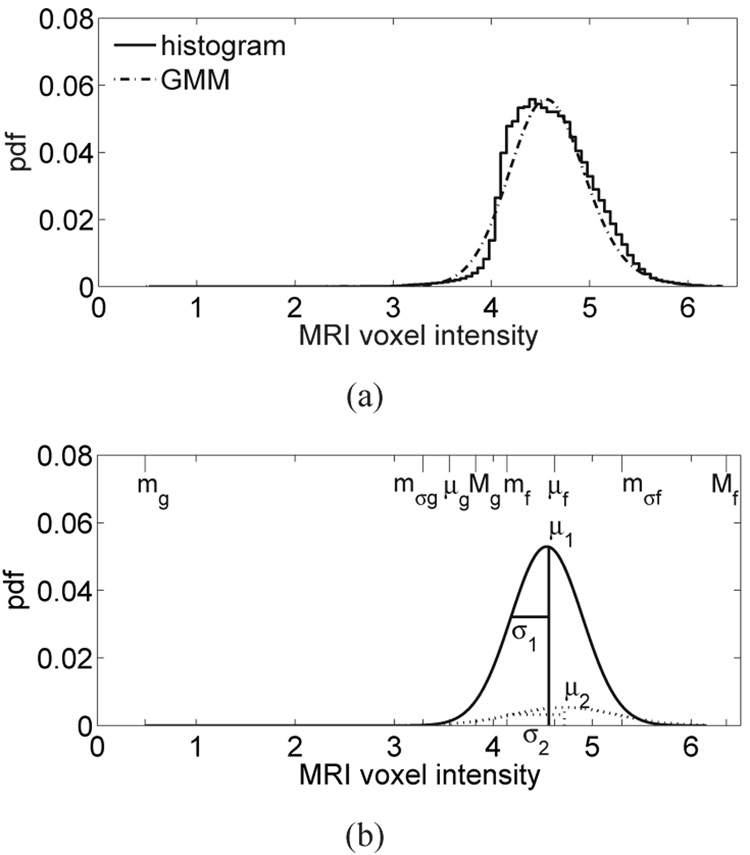
The upper- and lower-bounds of the seven intervals of MRI voxel intensity are given by the eight piecewise-linear mapping parameters labeled in Fig. 4 (mg, mσg, μg, Mg, mf, μf, mσf, and Mf). These parameters are found by first fitting the histogram of MRI voxel intensities from the breast interior with a two-component Gaussian mixture model (GMM) [34]. Higher voxel intensities in the T1-weighted MRI correspond to fatty tissue while lower voxel intensities correspond to glandular/fibroconnective tissue. Each component of the GMM represents an MRI intensity region corresponding to either glandular/fibroconnective or fatty tissue [39]. The probability density function (pdf) for the two-component GMM is represented as , where fi(x; a, b), i = 1, 2 is the Gaussian pdf of the ith GMM component with mean a and variance b. The six distribution parameters are estimated using the method proposed in [34]. Examples of normalized histograms and their two-component GMM are shown in Fig. 5(a) and Fig. 6(a) for patients with extremely dense breast tissue and almost entirely fat breast tissue, respectively. Figure 5(b) and Figure 6(b) each show the two individual Gaussian components of the GMM and their mean (μ) and standard deviation (σ).
Fig. 5.
(a) Histogram of MRI voxel intensities for a patient with extremely dense breast tissue, and the composite two-component GMM of the histogram. (b) The two individual components of the GMM corresponding to fatty tissue (dashed) and glandular/fibroconnective tissue (solid). Each component is labeled with its GMM parameters. The eight piecewise-linear mapping parameters are indicated along the MRI voxel intensity axis (top edge).
Fig. 6.
(a) Histogram of MRI voxel intensities for a patient with almost entirely fat breast tissue, and the composite two-component GMM of the histogram. (b) The two individual components of the GMM are shown with dashed and solid lines. Each component is labeled with its GMM parameters. The eight piecewise-linear mapping parameters are indicated along the MRI voxel intensity axis (top edge).
With the exception of breast compositions that are almost entirely fat, we have found the two Gaussians to be well separated, as illustrated in Fig. 5. When the breast is almost entirely fat, there are very few voxels with low intensities (glandular/fibroconnective tissue voxels) and the two Gaussian components are both fit to the dominant peak in the fatty tissue region, as illustrated in Fig. 6.
The eight piecewise-linear mapping parameters are defined from the distribution parameters of the GMM. We define the minimum, intermediate, mean, and maximum voxel intensities as mg, mσg, μg, and Mg, respectively, for glandular/fibroconnective tissue and mf, mσf, μf, and Mf, respectively, for fatty tissue. The eight piecewise-linear mapping parameters are indicated along the MRI voxel intensity axis in Fig. 5(b) and Fig. 6(b) for patients with extremely dense breast tissue and almost entirely fat breast tissue, respectively. We summarize the relationship between the piecewise-linear mapping parameters and the GMM distribution parameters (shown in Fig. 5(b) and Fig. 6(b)) below.
For the case where the two Gaussians are well separated, as in the extremely dense case of Fig. 5, the upper bound of the glandular/fibroconnective region (Mg) is defined as an intensity value that is one standard deviation above the mean μ1, while the lower bound of the same region (mg) is the lowest voxel intensity value in the image. Conversely, the lower bound of the fatty region (mf) is defined as an intensity that is one standard deviation below μ2, while the upper bound of the region (Mf) is defined as the highest voxel intensity value in the image. For both the glandular/fibroconnective and fatty regions, the mean (μg or μf) is calculated as the expected value of the voxel intensity using the GMM for that region. We define the intermediate voxel intensity as an intensity that is one standard deviation above μ2 for the fatty region (mσf) and as an intensity that is one standard deviation below μ1 for the glandular/fibroconnective region (mσg).
For the case where the two Gaussians are not well separated, as in the almost entirely fat case of Fig. 6, the upper bound of the glandular/fibroconnective region (Mg) is separated from the fatty region by a user-defined positive scalar, δ. The intermediate voxel intensity for the glandular/fibroconnective region (mσg) is defined as an intensity that is Mg − μg below the mean voxel intensity of the glandular/fibroconnective region (μg). The other piecewise-linear mapping parameters (mg, μg, mf, Mf, and μf) are defined as in the preceding case. Hence, the eight piecewise-linear mapping parameters are selected as follows. Let X be the set of voxel intensities in the breast interior; then
| (1) |
| (2) |
| (3) |
| (4) |
| (5) |
| (6) |
| (7) |
| (8) |
The eight piecewise-linear mapping parameters are used to specify the voxel intensity intervals corresponding to the seven tissue categories as Ig1 = (mg, mσg), Ig2 = (mσg, μg), Ig3 = (μg, Mg), Itrans = (Mg, mf), If1 = (mf, μf), If2 = (μf, mσf), and If3 = (mσf, Mf).
2) Dielectric properties assignment
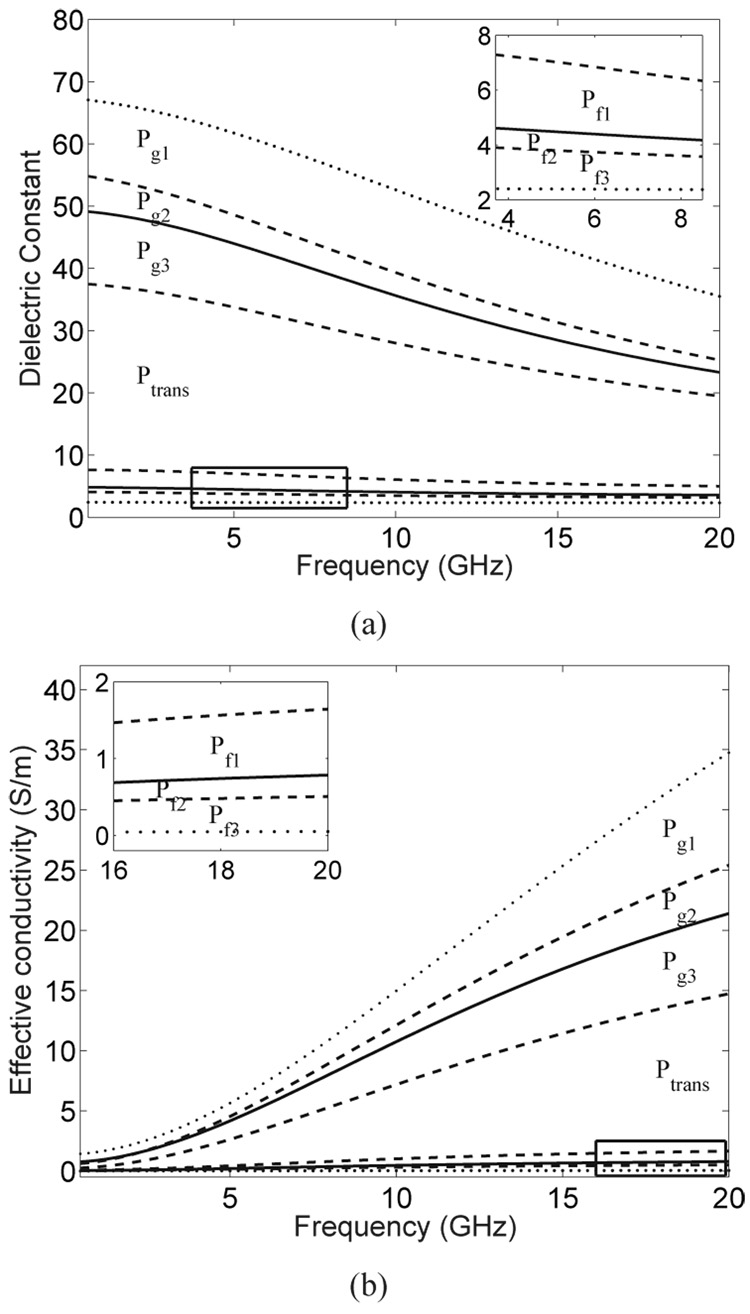
Each of the seven MRI voxel intensity intervals is linearly mapped to an appropriate range of normal breast tissue dielectric properties. The seven ranges of dielectric properties are defined by the eight wideband dielectric properties curves shown in Fig. 7. An example of the eight bounding dielectric constant values evaluated at 6 GHz is illustrated in the graph in Fig. 4, wherein the bounding values are labeled as maximum, glandular-high, glandular-median, glandular-low, fat-high, fat-median, fat-low, and minimum. The curves in Fig. 7 are derived from the 0.5–20 GHz results reported in [32], [33] as follows:
The maximum and minimum curves (dotted) are the upper and lower bounds, respectively, of the frequency-dependent dielectric properties data presented in [32]. The lower dotted curve corresponds to the dielectric properties of lipids measured in our laboratory, while the upper dotted curve corresponds to the frequency-by-frequency maximum dielectric properties (envelope) of all the curves shown in Fig. 8 of [32].
The solid curves are the median dielectric properties curves associated with the adipose-defined tissue group 1 and 3 reported in [32], [33]. We refer to these two curves as “glandular-median” and “fat-median” curves.
The two pairs of dashed curves are the 25th and 75th percentile dielectric properties curves for tissue groups 1 and 3 reported in [32], [33]. We refer to these curves as “glandular-low” (25th percentile, group 1), “glandular-high” (75th percentile, group 1), “fat-low” (25th percentile, group 3), and “fat-high” (75th percentile, group 3).
Fig. 7.
(a) Wideband dielectric constant and (b) effective conductivity curves that define the bounds on seven ranges of dielectric properties. The range labels (Pg1, Pg2, Pg3, Ptrans, Pf1, Pf2, and Pf3) correspond to seven tissue categories. The two dotted curves represent the maximum and minimum tissue properties. The two solid curves represent the median properties of predominantly glandular/fibroconnective tissue and predominantly fatty tissue. The two pairs of dashed curves represent the 25th and 75th percentile properties for predominantly glandular/fibroconnective tissue and predominantly fatty tissue. The Cole-Cole parameters for these eight curves are given in Table I.
Fig. 8.
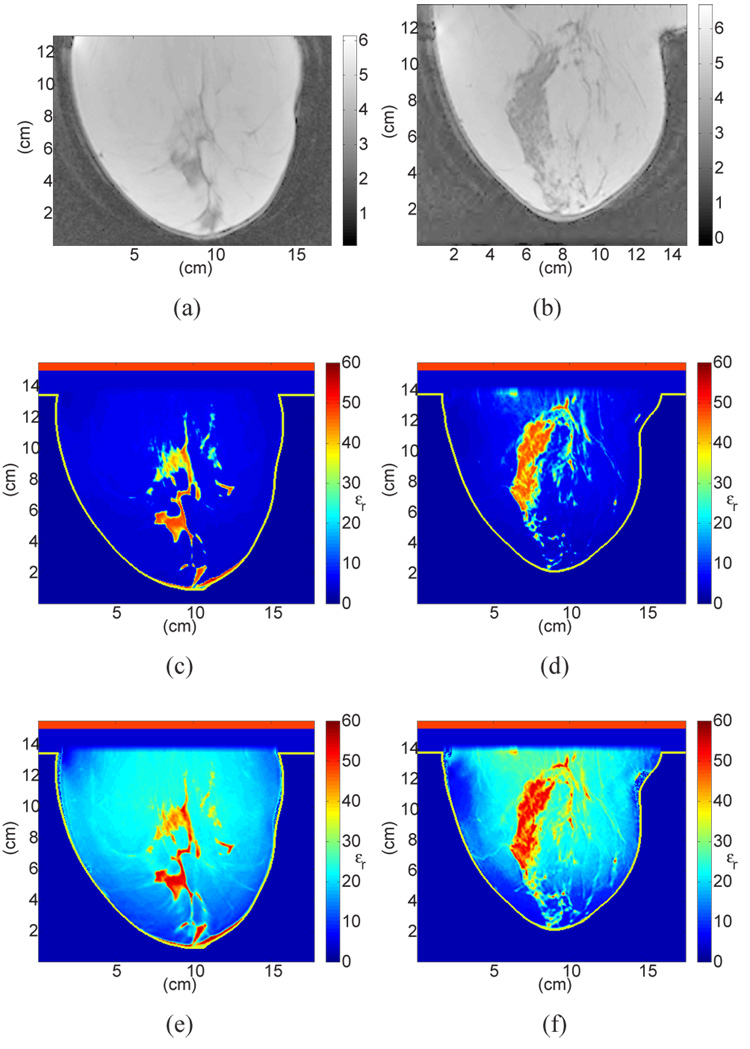
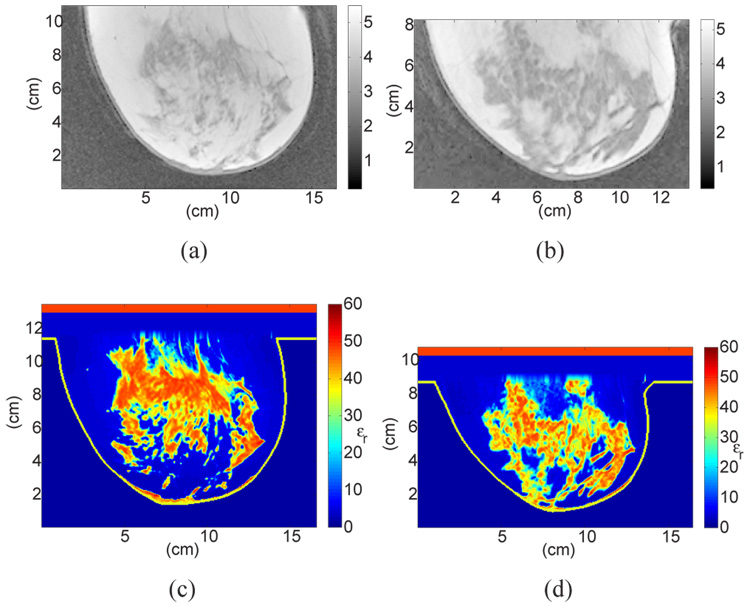
Sagittal cross-sections showing MRI voxel intensity for patients with (a) almost entirely fat breast tissue (ACR I) and (b) scattered fibroglandular breast tissue (ACR II), with the corresponding cross-sections of the 3D numerical breast phantoms showing the dielectric constant at 6 GHz. The two phantoms in (c) and (d) (shown in color) were derived from (a) and (b) respectively, using the GMM-based piecewise-linear mapping scheme proposed in this paper. The two phantoms in (e) and (f) (shown in color) were derived from (a) and (b) using a uniform mapping scheme.
The eight wideband dielectric properties curves are used to specify the dielectric properties intervals as Pf3 = (minimum,fat-low), Pf2 = (fat-low,fat-median), Pf1 = (fat-median,fat-high), Ptrans = (fat-high,glandular-low), Pg3 = (glandular-low,glandular-median), Pg2 = (glandular-median,glandular-high), and Pg1 = (glandular-high, maximum).
Single-pole Cole-Cole parameters for the eight curves in Fig. 7 are summarized in Table I. While these Cole-Cole models provide a compact, general representation of the dispersive dielectric properties of breast tissue, they are not easily incorporated into wideband FDTD simulations. The Cole-Cole models can be replaced by other dispersion models suitable for use in FDTD computations. For example, a simple Debye model has been shown to accurately capture the frequency dependence of these properties in the microwave frequency range [40]. As dictated by the piecewise-linear map, the dielectric properties values themselves (in the case of a single-frequency simulation) or the appropriate dispersion model parameters (in the case of a wideband simulation) for a specific voxel in the breast interior are computed as a weighted average of the upper- and lower-bound dielectric properties curves for the tissue category into which the MRI voxel intensity falls. In summary, the voxel intensities within the glandular/fibroconnective region, Ig1, Ig2, and Ig3, are mapped to dielectric properties Pg1, Pg2, Pg3; voxel intensities within the fatty region, If1, If2, and If3, are mapped to dielectric properties Pf1, Pf2, Pf3; and voxel intensities within the transitional region, Itrans, are mapped to dielectric properties Ptrans.
TABLE I.
Single-Pole Cole-Cole Parameters for the Eight Wideband Dielectric Properties Curves.
| ε∞ | Δε | τ (ps) | α | σs (S/m) | |
|---|---|---|---|---|---|
| maximum | 1.000 | 66.31 | 7.585 | 0.063 | 1.370 |
| glandular-high | 6.151 | 48.26 | 10.26 | 0.049 | 0.809 |
| glandular-median | 7.821 | 41.48 | 10.66 | 0.047 | 0.713 |
| glandular-low | 9.941 | 26.60 | 10.90 | 0.003 | 0.462 |
| fat-high | 4.031 | 3.654 | 14.12 | 0.055 | 0.083 |
| fat-median | 3.140 | 1.708 | 14.65 | 0.061 | 0.036 |
| fat-low | 2.908 | 1.200 | 16.88 | 0.069 | 0.020 |
| minimum | 2.293 | 0.141 | 16.40 | 0.251 | 0.002 |
III. EXAMPLES
We provide examples of four anatomically realistic numerical breast phantoms with realistic wideband dielectric properties of normal breast tissue. Each phantom is derived from a representative MRI from each of the four ACR classifications. Since there exists no standard procedure for classifying MR images into the four categories, for the purpose of our research we adopt a procedure to classify a numerical phantom according to its relative tissue composition based on the parameters of the GMM. We classify a phantom into one of the four categories based on the probability of a voxel being assigned to fatty tissue, . Phantoms with a relatively large proportion of fatty tissue (smaller proportion of glandular/fibroconnective and transitional tissues) are assigned to ACR categories I or II, while phantoms with a smaller proportion of fatty tissue (larger proportion of glandular/fibroconnective and transitional tissues) are assigned to ACR categories III or IV. We use the following rules to classify a phantom into a tissue composition category C:
| (9) |
The four examples are illustrated in Fig. 8 and Fig. 9. Figure 8(a),8(b) and Figure 9(a),9(b) show sagittal cross-sections of MRIs classified as ACR I, II, III, and IV, respectively. Figure 8(c),8(d) and Figure 9(c),9(d) show the corresponding cross-sections of the phantoms derived using the GMM-based piecewise-linear mapping scheme proposed in this paper. The dielectric constant at 6 GHz is displayed in all phantom images. To illustrate the importance of the piecewise-linear map, we include in Fig. 8 two phantoms derived with an alternative mapping scheme applied to the latest dielectric properties data - namely the uniform mapping between MRI voxel intensities and dielectric properties that has been adopted previously (see, for example, [13], [14]). A comparison between Figs. 8(c),8(d) with Figs. 8(e),8(f) indicates that uniform mapping scheme introduces artificially high dielectric properties in the fatty tissue region of the breast while the piecewise-linear mapping avoids this error and preserves breast physiology. The erroneously high dielectric properties values assigned to fat in Figs. 8(e),8(f) increase the microwave attenuation throughout the breast and decrease the effective heterogeneity of the phantom by reducing the electromagnetic contrast between glandular and fatty tissue types.
Fig. 9.
Sagittal cross-sections showing MRI voxel intensity for patients with (a) heterogeneously dense breast tissue (ACR III), and (b) extremely dense breast tissue (ACR IV), with the corresponding cross-sections of the 3D numerical breast phantoms showing the dielectric constant at 6 GHz. The phantoms in (c) and (d) (shown in color) were derived from (a) and (b), respectively, using the GMM-based piecewise-linear mapping scheme proposed in this paper.
The phantoms can be readily used in FDTD simulations conducted at microwave frequencies. We fit the Cole-Cole models described in Section II-B2 with single-pole Debye dispersion models over the 3 to 10 GHz frequency band. The frequency range chosen for this example is of specific interest because it coincides with FCC band allocated for ultrawideband applications. The MRI voxel intensities are then mapped to the Debye parameters using the procedure described in Section II-B. A set of Debye parameters appropriate for the illustrative frequency range of 3–10 GHz is listed in Table II.
TABLE II.
Single-Pole Debye Parameters (3–10 GHz) for the Eight Wideband Dielectric Properties Curves.
| ε∞ | Δε | τ (ps) | σs (S/m) | |
|---|---|---|---|---|
| maximum | 23.2008 | 46.0517 | 13.0000 | 1.3057 |
| glandular-high | 14.2770 | 40.5152 | 13.0000 | 0.6381 |
| glandular-median | 13.8053 | 35.5457 | 13.0000 | 0.7384 |
| glandular-low | 12.8485 | 24.6430 | 13.0000 | 0.2514 |
| fat-high | 3.9870 | 3.5448 | 13.0000 | 0.0803 |
| fat-median | 3.1161 | 1.5916 | 13.0000 | 0.0496 |
| fat-low | 2.8480 | 1.1041 | 13.0000 | 0.2514 |
| minimum | 2.3086 | 0.0918 | 13.0000 | 0.0048 |
This paper has focused on the treatment of the dielectric properties of normal breast tissue inside the breast phantom. The dielectric properties of skin and muscle are well known in the microwave frequency range, and can be selected from reliable databases such as that provided by Gabriel et al [41] and assigned to the skin and chest wall regions of the phantoms in a straightforward manner. Synthetic lesions, such as the malignant and benign lesion models reported in [42], can be superimposed onto the normal breast phantoms reported here. Cole-Cole models representing the frequency-dependent dielectric properties of malignant breast tissue are reported in [33].
IV. SUMMARY
We have developed anatomically realistic numerical breast phantoms based on T1-weighted MRIs of prone patients. The 3D MRIs are transformed into high-resolution dielectric grids using a piecewise-linear mapping approach between MRI voxel intensity and dielectric properties. Recently reported dielectric properties of normal breast tissues in the microwave frequency range are incorporated into the numerical breast phantoms. The result is a set of phantoms that captures the heterogeneity and range of microwave dielectric properties expected in women. We have also introduced a breast composition classification scheme based on the tissue composition of each phantom. An online repository containing a comprehensive collection of anatomically realistic numerical breast phantoms as well as detailed instructions is accessible through our research group website: http://uwcem.ece.wisc.edu/.
ACKNOWLEDGMENTS
The authors would like to acknowledge the technical assistance of the University of Wisconsin Hospital and Clinics radiology staff in acquiring the MRIs and Henri Tandradinata for his contributions in the early-stage development of the numerical breast phantoms.
This work was supported by the National Science Foundation under grant CBET 0201880, the National Science Foundation under a Graduate Research Fellowship, and the National Institutes of Health under grant R01 CA112398 awarded by the National Cancer Institute.
Biographies
Earl Zastrow (S’03) received the B.S and M.S. degrees from the University of Wisconsin – Madison in 2003 and 2005, both in Electrical Engineering. She is currently working towards the Ph.D. degree in Electrical Engineering at the University of Wisconsin – Madison. Her research interests include microwave imaging, and bioelectromagnetics including hyperthermia treatment of breast and brain cancer as well as the interactions between electromagnetic waves and biological tissues. She was the recipient of a 2007 Qualcomm ”Q” Awards of Excellence Scholarship.
Shakti K. Davis (S’92-M’06) received the B.S. degree from New Mexico State University in 1999 and the M.S. and Ph.D degrees from the University of Wisconsin – Madison in 2001 and 2006, all in electrical engineering. She was the recipient of an NIH predoctoral fellowship and was selected for the AT&T Labs Fellowship Program and the Graduate Engineering Research Scholars program. Since September 2006, Dr. Davis has been with the MIT Lincoln Laboratory. Her research interests include array signal processing and its biomedical applications.
Mariya Lazebnik (S’00) received the B.S. degree (with highest honors) from the University of Illinois at Urbana-Champaign in May 2003, and the M.S. degree from the University of Wisconsin at Madison in May 2005, both in Electrical Engineering. She is currently working towards the Ph.D. degree in Electrical Engineering at the University of Wisconsin - Madison. Her research interests include dielectric properties of biological tissues and other heterogeneous media, as well as the interactions between electromagnetic waves and biological tissues.
Ms. Lazebnik was the recipient of a 2003 – 2008 National Science Foundation (NSF) Graduate Research Fellowship, a 2003 IEEE Microwave Theory and Techniques Society (MTT-S) Pre-Graduate Scholarship, a 2005 IEEE MTT-S Graduate Fellowship, a 2007 IEEE Antennas and Propagation Society (AP-S) Graduate Scholarship, a 2007 University of Wisconsin - Madison College of Engineering Bollinger Student Support Fund Scholarship, and a 2007–2008 American Association of University Women Selected Professions Engineering Dissertation Fellowship.
Frederick Kelcz received his PhD in Physics at the University of Wisconsin, Madison, specializing in Medical Physics. He began his research career in MR and CT applications at Columbia Presbyterian Medical Center where he worked for four years prior to entering the University of Miami School of Medicine, where he received his MD. After internship and residency at the University of Minnesota, Dr. Kelcz returned to the University of Wisconsin where he pursued a Fellowship in Abdominal Imaging. Dr. Kelcz was then offered a faculty appointment and has stayed at the University of Wisconsin since, where he is now an Associate Professor of Radiology. He developed the Breast MRI program at UW Hospital and continues to pursue advanced breast MRI methods such as diffusion weighted imaging and spectroscopy.
Barry D. Van Veen (S’81-M’86-SM’97-F’02) was born in Green Bay, WI. He received the B.S. degree from Michigan Technological University in 1983 and the Ph.D. degree from the University of Colorado in 1986, both in electrical engineering. He was an ONR Fellow while working on the Ph.D. degree.
In the spring of 1987 he was with the Department of Electrical and Computer Engineering at the University of Colorado-Boulder. Since August of 1987 he has been with the Department of Electrical and Computer Engineering at the University of Wisconsin-Madison and currently holds the rank of Professor. His research interests include signal processing for sensor arrays and biomedical applications of signal processing.
Dr. Van Veen was a recipient of a 1989 Presidential Young Investigator Award from the National Science Foundation and a 1990 IEEE Signal Processing Society Paper Award. He served as an associate editor for the IEEE Transactions on Signal Processing and on the IEEE Signal Processing Society’s Statistical Signal and Array Processing Technical Committee and the Sensor Array and Multichannel Technical Committee. He is a Fellow of the IEEE and received the Holdridge Teaching Excellence Award from the ECE Department at the niversity of Wisconsin in 1997. He coauthored ”Signals and Systems,” (1st Ed. 1999, 2nd Ed., 2003 Wiley) with Simon Haykin.
Susan C. Hagness (S’91-M’98-SM’04) received the B.S. degree with highest honors and the Ph.D. degree in electrical engineering from Northwestern University, Evanston, IL in 1993 and 1998, respectively. While pursuing the Ph.D. degree, she was a National Science Foundation (NSF) Graduate Fellow and a Tau Beta Pi Spencer Fellow.
Since August 1998, she has been with the Department of Electrical and Computer Engineering at the University of Wisconsin-Madison, where she currently holds the rank of Professor. She is also a faculty affiliate of the Department of Biomedical Engineering. Her bioelectromagnetics research interests include microwave imaging, sensing, and thermal therapy techniques including breast cancer detection and treatment, ultrawideband radar, dielectric spectroscopy, time-domain inverse scattering, and FDTD theory and applications in biology and medicine.
Dr. Hagness served as an elected member of the IEEE Antennas and Propagation Society (AP-S) Administrative Committee from 2003 to 2005 and as an Associate Editor for the IEEE Antennas and Wireless Propagation Letters from 2002 to 2007. She is currently serving as a Member-at-Large of the United States National Committee (USNC) of the International Union of Radio Science (URSI), Vice-Chair of Commission K of USNC-URSI, and Chair of the IEEE AP-S New Technologies Committee. She was the recipient of the Presidential Early Career Award for Scientists and Engineers presented by the White House in 2000. In 2002, she was named one of the 100 top young innovators in science and engineering in the world by the Massachusetts Institute of Technology (MIT) Technology Review magazine. She is also the recipient of theUniversity of Wisconsin Emil Steiger Distinguished Teaching Award (2003), the IEEE Engineering in Medicine and Biology Society Early Career Achievement Award (2004), the URSI Isaac Koga Gold Medal (2005), the IEEE Transactions on Biomedical Engineering Outstanding Paper Award (2007), and the IEEE Education Society’s Mac E. Van Valkenburg Early Career Teaching Award (2007).
Footnotes
Personal use of this material is permitted. However, permission to use this material for any other purposes must be obtained from the IEEE by sending an email to pubs-permissions@ieee.org.
REFERENCES
- 1.Bocquet B, van de Velde JC, Mamouni A, Leroy Y, Giaux R, Delannoy J, Delvalee D. Microwave radiometric imaging at 3-GHz for the exploration of breast tumors. IEEE Trans. Microwave Theory Tech. 1990;vol. 38(no 6):791–793. [Google Scholar]
- 2.Hagness SC, Taflove A, Bridges JE. Two-dimensional FDTD analysis of a pulsed microwave confocal system for breast cancer detection: Fixed-focus and antenna-array sensors. IEEE Trans. Biomed. Eng. 1998;vol. 45(no 12):1470–1478. doi: 10.1109/10.730440. [DOI] [PubMed] [Google Scholar]
- 3.Kruger RA, Kopecky KK, Aisen AM, Reinecke DR, Kruger GA, Kiser WL., Jr Thermoacoustic CT with radio waves: A medical imaging paradigm. Radiology. 1999;vol. 211:275–278. doi: 10.1148/radiology.211.1.r99ap05275. [DOI] [PubMed] [Google Scholar]
- 4.Meaney PM, Paulsen KD, Chang JT, Fanning MW, Hartov A. Nonactive antenna compensation for fixed-array microwave imaging: Part II - Imaging results. IEEE Trans. Med. Imag. 1999;vol. 18(no 6):508–518. doi: 10.1109/42.781016. [DOI] [PubMed] [Google Scholar]
- 5.Fear EC. Microwave imaging of the breast. Tech. Cancer Res. Treatment. 2005;vol. 4(no 1):69–82. doi: 10.1177/153303460500400110. [DOI] [PubMed] [Google Scholar]
- 6.Meaney P, Fanning MW, Raynolds T, Fox CJ, Fang Q, Kogel CA, Poplack SP, Paulsen KD. Initial clinical experience with microwave breast imaging in women with normal mammography. Acad. Radiol. 2007;vol. 14(no 2):207–218. doi: 10.1016/j.acra.2006.10.016. [DOI] [PMC free article] [PubMed] [Google Scholar]
- 7.Winters DW, Bond EJ, Van Veen BD, Hagness SC. Estimation of the frequency-dependent average dielectric properties of breast tissue using a time-domain inverse scattering technique. IEEE Trans. Antennas Propagat. 2006;vol. 54(no 11):3517–3528. [Google Scholar]
- 8.Fhager A, Hashemzadeh P, Persson M. Reconstruction quality and spectral content of an electromagnetic time-domain inversion algorithm. IEEE Trans. Biomed. Eng. 2006;vol. 53(no 8):1594–1604. doi: 10.1109/TBME.2006.878079. [DOI] [PubMed] [Google Scholar]
- 9.Jiang HB, Li CQ, Pearlstone D, Fajardo LL. Ultrasound-guided microwave imaging of breast cancer: Tissue phantom and pilot clinical experiments. Med. Phys. 2005;vol. 32(no 8):2528–2535. doi: 10.1118/1.1984349. [DOI] [PubMed] [Google Scholar]
- 10.Zhang ZQ, Liu QH. Three-dimensional nonlinear image reconstruction for microwave biomedical imaging. IEEE Trans. Biomed. Eng. 2004;vol. 51(no 3):544–548. doi: 10.1109/TBME.2003.821052. [DOI] [PubMed] [Google Scholar]
- 11.Li X, Bond EJ, Veen BDV, Hagness SC. An overview of ultra-wideband microwave imaging via space-time beamforming for early-stage breast-cancer detection. IEEE Antennas Propagat. Mag. 2005;vol. 47(no 1):19–34. [Google Scholar]
- 12.Sill JM, Fear EC. Tissue sensing adaptive radar for breast cancer detection - Experimental investigation of simple tumor models. IEEE Trans. Microwave Theory Tech. 2005;vol. 53(no 11):3312–3319. [Google Scholar]
- 13.Davis SK, Tandradinata H, Hagness SC, Van Veen BD. Ultrawideband microwave breast cancer detection: A detection theoretic approach using the generalized likelihood ratio test. IEEE Trans. Biomed. Eng. 2005;vol. 52(no 7):1237–1250. doi: 10.1109/TBME.2005.847528. [DOI] [PubMed] [Google Scholar]
- 14.Kosmas P, Rappaport CM. FDTD-based time reversal for microwave breast cancer detection - localization in three dimensions. IEEE Trans. Microwave Theory Tech. 2006;vol. 54(no 4):1921–1927. [Google Scholar]
- 15.Chen Y, Gunawan E, Low KS, Wang S, Kim Y, Soh C. Pulse design for time reversal method as applied to ultrawideband microwave breast cancer detection: A two-dimensional analysis. IEEE Trans. Antennas Propagat. 2007;vol. 55(no 1):194–204. [Google Scholar]
- 16.Ku G, Fornage BD, Jin X, Xu MH, Hunt KK, Wang LV. Thermoacoustic and photoacoustic tomography of thick biological tissues toward breast imaging. Tech. Cancer Res. Treatment. 2005;vol. 4(no 5):559–565. doi: 10.1177/153303460500400509. [DOI] [PubMed] [Google Scholar]
- 17.Kruger RA, Miller KD, Reynolds HE, William J, Kiser L, Reinecke DR, Kruger GA. Breast cancer in vivo: Contrast enhancement with thermoacoustic CT at 434 MHz - feasibility study. Radiology. 2000;vol. 216:279–283. doi: 10.1148/radiology.216.1.r00jl30279. [DOI] [PubMed] [Google Scholar]
- 18.Mouty S, Bocquet B, Ringot R, Rocourt N, Devos P. Microwave radiometric imaging for the characterisation of breast tumors. Eur. Phys. J.:Appl. Phys. 2000;vol. 10:73–78. [Google Scholar]
- 19.El-Shenawee M. Numerical assessment of mutifrequency microwave radiometry for sensing malignant breast cancer tumors. Micro. Opt. Technol. Letts. 2003;vol. 36(no 5):394–398. [Google Scholar]
- 20.Bardati F, Iudicello S. Modeling the visibility of breast malignancy by a microwave radiometer. IEEE Trans. Biomed. Eng. 2008;vol. 55(no 1):214–221. doi: 10.1109/TBME.2007.899354. [DOI] [PubMed] [Google Scholar]
- 21.Elsdon M, Smith D, Leach M, Foti SJ. Experimental investigation of breast tumor imaging using indirect microwave holography. Micro. Opt. Tech. Letts. 2006;vol. 48(no 3):480–482. [Google Scholar]
- 22.Fenn AJ, Wolf GL, Fogle RM. An adaptive microwave phased array for targeted heating of deep tumours in intact breast: Animal study results. Int. J. Hyperthermia. 1999;vol. 15(no 1):45–61. doi: 10.1080/026567399285846. [DOI] [PubMed] [Google Scholar]
- 23.Gardner RA, Vargas HI, Block JB, Vogel CL, Fenn AJ, Kuehl GV, Doval M. Focused microwave phased array thermotherapy for primary breast cancer. Annals of Surgical Oncology. 2002;vol. 9(no 4):326–332. doi: 10.1007/BF02573866. [DOI] [PubMed] [Google Scholar]
- 24.Vargas HI, Dooley WC, Gardner RA, Gonzalez KD, Venegas R, Heywang-Kobrunner SH, Fenn AJ. Focused microwave phased array thermotherapy for ablation of early-stage breast cancer: Results of thermal dose escalation. Annals of Surgical Oncology. 2004;vol. 11(no 2):139–146. doi: 10.1245/aso.2004.03.059. [DOI] [PubMed] [Google Scholar]
- 25.Converse M, Bond EJ, Hagness SC, Van Veen BD. Ultrawide-band microwave space-time beamforming for hyperthermia treatment of breast cancer: A computational feasibility study. IEEE Trans. Microwave Theory Tech. 2004;vol. 52(no 8):1876–1889. [Google Scholar]
- 26.Guo B, Xu L, Li J. Time reversal based microwave hyperthermia treatment of breast cancer. Micro. Opt. Technol. Letts. 2005;vol. 47(no 4):335–338. [Google Scholar]
- 27.Converse M, Bond EJ, Van Veen BD, Hagness SC. A computational study of ultrawideband versus narrowband microwave hyperthermia for breast cancer treatment. IEEE Trans. Microwave Theory Tech. 2006;vol. 54(no 5):2169–2180. [Google Scholar]
- 28.Jacobsen S, Stauffer PR. Can we settle with single-band radiometric temperature monitoring during hyperthermia treatment of chestwall recurrence of breast cancer using a dual-mode transceiving applicator? Phys. Med. Biol. 2007;vol. 52(no 4):911–928. doi: 10.1088/0031-9155/52/4/004. [DOI] [PubMed] [Google Scholar]
- 29.Taflove A, Hagness SC. Computational Electrodynamics: The Finite-Difference Time-Domain Method. 3rd ed. Norwood, MA: Artech House; 2005. [Google Scholar]
- 30.Fear EC, Okoniewski M. Confocal microwave imaging for breast tumor detection: application to a hemispherical breast model; Microwave Symposium Digest, 2002 IEEE MTT-S International; 2002. pp. 1759–1762. [Google Scholar]
- 31.Zastrow E, Davis SK, Hagness SC. Safety assessment of breast cancer detection via ultrawideband microwave radar operating in pulsed-radiation mode. Micro. Opt. Technol. Letts. 2007;vol. 49(no 1):221–225. [Google Scholar]
- 32.Lazebnik M, McCartney L, Popovic D, Watkins CB, Lindstrom MJ, Harter J, Sewall S, Magliocco A, Booske JH, Okoniewski M, Hagness SC. A large-scale study of the ultrawideband microwave dielectric properties of normal breast tissue obtained from reduction surgeries. Phys. Med. Biol. 2007;vol. 52:2637–2656. doi: 10.1088/0031-9155/52/10/001. [DOI] [PubMed] [Google Scholar]
- 33.Lazebnik M, Popovic D, McCartney L, Watkins CB, Lindstrom MJ, Harter J, Sewall S, Ogilvie T, Magliocco A, Breslin TM, Temple W, Mew D, Booske JH, Okoniewski M, Hagness SC. A large-scale study of the ultrawideband microwave dielectric properties of normal, benign and malignant breast tissues obtained from cancer surgeries. Phys. Med. Biol. 2007;vol. 52:6093–6115. doi: 10.1088/0031-9155/52/20/002. [DOI] [PubMed] [Google Scholar]
- 34.Redner RA, Walker HF. Mixture densities, maximum likelihood and the EM algorithm. SIAM Rev. 1984;vol. 26(no 2):195–239. [Google Scholar]
- 35.American College of Radiology. Breast Imaging Reporting and Data System (BI-RADS) Atlas. 4th ed 2003. [Google Scholar]
- 36.Gonzalez RC, Woods RE. Digital image processing. 2nd ed. Upper Saddle River, N.J.: Prentice Hall; 2002. [Google Scholar]
- 37.Haralick RM, Shapiro LG. Computer and Robot Vision. 1st ed. vol. 1. Boston, M.A.: Addison-Wesley; 1992. [Google Scholar]
- 38.Thomas Lee Pope J, Read ME, Medsker T, Buschi AJ, Brenbridge AN. Breast skin thickness: Normal range and causes of thickening shown on film-screen mammography. Journal of the Canadian Association of Radiologists. 1984;vol. 35:365–368. [PubMed] [Google Scholar]
- 39.Davis SK. Ph.D. dissertation. Madison: University of Wisconsin; 2006. Ultrawideband radar-based detection and classification of breast tumors. [Google Scholar]
- 40.Lazebnik M, Okoniewski M, Booske JH, Hagness SC. Highly accurate debye models for normal and malignant breast tissue dielectric properties at microwave frequencies. IEEE Microw. Wireless Compon. Lett. 2007;vol. 17:822–824. [Google Scholar]
- 41.Gabriel S, Lau RW, Gabriel C. The dielectric properties of biological tissues: III. parametric models for the dielectric spectrum of tissues. Phys. Med. Biol. 1996;vol. 41:2271–2293. doi: 10.1088/0031-9155/41/11/003. [DOI] [PubMed] [Google Scholar]
- 42.Davis SK, Van Veen BD, Hagness SC, Kelcz F. Breast tumor characterization based on ultrawideband microwave backscatter. IEEE Trans. Biomed. Eng. 2008;vol. 55(no 1):237–246. doi: 10.1109/TBME.2007.900564. [DOI] [PubMed] [Google Scholar]


