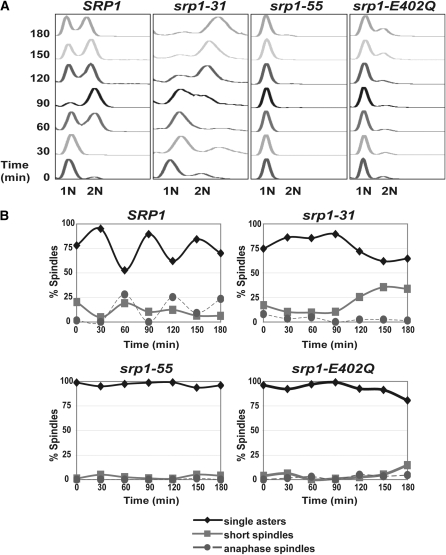
Figure 4.—
Analysis of cell cycle progression in cells synchronized in G1 phase of the cell cycle. (A) Wild-type (SRP1) and mutant (srp1-31, srp1-55, and srp1-E402Q) cells were grown to early mid-log phase at the permissive temperature and then arrested at late G1 phase with α-factor. Samples were then released to the nonpermissive temperature (37° for srp1-31 and srp1-E402Q cells and 18° for srp1-55 cells). Samples were collected every 30 min for 3 hr for flow cytometry to analyze DNA content. The positions of unreplicated DNA (1N) and replicated DNA (2N) are indicated below the graphs. (B) Spindle morphology. Wild-type (SRP1) and mutant (srp1-31, srp1-55, and srp1-E402Q) cells expressing Tub1-GFP to visualize microtubules were treated as described above in A. Spindles were visualized by examining integrated Tub1-GFP signal by direct fluorescence microscopy. Results are plotted as the percentage of spindles in the total cell population scored as single asters (no spindles, ♦); short spindles (spindle not extending to the duplicated nucleus of the daughter cell, ▪); or anaphase spindles (spindle extending to the duplicated nucleus, •) vs. time.

