

Abstract
Parallel evolution is the acquisition of identical adaptive traits in independently evolving populations. Understanding whether the genetic changes underlying adaptation to a common selective environment are parallel within and between species is interesting because it sheds light on the degree of evolutionary constraints. If parallel evolution is perfect, then the implication is that forces such as functional constraints, epistasis, and pleiotropy play an important role in shaping the outcomes of adaptive evolution. In addition, population genetic theory predicts that the probability of parallel evolution will decline with an increase in the number of adaptive solutions—if a single adaptive solution exists, then parallel evolution will be observed among highly divergent species. For this reason, it is predicted that close relatives—which likely overlap more in the details of their adaptive solutions—will show more parallel evolution. By adapting three related bacteriophage species to a novel environment we find (1) a high rate of parallel genetic evolution at orthologous nucleotide and amino acid residues within species, (2) parallel beneficial mutations do not occur in a common order in which they fix or appear in an evolving population, (3) low rates of parallel evolution and convergent evolution between species, and (4) the probability of parallel and convergent evolution between species is strongly effected by divergence.
PARALLEL evolution is the independent acquisition of traits in related species or lineages (Futuyma 1986; Wood et al. 2005). This kind of evolution has been of great interest to biologists, as the evolution of similar traits in similar environments is strong evidence that the traits are evolving in response to natural selection (Harvey and Pagel 1991). As a result, there are numerous examples of parallel phenotypic evolution reported in the literature (for review see Schluter et al. 2004): for example, the independent origins of Anolis lizard ecomorphs on the Caribbean Islands (Losos et al. 1998), a reduction of eyes in different populations of cave amphipods (Jones et al. 1992), independent evolution of crab-like morphology from shrimp-like ancestors (Morrison et al. 2002), and the evolution of sexual isolation in sticklebacks (Boughman et al. 2005), to cite a few. While many cases abound, unfortunately there is an inherent bias in the literature in that only positive cases of parallel evolution are reported whereas the absence of parallel evolution goes unreported. As of a result of this it is difficult to answer some important questions about parallel evolution by studying natural populations such as the number of beneficial mutations or adaptive pathways open to a species, the amount of pleiotropy and epistasis, and the probability (rate) of parallel evolution among species of varying degrees of divergence. It is impracticable to determine the rate of parallel evolution by relying on natural experiments, as the number of such experiments is limited, it is often difficult to establish that their environments do not differ in some subtle yet important way, and determining whether parallel changes arise from standing vs. novel variants is difficult. Similarly, it is of great interest to know whether the genetic changes underlying parallel traits are also parallel. With few exceptions (Andreev et al. 1999; Wichman et al. 1999; ffrench-Constant et al. 2000; Sucena et al. 2003; Wood et al. 2005; Colosimo et al. 2005; Sugawara et al. 2005), little is understood about the underlying genetic nature of parallel phenotypes.
Here, we use observations of evolution in the laboratory, in a system that suffers none of the limitations outlined above, to better understand parallel evolution. Our system allows strict control over the selective environment, repeated adaptation, and the ability to determine all of the underlying genetic changes in the genome. Previous experimental evolution studies of the genetics of adaptation that addressed parallel evolution found a high incidence of convergent genetic changes in independent experimental microbial lineages (Bull et al. 1997, 2000; Wichman et al. 1999; Riehle et al. 2001). In the first of these studies, Bull et al. (1997) found that 25–50% of substitutions were parallel among five experimental lines of φX174 selected for growth on two different hosts. Similarly, Wichman et al. (1999) observed ∼50% parallel evolution in two independent lines of the same phage selected for high-temperature growth. A similar study in which two related phages were evolved on two different hosts also found a large degree of parallel evolution within species but little between species (Wichman et al. 2000). In addition, they observed a significant degree of convergent evolution between the species, likely reflecting host-specific adaptations. Wichman et al. (1999) also looked for a parallel evolution at a different level—parallelism in the order in which mutations appeared and in the order in which they were fixed—but failed to find an effect. Finally, in the third of these studies (Holder and Bull 2001), two closely related phage species, G4 and φX174, were adapted to growth at high temperature and assayed both for parallel substitutions and for order effects as in Wichman et al. (1999). In contrast to the findings within species, there was no parallel evolution between the species at the level of nucleotide substitutions, and perhaps most surprisingly there was little overlap even in the genes experiencing beneficial substitutions. This failure to observe any parallel genetic changes suggests that the pool of beneficial mutations available to each species had little overlap at the levels of divergence studied. The absence of a common set of genes undergoing selection is somewhat puzzling as it might be expected that related species experiencing identical selective forces would adapt using a similar set of genes. The failure to observe this could be explained by either large differences in the adaptive solutions to a common problem or subtle differences in the selective environment experienced by each species.
In this article, we use experimental evolution to systematically study parallel evolution by adapting three Leviviridae (Murphy et al. 1995) bacteriophage species to a novel high-temperature environment. We ask three main questions: First, we ask how often parallel evolution occurs when independently evolving lines are exposed to the same environmental challenge; second, we ask how the degree of relatedness between evolving lines affects their rate of parallel evolution; and finally, we ask how often parallel genetic evolution occurs in a parallel order during adaptation by assessing the order of first detection of beneficial mutations (appearance) and order of substitution of beneficial mutations during bouts of adaptive evolution in a single species, MS2.
MATERIALS AND METHODS
Phage species:
We used three related bacteriophage species—MS2, fr, and NL95—of the family Leviviridae in this study. The Leviviridae is a family of nonenveloped, icosahedral, positive single-strand RNA bacteriophages (van Duin 1988). The family is divided into two named genera, Allolevivirus and Levivirus, and a group of unclassified phages (Murphy et al. 1995). Members of Allolevivirus and Levivirus consist primarily of coliphages—species that infect Escherichia coli. The natural host of the coliphages has not been determined (van Duin 1988), but successful infection appears to be restricted to hosts bearing the F plasmid (van Duin and Tsareva 2005); Salmonella typhimurium, artificially transformed with the F plasmid, are susceptible to successful infection by coliphages. However, the noncoliphage species PP7 and AP205, which are not dependent on the presence of the F plasmid, have been included as members of the Levivirus in the current nomenclature due to the lack of a read-through coding region (van Duin and Tsareva 2005); this taxonomic placement, however, is not supported by phylogenetic analysis (Bollback and Huelsenbeck 2001).
MS2 and fr belong to the Levivirus, while NL95 is a member of Allolevivirus. The Levivirus genomes encode four proteins (see Figure 1): (1) a maturase (M) protein, (2) a major structural coat (C) protein, (3) a lytic (L) protein, and (4) an RNA-dependent RNA-polymerase (R), or replicase, protein. The Allolevivirus genomes also encode four proteins (see Figure 1): (1) a maturase (M) protein, (2) a major structural coat (C) protein, (3) a read-through (T) protein, and (4) a replicase (R) protein. The maturase protein is a minor constituent of the viral coat in each of the species and is required for infection; phages lacking a functional maturase will adhere to the host pilus but will fail insert their RNA genomes. In addition, the maturase protein is involved in initiating cell lysis in Qβ (Bernhardt et al. 2001), a species closely related to NL95, and likely performs the same function in NL95. Lysis in MS2 and fr is carried out by the lytic protein (van Duin and Tsareva 2005). The coat protein is the major structural protein of the virion and is involved in adhesion to the host pilus, regulation of replication, and encapsidation of the RNA genome. The replicase is an RNA-dependent RNA polymerase that replicates both the positive and the intermediate negative sense RNA strand of these phages. The replicase is known to require and interact with a number of host factors during replication (van Duin 1988; van Duin and Tsareva 2005). The read-through protein of NL95 is a minor constituent of the virion involved in the process of infection. Translation of the read-through occurs infrequently (≈6%) when a ribosome misreads the coat protein gene's UGA termination signal and incorporates a tryptophan residue (van Duin and Tsareva 2005).
Figure 1.—

Genome structure of MS2, fr, and NL95. The phylogenetic relationship among the bacteriophages is shown to the right (Bollback and Huelsenbeck 2001). Lengths of single-strand RNA genomes are given in nucleotides. Solid boxes represent the four coding regions. M, maturase; C, major coat protein; L, lytic protein; T, read-through protein; R, RNA-dependent RNA polymerase (replicase).
The life cycle of these phages takes ∼35–45 min from infection to lysis (van Duin 1988). This period exceeds the generation time of E. coli and it is unclear whether the phages suppress cell division or segregate into the daughter cells. However, the former explanation seems the most plausible as the process of lysis involves inhibition of cell wall synthesis (see below). Infection of the host occurs by adsorption of the phage to the pilus, encoded by the F plasmid, followed by insertion of the RNA genome, which is likely to occur at the junction of the cell wall and pilus. The maturase protein may be involved in mediating insertion of the phage RNA genome into the host cytoplasm, as it is cleaved upon adsorption to the host pilus (Paranchych 1975); however, the mechanism remains unknown (van Duin and Tsareva 2005). Once inside the host cytoplasm, translation of the replicase protein begins first, followed soon after by translation of the coat and minor proteins. Replication of new genomes, via a negative strand intermediate, occurs simultaneously with translation. Lysis of the host cell occurs by inhibition of the murein pathway disrupting peptidoglycan synthesis (Young et al. 2000; Bernhardt et al. 2001).
The choice of bacteriophage species was based on divergence as revealed in a previous phylogenetic study of the family (Bollback and Huelsenbeck 2001). The nucleotide and amino acid divergence (uncorrected distance, p) between each species for the different coding regions is shown in Tables 1 and 2. The smallest amount of divergence was observed between MS2 and fr, with a mean amino acid divergence of 18.6%. The greatest amount of divergence between these species genomes was in the lysis protein (25.7%), while the smallest occurred in the coat (12.5%) protein. The mean amino acid divergence of MS2 and fr to NL95 was very similar, 69.9 and 70.4%, respectively. The greatest amount of divergence occurs between fr and NL95 in the coat protein (76.7%), while the least divergence occurs in the maturase protein of these two species. However, divergence between NL95 and MS2 showed very similar levels to those observed for a comparison of NL95 and fr.
TABLE 1.
A comparison of overall nucleotide divergence (uncorrected pairwise divergence, p) at homologous sites among the three species of Leviviridae
| Comparison | No. homologous sites | p |
|---|---|---|
| MS2-fr | 3466 | 0.227 |
| MS2-NL95 | 3058 | 0.578 |
| fr-NL95 | 3059 | 0.588 |
TABLE 2.
A comparison of amino acid divergence among the three species of Leviviridae
| Divergence (p) |
|||||
|---|---|---|---|---|---|
| Comparison | Maturase (M) | Coat (C) | Replicase (R) | Lysis (L) | Mean |
| MS2-fr | 0.199 | 0.125 | 0.163 | 0.257 | 0.186 |
| MS2-NL95 | 0.723 | 0.742 | 0.631 | NA | 0.699 |
| fr-NL95 | 0.717 | 0.767 | 0.627 | NA | 0.704 |
Pairwise divergence (uncorrected pairwise divergence, p) is reported as the percentage of the number of differences excluding sites with gaps. NA, not applicable as the coding region is absent in one or more of the species (see Figure 1).
Selection:
The bacteriophages, at a low multiplicity of infection (MOI) (number of phage per host at the time of infection), were selected for high-temperature (43°) growth by serial passaging in E. coli K12 host cells (Top10 F′ strain; Invitrogen, Carlsbad, CA). Host cells were cultured in liquid Luria–Bertani (LB) rich medium supplemented with tetracycline (15 μg/ml) to maintain the presence of the F plasmid, which is required for infection by the phages. The host population, used for each passage, was grown from a stock derived from a single, arbitrarily chosen, clone. The stock is stored at high density at −80° in LB supplemented with 18% DMSO. The use of a single clone was done to ensure a homogeneous host genetic background and to prevent the possibility of ongoing coevolution of the host and phages by minimizing host genetic variation and prevent adaptation of the host to the elevated temperatures. Each phage species was preadapted to growth on the host at 37° by performing 10 serial passages of 120 min; growth rate measures (data not shown) did not increase in any detectable way over this period, indicating that each species was likely sitting atop its fitness optimum. At the end of preadaptation a single ancestral plaque, chosen arbitrarily, was used to infect a 500-ml culture of E. coli that was incubated at 37° in a rotating water bath for 3 hr. At the end of incubation the phage were isolated from the host by centrifugation (host cells were not lysed before centrifugation) and the phage supernatant was archived in 1.0-ml aliquots at −80°, after the addition of 18% DMSO. The phage concentrations, measured as plaque-forming units (PFU), of the archived stocks varied from 109 to 1011. These ancestral stocks were used to initiate infection of the replicate selection lines (passage 1). In addition, a sample from the phage supernatant was used to isolate genomic RNA that was extracted, purified, amplified, and sequenced as described below to determine the ancestral genotypes (see supplemental materials S1–S3). A comparison of these sequences with the available GenBank sequences revealed 13 nucleotide (four indel) differences for MS2 (NC_001417), 10 nucleotide (three indel) differences for fr (X15031), and 13 nucleotide (seven indel) differences for NL95 (AF059243).
For each passage, fresh E. coli host cells are grown to a density of between 2.0 and 4.0 × 10⁸ cells/ml (a total volume of 3.5 ml of host was used for each culture) from the archived stock described above, and were infected during their exponential growth phase with phage at a density of 5 × 10⁷ PFU and grown in a shaking water bath at the prescribed temperature (see below). Due to the high phage concentration per milliliter in the ancestral stocks, a dilution in λ-buffer was performed prior to infection to minimize pipetting error. Excluding passage 1, which was started from the ancestral phage stock (derived from a single plaque as described above), a sample was derived from the archived population of the previous passage. At the end of each serial passage the population of phage was isolated by first adding 1% chloroform followed by centrifugation to separate the cellular debris. The phage isolates were then archived with the addition of 18% DMSO and stored at −80° for later sequence analysis. The number of phage at the end of each passage was determined using the soft agar overlay plating method. Plating was done at low density (<50 plaques/plate) to ensure accurate counts and the isolation of single infectious centers (see RNA isolation below).
An incremental selection scheme, in which temperature was gradually increased, was used: Phage populations were passaged at 39° for 10 passages (120 min/passage), followed by 41° for 10 passages (120 min/passage), and finally by 43° for the remaining 30 passages (180 min/passage). Three lines were generated for MS2 and NL95 and one for fr.
Contamination is a serious concern and was controlled in the following ways:
For each experimental species passage a host-only control tube was passaged under conditions identical to those of the experimental tubes (an aliquot of sterile λ-buffer was used as an inoculate) and plated without dilution. If any phage were detected on any of the three species' control plates after incubation for 18 hr at 37°, all experimental passages were discarded.
Replicate lines of the same species were not passaged at the same time to avoid undetected cross-contamination that would appear as parallel changes.
All equipment, pipettes for example, was routinely decontaminated in bleach and then autoclaved at 120° for 20 min. Furthermore, culture tubes used for passaging were sterilized by autoclaving before use and disposed of after a single use.
RNA isolation:
RNA was isolated from individual plaques (clones) plated at low density using the soft agar overlay method and grown inverted at 37° overnight (≈18 hr). Single plaques were selected in an arbitrary manner and grown in LB media supplemented with tetracycline (15 μg/ml) for 45–60 min (one burst) to ensure recovery of sufficient quantities of viral RNA. RNA was isolated from the phage lysate by extracting once with an acidic phenol:chloroform:iso-amyl (25:24:1) and twice with chloroform:iso-amyl (24:1), followed by a salt (1/10 vol of 3.5 m sodium acetate at a pH of 5.5) ethanol precipitation and a 70% ethanol wash. RNA was resuspended in 10 mm Tris-HCl buffer and stored at −20°.
RT–PCR and genome sequencing:
RNA was reverse transcribed and amplified by PCR using a one-step approach, using either the SuperScript II one-step kit (Invitrogen) or the OmniScript one-step kit (QIAGEN, Valencia, CA). Genomes were amplified in two (MS2 and NL95) or three (fr) overlapping fragments, using sequence-specific primers. With this approach >97% of each species genome (MS2, 97.3%; NL95, 98.5%; fr, 97.5%) was sampled, including all of the four coding regions. RT–PCR products were purified and concentrated prior to sequencing (QiaAmp PCR purification, QIAGEN) (Montage PCR purification system; Millipore, Bedford, MA). Automated double-strand sequencing was accomplished using Big Dye chain termination chemistry (Applied Biosystems, Foster City, CA).
Identification of beneficial mutations:
Parallel genetic changes were identified by isolating genomic RNA from four to five clonal plaques for each line at the end of selection, followed by RT–PCR and direct sequencing, as described above. Once substitutions had been identified from the full genome sequences, an additional five to six clones were isolated and genotyped by sequencing only regions that harbored substitutions, resulting in >50% coverage of the genome. Sites exhibiting frequencies >60% and increasing in frequency at the end of passaging were considered destined to be fixed and are referred to as substitutions hereafter.
Phage fitness assays:
Population fitness was measured as the overall growth rate under conditions experienced during the final passage of selection—growth for 180 min at a temperature of 43°. However, fitness can be measured in two ways: absolute and relative. We calculate the absolute growth rate as log2 of the number of doublings,
 |
(1) |
where, Nend and Nstart are the number of phage (PFU per milliliter) at the end and start of the passage, respectively. The relative fitness can then be derived from this as
 |
(2) |
where, Wd and Wa are the absolute fitness for the derived and the ancestral populations, respectively. Since all replicates (n = 4) for each species were assayed on the same day, ensuring identical conditions, a Student's t-test was used to determine whether the mean of the derived and ancestral lines was significant (see Table 3). Since it is reasonable to think that day-to-day variation may be larger than within-day variation, we compared the variances of the replicate fitness assays with five control passages for each species done on different days, using Fisher's F-test. A nested ANOVA was used to determine whether the replicate MS2 and NL95 lines showed similar increases in fitness relative to their respective ancestors.
TABLE 3.
Analysis of the fitness increase for each bacteriophage species relative to the ancestral population in the selected environment (growth at 43°), using a Student's t-test
| Species | Line |  |
t-value | d.f. | P-value |
|---|---|---|---|---|---|
| MS2 | 1 | 9.92 | 49.363 | 3 | 1.83e-05 |
| 2 | 8.87 | 39.875 | 3 | 3.47e-05 | |
| 3 | 9.24 | 26.056 | 3 | 0.000124 | |
| NL95 | 1 | 1.36 | 8.557 | 3 | 0.00335 |
| 2 | 3.33 | 26.995 | 3 | 0.000112 | |
| 3 | 3.87 | 20.746 | 3 | 0.000245 | |
| fr | 1 | 6.16 | 52.479 | 3 | 1.52e-05 |
 is the mean relative fitness across replicates. d.f., degrees of freedom.
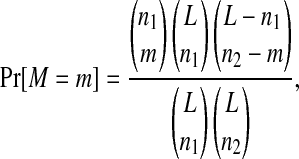
Chance probability of parallel evolution:
We employ a simple hypothesis test to examine whether the observed levels of parallel and convergent evolution could be explained, simply, by chance. The null hypothesis is H0: Substitutions occur randomly at unconstrained sites of the genome. The probability of observing the data (M = m matches) under the null hypothesis is
 |
(3) |
for the case where substitutions occur at the same sequence position but do not necessarily result in a change to the same derived state (ni is the number of substitutions in line i and L is the number of unconstrained sites), and
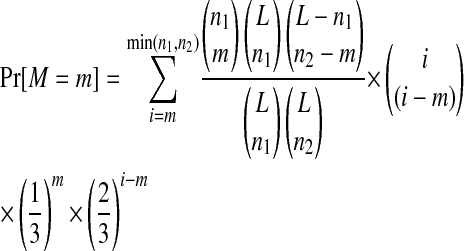 |
(4) |
for the nucleotide case in which a change occurs at the same sequence position to the same derived state. While this equation can be extended to more than two lines, we calculate the probability using a computational approach with great precision. The number of unconstrained sites, L, is difficult to determine precisely. Therefore, we adopt the conservative approach and consider only the total number of sites at which substitutions occur (MS2, L = 8; NL95, L = 10).
Test of parallel order:
For the replicate lines of MS2, we also determined the order of first detection and order of fixation of beneficial mutations. To this end, the frequency of mutations in the MS2 lines was determined by isolating 8–10 clones at intervals of 5–10 passages and sequencing those regions that harbored substitutions (four to five time points; see Bollback and Huelsenbeck 2007, for haplotype data). In cases where more than one mutation was first detected in the same passage at equal frequencies, inspection of the genetic background was used to determine the order.
The association, or correlation, of the rank order of mutations between lines was measured by the pairwise difference in orders between lines. This difference is measured by Dr and is the sum of the absolute differences between the ranks of different mutations in lines X and Y,
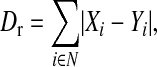 |
(5) |
where N is the set of all possible mutations identified in all three lines. Mutations not observed in a line are given the next largest rank. Significance of the observed association, Dr, was assessed by evaluating the association of all possible rank orders,  , for each line. For the analysis of fixation-order mutations C1549A/U and G1551A, which are likely to be experiencing negative epistasis as they never appear on each other's background, are pooled. The number of possible ranks in this analysis is six and therefore the total number of possible rank-order comparisons was 259,200. For the analysis of detection (first appearance) there are seven mutations and the total number of possible rank-order comparisons was 12,700,800.
RESULTS AND DISCUSSION
Fitness effects:
A comparison of day-to-day variances with within-day variances was nonsignificant with the exception of the fitness assays for line 2 of NL95 (F = 15.26, P = 0.001), so we therefore proceeded with a comparison of fitness assays collected from a single day. All of the high-temperature selected lines of each bacteriophage species showed significant increases in relative fitness (Table 3; Figure 2). The derived lines of MS2 and NL95 achieved similar levels of absolute fitness, with an average number of doublings (per 180 min) of 12.02 and 12.29, while fr was lower with 9.77 doublings (Figures 1 and 2). Interestingly, while absolute fitnesses of the MS2 and NL95 derived lines were similar, NL95 gained relatively little fitness with respect to its ancestor compared with MS2 and fr (see Figure 2). The ancestral population of NL95 appears to have already been closer to the fitness optimum as judged by the ancestor's absolute fitness at 43° (9.44 doublings; see Figure 2). A significant difference was observed in the relative fitness gains of the different replicate lines of MS2 and NL95; analysis of MS2 was marginally significant (F = 5.3271; P = 0.02209), while NL95 was highly significant (F = 93.217; P = 4.891e−8).
Figure 2.—

Relative fitness of high-temperature adapted phages (bar with dark shading, NL95; bar with light shading, MS2; open bar, fr). All derived high-temperature lines are significantly greater in fitness than their ancestors (see Table 2 and materials and methods for a description of how relative fitness is calculated). Error bars are the standard deviations.
Beneficial effects of substitutions:
Because we are investigating the rate of parallel adaptive evolution, it is important to establish that the mutations we studied are in fact beneficial. While our experimental design did not allow the fitness effects of individual substitutions to be determined, there are three lines of evidence that most of the observed substitutions are beneficial. First, every line improved in fitness (Figure 2); at least some of the substitutions must therefore be beneficial. Second, in all but two of the seven experimental lines, the ratio of nonsynonymous to synonymous changes was significantly greater than one (Table 4), using a MacDonald and Kreitman (1991) test. As nonsynonymous changes likely affect fitness, such an excess suggests that evolution in these lines is not neutral. Furthermore, synonymous changes may have substantial fitness consequences in Leviviridae, as experimental evidence has demonstrated that they can affect, for example, RNA secondary structures with important functions (Schmidt et al. 1987; van Himbergen et al. 1993; Groenveld et al. 1995; Kloviņš et al. 1997a,b, 1998). Finally, parallel evolution, which was high, is itself good evidence that many of the mutations were beneficial (see next section).
TABLE 4.
A comparison of nonsynonymous and synonymous changes at fixed beneficial and polymorphic sites in three adapted lines of MS2
| Fixed |
Polymorphic |
||||||
|---|---|---|---|---|---|---|---|
| Line | Nsyn | Syn | Nsyn/Syn | Nsyn | Syn | Nsyn/Syn | P |
| 1 | 4 | 1 | 4.0 | 4 | 20 | 0.20 | 0.0061 |
| 2 | 4 | 0 | ∞ | 5 | 22 | 0.23 | 0.0007 |
| 3 | 4 | 2 | 2.0 | 5 | 14 | 0.36 | 0.0768 |
| All | 6 | 2 | 3.0 | 13 | 52 | 0.25 | 0.0019 |
Nsyn/Syn is the ratio of nonsynonymous to synonymous changes. A MacDonald and Kreitman (1991) test was used to determine significance. Values in boldface type are significant.
Two forces may lead to the fixation of mutations that are not beneficial, however: genetic drift and hitchhiking. The contribution of genetic drift is likely negligible, as the initial population sizes in these experiments are large (5.0 × 10⁷ PFU) and the time to fixation for a neutral allele is ≈2N generations (Kimura 1983). The contribution of hitchhiking, however, is more difficult to discount. Hitchhiking occurs when a beneficial mutation destined for fixation initially appears on a background containing a neutral or slightly deleterious variant(s) (Maynard Smith and Haigh 1974). With no recombination or back mutation, the linked neutral (or slightly deleterious) variant will be fixed together with the beneficial mutation.
To determine the relative importance of hitchhiking in this experiment, we analyzed the time-series data from the MS2 lines. Unfortunately, the absence of time-series data in the other species prohibits this type of analysis, although similarity between the species suggests that MS2 is a good proxy for the others. Inspection of phage clones sampled through time for MS2 (see Bollback and Huelsenbeck 2007) reveals one simultaneous fixation event in MS2 line 3 that may signify hitchhiking (C3224U and C3320U). However, there is some evidence that both of these mutations are beneficial (i.e., neither one is a neutral hitchhiking mutation). The C3320U mutation appears to be beneficial as this mutation is fixed in two lines and appears in the third line. For C3224U, the evidence is weaker but still suggestive that it is beneficial. Mutations at this site appear in the other two lines as well (C3224U in line 1 and C3224A in line 2); in fact, of polymorphic mutations 1 of 65 mutations appears in all three lines and 4 of 65 appear in two of the lines (see supplemental materials; Bollback and Huelsenbeck 2007), suggesting that the probability of a multiple appearance by chance alone is low. In any case, the observation of only a single candidate case of hitchhiking suggests that its occurrence was low, and a conservative estimate would be that at least 88% of substitutions observed are beneficial.
Parallel genetic evolution within species:
For two of the bacteriophage species (MS2 and NL95), three replicate lines were propagated, allowing us to determine the rate of parallel evolution within species, as measured by the mean frequency of parallel changes between lines. In MS2, five of eight substitutions showed some degree of parallel evolution, with a mean frequency of parallel evolution across lines of 47% (Table 5). Of the five parallel mutations, two are found in all three lines. Substitutions at the remaining three sites are shared between two lines, with one of these showing a different derived nucleotide state. The probability of observing this amount of parallel evolution and the pattern observed among lines by chance alone is small (P ≈ 8.85e−5).
TABLE 5.
Substitutions in 43° adapted lines
| Ancestral residues |
|||||||
|---|---|---|---|---|---|---|---|
| Species | Substitution | Gene region | Amino acid change | MS2 | fr | NL95 | No. lines |
| MS2 | C206U | M | Thr 26 Ile | Leu 26 | Val 10 | 3/3 | |
| U466C | M | Tyr 113 His | Trp 113 | Leu 111 | 3/3 | ||
| C1549A/U | C | Thr 72 Ile/Asn | Val 72 | Thr 72 | 2/3 | ||
| G1551A | C | Val 73 Ile | Gln 73 | Ala 73 | 1/3 | ||
| U1685C | C | a | — | — | 2/3 | ||
| L | Ile 3 Thr | b | — | ||||
| U2733G | R | Ser 325 Ala | Ala 325 | Ser 342 | 1/3 | ||
| C3224U | R | a | — | — | 1/3 | ||
| C3320U | R | a | — | — | 2/3 | ||
| fr | U908C | M | a | — | — | 1/1 | |
| A1140G | M | Ile 338 Val | Pro 338 | Leu 393 | 1/1 | ||
| C1697A | C | Thr 121 Lys | Ser 121 | Asp 123 | 1/1 | ||
| L | Gln 3 Lys | Gln 8 | — | ||||
| A1756U | L | Glu 22 Asp | Asp 26 | — | 1/1 | ||
| U1785C | R | a | — | — | 1/1 | ||
| L | Ser 32 Lys | Ser 36 | — | ||||
| U2271C | R | a | — | — | 1/1 | ||
| G3421A | 3′UTR | — | — | — | 1/1 | ||
| NL95 | U275C | M | Phe 75 Leu | Gly 73 | Gly 73 | 3/3 | |
| G491A | M | Ala 147 Thr | Val 141 | Val 141 | 2/3 | ||
| G904A | M | a | — | — | 3/3 | ||
| U1216G | M | a | — | — | 1/3 | ||
| A1447G | C(T) | Asn 17 Asp | Asp 18 | Asp 18 | 1/3 | ||
| G1618A | C(T) | Ala 74 Thr | Val 73 | Gln 73 | 3/3 | ||
| G2075A | T | Gly 226 Glu | — | — | 3/3 | ||
| U2529C | R | Val 40 Ala | b | b | 2/3 | ||
| U3376C | R | a | — | — | 2/3 | ||
| C3535U | R | a | — | — | 1/3 | ||
Gene regions are maturase (M), major coat (C), lysis (L), read-through (T), replicase (R), and 3′-untranscribed region (3′-UTR). The coat and read-through coding regions in NL95 are in frame and therefore share any changes affecting amino acid residues. The effects of nonsynonymous changes are shown as the ancestral residue–residue position–derived residue (e.g., Thr 26 Val). —, either the change was synonymous or the coding region is absent.
A synonymous change.
Residues for which no homologous amino acid exists in a related species.
In the NL95 lines, 7 of 10 substitutions showed some degree of parallel evolution, with a mean pairwise frequency of parallel evolution of 42.6% (Table 5). Of these 10 substitutions, 4 are shared across all three lines, and 3 are shared between two lines. The remaining 3 are unique. The probability of observing this amount of parallel evolution and the pattern observed among lines by chance alone is small (P < 1.0e−7).
Parallel order effects:
As there was a high rate of parallel evolution within species, we looked for a parallel order among the mutations within one of the species, MS2. Populations that experience shared substitutions may also exhibit a parallel order in which beneficial mutations are first detected or are fixed (Wichman et al. 1999; Orr 2002, 2005). Such an effect may occur if a strong determinant of the order of fixation of mutations is their probabilities of fixation: e.g., if all mutations occur at the same time, and the one with the highest probability of fixation is fixed first in all lines. An alternative explanation for an order effect is sequential epistasis: i.e., each mutation must wait for a particular background before it is beneficial. There may be a similar effect of genetic background if some substitutions act to compensate for the deleterious pleiotropic effects of previous substitutions (Poon and Chao 2005).
First, we asked if mutations tended to be fixed in a particular order between lines. A pairwise comparison of the order in which beneficial mutations are fixed in the three replicates of MS2 revealed no correlation (see Table 6 for order data and Table 7). This perhaps is not surprising as we may not expect the probability of fixation to be the sole determinant of such a pattern in an asexual species; factors such as clonal interference, recurrent mutation, and simultaneous selective sweeps may affect the order in which beneficial mutations are fixed. Second, we asked if mutations were first detected in a particular order between lines. Unfortunately, in this experiment, mutations are unlikely to be detected until they are already at appreciable frequencies because of the small number of haplotypes sampled at each time point during the experiment. Because of the high rate at which mutations are lost (Bollback and Huelsenbeck 2007), we include all parallel mutations regardless of whether they are ultimately fixed in a particular line. A pairwise comparison of each line revealed very weak evidence for an order effect; analysis of the orders between lines 1 and 2 shows a weak effect although it is not statistically significant after a Bonferroni correction for multiple tests (Table 7). If all beneficial mutations appear simultaneously, which is likely given the extremely high mutation rates and population size of the phages, then this pattern is what we would predict if the first observed initial relative frequencies are determined by their probabilities of fixation (Gerrish and Lenski 1998).
TABLE 6.
Order of detection and fixation of beneficial parallel mutations in MS2 high-temperature adapted lines
| Fixation |
Detection |
|||||
|---|---|---|---|---|---|---|
| Mutation | Line 1 | Line 2 | Line 3 | Line 1 | Line 2 | Line 3 |
| C206U | 3 | 3 | 4 | 3 | 2 | 2 |
| U466C | 1 | 1 | 2 | 1 | 1 | 1 |
| C1549A/U | 4 | 4 | 4 | 4 | 3 | |
| G1551A | 5 | 6 | 5 | 7 | ||
| U1685C | 2 | 1 | 5 | 2 | 4 | |
| U2733G | 5 | 8 | ||||
| C3224U | 7 | 5 | ||||
| C3320U | 2 | 3 | 2 | 3 | 6 | |
Mutations at site C1549U/A and G1551A are likely to be negatively epistatic and are considered together in the analysis of fixation.
TABLE 7.
Results of a permutation test for a parallel order of detection and fixation of beneficial parallel mutations between MS2 high-temperature adapted lines
| Fixation |
Detection |
|||||
|---|---|---|---|---|---|---|
| Line 1 | Line 2 | Line 3 | Line 1 | Line 2 | Line 3 | |
| Line 1 | — | 6.0 | 9.0 | — | 7.0 | 10.0 |
| Line 2 | 0.179 | — | 7.0 | 0.040 | — | 9.0 |
| Line 3 | 0.384 | 0.179 | — | 0.219 | 0.104 | — |
Values below the diagonal are the exact P-values from considering all possible rank associations between lines. Values above the diagonal are the association statistics, Dr. The critical value of α after a Bonferroni correction is 0.008.
While there does not appear to be a common order of either fixation or detection, it is interesting to note that a qualitative inspection of the rank orders of fixation reveals a tendency for mutations that are more frequently fixed in multiple lines to occur early during adaptation. However, the sample sizes here are simply too small to determine whether this observation is significant. Our findings are similar to those of Wichman et al. (1999) who also fail to find an order effect. The failure in both of these studies to find an order effect is somewhat at odds with the observation of an order effect of parallel drug-resistant mutations in other RNA viruses. One possible explanation is that the evolution of drug resistance is dominated by a few large-effect mutations followed by compensatory evolution at a few additional sites. Therefore, the absence of an observed order effect in our study may reflect a lack of power rather than the lack of epistasis.
Parallel evolution between bacteriophage species:
How frequent is parallel evolution between species? The available pool of beneficial substitutions is dependent on the wild-type genetic background and, not surprisingly, this will affect the chance that parallel genetic changes are observed between related species (Haldane 1932). As a result, closely related species (or populations) that have more similar genomes are predicted to show more parallelism than distantly related ones; close relatives are likely to have a more similar pool of beneficial mutations. Moreover, close relatives are likely to exhibit similar patterns of epistasis and pleiotropy that may constrain adaptive solutions (see Bradshaw and Holzapfel 2000). Here, we used three species of varying degrees of relatedness, to ascertain the effect of similarity on rates of parallel evolution. As several factors, such as epistasis and pleiotropy, that affect rates of parallel evolution are likely to be more similar between closely related species, we expect the rate of parallel evolution to be positively correlated with relatedness.
The third species included in this study, fr, is a close relative of MS2. The single line of fr propagated experienced seven substitutions, similar to the number of substitutions found in other species (Table 5). We looked for parallel evolution between species at three levels: (1) homologous nucleotide changes, (2) homologous amino acid changes, and (3) similar levels of adaptive evolution in homologous genes.
Parallel nucleotide and amino acid evolution:
Starting from identical genotypes, the frequency of parallel changes at the nucleotide level ranges between 22 and 66% and at the amino acid level between 33 and 83% (mean: 56%), putting an upper limit on the number of expected parallel changes that should be observed between species if they decline with genetic distance. A comparison of the closely related species MS2 and fr showed no parallel changes at the nucleotide level. Interestingly, in the more divergent species MS2 and NL95, a single parallel nucleotide change (G1551A in MS2 and G1618A in NL95), in the coat protein coding region, was observed (1 of 17 possible substitutions, excluding the single substitution on NL95 in read-through protein, which is absent in MS2). Both changes are replacements; however, the derived amino acid residues were not the same (see below).
At the amino acid level, a comparison of replacement changes between the two most closely related species in this study, MS2 and fr, showed no parallel changes at homologous amino acid residues in any of the genes (Table 5). A comparison of the distantly related fr and NL95 showed no parallel changes at the amino acid level. However, MS2 and NL95 showed a parallel change at a homologous amino acid residue in the coat protein (G1551A, Val 73 Ile in MS2 and G1618A, Ala 74 Thr in NL95). However, this could simply be due to chance as the underlying nucleotide change and adaptive amino acid residue are not the same. The results do suggest, at least at the divergence levels explored here, that parallel evolution between species is strongly affected by divergence.
Parallel gene evolution:
We further searched for parallel evolution within and between species at the gene level. A comparison of the within-species parallel rate of evolution within genes, i.e., the frequency of substitutions that are parallel within a gene, ranged from 33 to 100%. MS2 exhibited the highest rate of parallel evolution in the maturase and lysis genes where all changes were fixed in all three lines. In contrast, the lowest rates of parallel evolution were in the major coat and replicase genes, with two of three and one of three substitutions occurring in all lines. NL95, on the other hand exhibited lower rates with the largest being the maturase gene where three of four substitutions were parallel, with the lowest rates being roughly equal among the other genes (major coat, 50%; read-through, 66%; replicase, 66%).
A comparison of the number of substitutions in each of the species did not show a significant bias in their distribution among coding regions (homogeneity test: MS2, 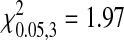 , P = 0.578; fr,
 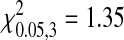 , P = 0.716; NL95,
 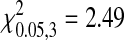 , P = 0.477). This indicates that there is not a strong bias in the genes involved in adaptation. However, in the absence of specific knowledge about the magnitude of beneficial effects of individual mutations we cannot determine the relative contributions of different genes on phage fitness. It is plausible that the distribution of fitness contributions among genes is biased in the adapted phages and the more closely related species are more similar.
Convergent evolution between bacteriophage species:
Convergent evolution is similar to parallel evolution in that the final adaptive state is identical in two independent lineages. However, in the context of these experiments we define convergent evolution as one species acquiring a state that exists as the wild-type state in the ancestor of another species. These kinds of changes have been shown to occur in other bacteriophage systems when one of the related species is already preadapted to a particular environment (e.g., host-specific mutations, see Crill et al. 2000; Wichman et al. 2000).
How common is convergent evolution, relative to parallel evolution, in our bacteriophage system? We find no convergence at the nucleotide level. However, a comparison of replacement changes in each of the species (Table 5) reveals three examples of convergence at the amino acid level: (1) a change in MS2 from a serine to an alanine at residue 325, in the replicase protein, that converges to the wild-type residue in fr; (2) a change in fr from glutamic acid to asparagine at residue 22, the lysis protein, that results in convergence to the wild-type residue in MS2; and (3) a change in NL95 from an asparagine to aspartic acid at residue 17, in the coat protein, that results in convergence with the wild-type residues in both MS2 and fr. While these observations seem to suggest that convergent evolution is more frequent between species than parallel evolution, the probability that by chance alone we would observe convergent changes at 3 of the 17 residues is fairly high [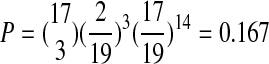 ]. Even if we consider that mutations at a residue are likely constrained to a smaller subset of outcomes, the probability drops below 0.05 only when five or fewer states are considered. However, even if the observed level of convergence is not simply a chance observation, it is not more frequent among the more closely related species.
Conclusions:
In this study of parallel evolution, we observe a high rate of parallel evolution within species and no parallel evolution between species. We do observe a beneficial replacement change at a homologous amino acid residue between one of the divergent comparisons: MS2 and NL95. However, this could have been a chance observation rather than a parallel event as the underlying nucleotide change and beneficial residue are different. This absence of parallel evolution between species suggests that, at least at the divergence levels studied, there appears to be a strong effect of evolutionary divergence on the probability of parallel evolution. In addition, the probability of genetic convergence among species was also not predicted by the degree of divergence between species—convergence occurred between both closely and distantly related bacteriophage species. What our findings do seem to suggest is that complex parallel phenotypic adaptations in divergent species may not have parallel underlying genetic causes, and these phenomena may be restricted to diverging populations within a species or between very closely related species.
Acknowledgments
The authors thank Hopi Hoekstra, H. Allen Orr, John Jaenike, Kelly Dyer, and Andrea Betancourt for comments on early versions of the manuscript; Rasmus Nielsen for providing insightful comments on the current manuscript; and Daven Presgraves and Andrea Betancourt, who provided substantial and invaluable comments and suggestions on the current version of the manuscript. Insightful discussions were provided by Barry G. Hall. Samples of the bacteriophage were kindly provided by Jan van Duin. The authors thank the Hoekstra Lab (University of California, San Diego) for their patience and accommodation during the sequencing phase of the project, in particular Hopi Hoekstra, Leslie Turner, Lynne Mullen, and Rachel Hirschmann. This work was supported by grants from the National Science Foundation to J.P.H. (MCB-0075404) and by funding from the Danish Research and Innovations Agency (Forskningsraadet for Sunhed og Sygdom ref. no. 271050599) to J.P.B. during the writing of the manuscript.
References
- Andreev, D., M. Kreitman, T. W. Phillips, R. W. Beeman and R. H. ffrench-Constant, 1999. Multiple origins of cyclodiene insecticide resistance in tribolium castaneum (coleoptera: Tenebrionidae). J. Mol. Evol. 48 615–624. [DOI] [PubMed] [Google Scholar]
- Bernhardt, T. G., I. N. Wang, D. K. Struck and R. Young, 2001. A protein antibiotic in the phage qbeta virion: diversity in lysis targets. Science 292 2326–2329. [DOI] [PubMed] [Google Scholar]
- Bollback, J. P., and J. P. Huelsenbeck, 2001. Phylogeny, genome evolution, and host specificity of single-stranded RNA bacteriophage (Family Leviviridae). J. Mol. Evol. 52 117–128. [DOI] [PubMed] [Google Scholar]
- Bollback, J. P., and J. P. Huelsenbeck, 2007. Clonal interference is alleviated by high mutation rates in large populations. Mol. Biol. Evol. 24 1397–1406. [DOI] [PubMed] [Google Scholar]
- Boughman, J., H. Rundle and D. Schluter, 2005. Parallel evolution of sexual isolation in sticklebacks. Evol. Int. J. Org. Evol. 59 361–373. [PubMed] [Google Scholar]
- Bradshaw, W. E., and C. M. Holzapfel, 2000. The evolution of genetic architectures and the divergence of natural populations, pp. 245–263 in Epistasis and the Evolutionary Process, edited by J. B. Wolf, E. D. Brodie and M. J. Wade. Oxford University Press, New York.
- Bull, J., M. R. Badgett, H. A. Wichman, J. P. Huelsenbeck, D. M. Hillis et al., 1997. Exceptional convergent evolution in a virus. Genetics 147 1497–1507. [DOI] [PMC free article] [PubMed] [Google Scholar]
- Bull, J. J., M. R. Badgett and H. Wichman, 2000. Big-benefit mutations in a bacteriophage inhibited with heat. Mol. Biol. Evol. 17 942–950. [DOI] [PubMed] [Google Scholar]
- Colosimo, P., K. Hosemann, S. Balabhadra, G. Villarreal, M. Dickson et al., 2005. Widespread parallel evolution in sticklebacks by repeated fixation of Ectodysplasin alleles. Science 307 1928–1933. [DOI] [PubMed] [Google Scholar]
- Crill, W. D., H. A. Wichman and J. J. Bull, 2000. Evolutionary reversals during viral adaptation to alternating hosts. Genetics 154 27–37. [DOI] [PMC free article] [PubMed] [Google Scholar]
- ffrench-Constant, R. H., N. Anthony, K. Aronstein, T. Rocheleau and G. Stilwell, 2000. Cyclodiene insecticide resistance: from molecular to population genetics. Annu. Rev. Entomol. 48 449–466. [DOI] [PubMed] [Google Scholar]
- Futuyma, D. J., 1986. Evolutionary Biology. Sinauer Associates, Sunderland, MA.
- Gerrish, P. J., and R. E. Lenski, 1998. The fate of competing beneficial mutations in an asexual population. Genetica 102 127–144. [PubMed] [Google Scholar]
- Groenveld, H., K. Thimon and J. van Duin, 1995. Translational control of maturation-protein synthesis in phage MS2: A role for the kinetics of RNA folding? RNA 1 79–88. [PMC free article] [PubMed] [Google Scholar]
- Haldane, J. B. S., 1932. The Causes of Evolution. Harper Brothers, New York.
- Harvey, P. H., and M. D. Pagel, 1991. The Comparative Method in Evolutionary Biology. Oxford University Press, London/New York/Oxford.
- Holder, K. K., and J. J. Bull, 2001. Profiles of adaptation in two similar viruses. Genetics 159 1393–1404. [DOI] [PMC free article] [PubMed] [Google Scholar]
- Jones, R., D. Culver and T. Kane, 1992. Are parallel morphologies of cave organisms the result of similar selection pressures? Evol. Int. J. Org. Evol. 46 353–365. [DOI] [PubMed] [Google Scholar]
- Kimura, M., 1983. The Neutral Theory of Molecular Evolution. Cambridge University Press, Cambridge/London.
- Kloviņš, J., N. Tsareva, M. de Smit, V. Berzins and J. van Duin, 1997. a Rapid evolution of translational control mechanisms in RNA genomes. J. Mol. Biol. 265 372–384. [DOI] [PubMed] [Google Scholar]
- Kloviņš, J., J. van Duin and C. L. Olsthoorn, 1997. b Rescue of the RNA phage genome from RNase III cleavage. Nucleic Acids Res. 25 4201–4208. [DOI] [PMC free article] [PubMed] [Google Scholar]
- Kloviņš, J., V. Berzins and J. van Duin, 1998. A long range interaction in Qβ RNA that bridges the thousand nucleotides between the M-site and the 3′ end is required for replication. RNA 4 948–957. [DOI] [PMC free article] [PubMed] [Google Scholar]
- Losos, J., T. Jackman, A. Larson, K. de Queiroz and L. Rodríguez-Schettino, 1998. Historical contingency and determinism in replicated adaptive radiations of island lizards. Science 279 2115–2118. [DOI] [PubMed] [Google Scholar]
- MacDonald, J., and M. Kreitman, 1991. Adaptive protein evolution at the Adh locus in Drosophila. Nature 351 652–654. [DOI] [PubMed] [Google Scholar]
- Maynard Smith, J., and J. Haigh, 1974. The hitch-hiking effect of a favourable gene. Genet. Res. 23 23–25. [PubMed] [Google Scholar]
- Morrison, C., A. Harvey, S. Lavery, K. Tieu, Y. Huang et al., 2002. Mitochondrial gene rearrangements confirm the parallel evolution of the crab-like form. Proc. R. Soc. Lond. Ser. B 269 345–350. [DOI] [PMC free article] [PubMed] [Google Scholar]
- Murphy, F. A., C. M. Fauquet, D. H. L. Bishop, S. A. Ghabrial, A. W. Jarvis et al., 1995. The Sixth Report of the International Committee on Taxonomy of Viruses. Springer-Verlag, Vienna.
- Orr, H., 2005. The probability of parallel evolution. Evol. Int. J. Org. Evol. 59 216–220. [PubMed] [Google Scholar]
- Orr, H. A., 2002. The population genetics of adaptation: the adaptation of DNA sequences. Evolution 56 1317–1330. [DOI] [PubMed] [Google Scholar]
- Paranchych, W., 1975. Attachment, ejection and penetration stages of the RNA phage infection process, p. 85 in RNA Phages, edited by N. Zinder. Cold Spring Harbor Laboratory Press, Cold Spring Harbor, NY.
- Poon, A., and L. Chao, 2005. The rate of compensatory mutation in the DNA bacteriophage phiX174. Genetics 170 989–999. [DOI] [PMC free article] [PubMed] [Google Scholar]
- Riehle, M. M., A. F. Bennett and A. D. Long, 2001. Genetic architecture of thermal adaptation in Escherichia coli. Proc. Natl. Acad. Sci. USA 98 525–530. [DOI] [PMC free article] [PubMed] [Google Scholar]
- Schluter, D., E. A. Clifford, M. Nemethy and J. S. McKinnon, 2004. Parallel evolution and inheritance of quantitative traits. Am. Nat. 163 809–822. [DOI] [PubMed] [Google Scholar]
- Schmidt, B., B. Berkhout, G. Overbeek, A. van Strien and J. van Duin, 1987. Determination of the RNA secondary structure that regulates lysis gene expression in bacteriophage MS2. J. Mol. Biol. 195 505–516. [DOI] [PubMed] [Google Scholar]
- Sucena, E., I. Delon, I. Jones, F. Payre and D. L. Stern, 2003. Regulatory evolution of shavenbaby/ovo underlies multiple cases of morphological parallelism. Nature 424 935–938. [DOI] [PubMed] [Google Scholar]
- Sugawara, T., Y. Terai, H. Imai, G. Turner, S. Koblmüller et al., 2005. Parallelism of amino acid changes at the RH1 affecting spectral sensitivity among deep-water cichlids from Lakes Tanganyika and Malawi. Proc. Natl. Acad. Sci. USA 102 5448–5453. [DOI] [PMC free article] [PubMed] [Google Scholar]
- van Duin, J., 1988. Single-stranded RNA bacteriophages, pp. 117–167 in The Viruses, edited by H. Fraenkel-Conrat and R. Wagner. Plenum Press, New York.
- van Duin, J., and N. Tsareva, 2005. Single-stranded RNA phages, pp. 175–196 in The Bacteriophages, Ed. 2, edited by R. Calendar and S. Abedon. Oxford University Press, New York.
- van Himbergen, J., B. van Geffen and J. van Duin, 1993. Translational control by a long range RNA-RNA interaction; a base substitution analysis. Nucleic Acids Res. 21 1713–1717. [DOI] [PMC free article] [PubMed] [Google Scholar]
- Wichman, H. A., M. R. Badgett, L. A. Scott, C. M. Boulianne and J. J. Bull, 1999. Different trajectories of parallel evolution during viral adaptation. Science 285 422–424. [DOI] [PubMed] [Google Scholar]
- Wichman, H. A., L. A. Scott, C. D. Yarber and J. J. Bull, 2000. Experimental evolution recapitulates natural evolution. Philos. Trans. R. Soc. B Biol. Sci. 355 1677–1684. [DOI] [PMC free article] [PubMed] [Google Scholar]
- Wood, T., J. Burke and L. Rieseberg, 2005. Parallel genotypic adaptation: when evolution repeats itself. Genetica 123 157–170. [DOI] [PMC free article] [PubMed] [Google Scholar]
- Young, R., W. Ing-Nang and W. D. Roof, 2000. Phages will out: strategies of host cell lysis. Trends Microbiol. 8 120–128. [DOI] [PubMed] [Google Scholar]