Abstract
Indeterminate organisms have received comparatively little attention in theoretical ecology and still there is much to be understood about the origins and consequences of community structure. The fungi comprise an entire kingdom of life and epitomize the indeterminate growth form. While interactions play a significant role in shaping the community structure of indeterminate organisms, to date most of our knowledge relating to fungi comes from observing interaction outcomes between two species in two-dimensional arena experiments. Interactions in the natural environment are more complex and further insight will benefit from a closer integration of theory and experiment. This requires a modelling framework capable of linking genotype and environment to community structure and function. Towards this, we present a theoretical model that replicates observed interaction outcomes between fungal colonies. The hypotheses underlying the model propose that interaction outcome is an emergent consequence of simple and highly localized processes governing rates of uptake and remobilization of resources, the metabolic cost of production of antagonistic compounds and non-localized transport of internal resources. The model may be used to study systems of many interacting colonies and so provides a platform upon which the links between individual-scale behaviour and community-scale function in complex environments can be built.
Keywords: fungal colony, fungal interactions, individual-based modelling, deadlock, lysis, replacement
1. Introduction
Many plants and invertebrates have indeterminate growth forms in the sense that they do not have a genetically determined upper size limit or lifespan and the fungi, as a separate kingdom of life, epitomize this. Within ecological systems, fungi have extremely important functional roles as nutrient recyclers and decomposers (Johnson et al. 2005) and are a life support network for most plants (Bardgett et al. 2005, 2006) providing soil-borne nutrients that are difficult for plants to access in exchange for carbon (White 2003) and protecting plants against below-ground pathogens (Smith & Read 1997). Fungal colonies grow as an interconnected network of hyphae, the mycelium, through the pore channels in soil and impact on its physical structure improving porosity (Ritz & Young 2004). It is the hyphal tips that extend through this porous structure, and it is through these tips that the majority of resource is acquired (Ashford & Allaway 2002). Resource may then be distributed to the more rigid structures situated behind these tips that constitute much of the network (Lindahl & Olsson 2004). The dynamics of fungal colony growth are complex and dependent on a number of factors such as biotic interactions (insect, bacterial and plant) as well as interactions with the microclimate and physio-chemical structure of the habitat (Boddy 2000). Further, colony interactions within fungal communities are believed to have a significant impact on mycelial distributions, due to the high probability of an encounter as a consequence of their abundance, indeterminacy and ubiquity (Rayner et al. 1994). Little is known about the precise contributions of each of these factors to the development of the majority of natural fungal colonies in soil. However, wood and agar communities have been extensively studied and the contributions affecting colony development for a given biotic and abiotic environment are investigated (White 2003).
A substantial body of experimental work has investigated the mycelial distributions of confrontations between wood-decay species, usually paired on agar plates (e.g. Rayner & Webber 1984; White & Boddy 1992; Rayner et al. 1994; Boddy 2000). Interspecific fungal interactions may be mediated at a distance or via contact, and the result of these interactions is dependent on species compatibility. While the notion of genotype compatibility is not clearly defined in the literature, the meeting of somatically incompatible genotypes results in the rejection of individuals (Hietala et al. 2003). Somatic incompatibility maintains mycelial individuality by denying exchange of genetic material (Hietala et al. 2003). Somatic compatibility results in a hyphal interaction known as perfect fusion that involves union of cell walls and mixing of the cytoplasm between the species. The phenomenon of fungal interaction outcome may be one of the following: intermingling, i.e. neutral interaction that results in fusion of colonies for compatible or spatial intermixing for incompatible genotypes; deadlock, i.e. neither species enters the territory of the other; or replacement, i.e. one individual is partially or entirely replaced by another (Boddy 2000). Deadlock often occurs due to each species detecting non-native chemical compound(s) that inhibit growth, although the chemical basis of the myriad of compounds produced and how they are sensed is unclear (White & Boddy 1992). Replacement may result from one individual completely engulfing the other as a prelude to complete replacement. Replacement may induce autophagy, which promotes degradation and recycling of long-lived proteins and organelles in eukaryotic cells (Yorimitsu & Klionsky 2005). The key genes of autophagy are also active in filamentous fungi (Pinan-Lucarre et al. 2005). For the replacement to be successful, the membrane of one of the genetically incompatible colonies will lyse (cellular necrosis), releasing the hyphal content that can subsequently be used by an antagonist.
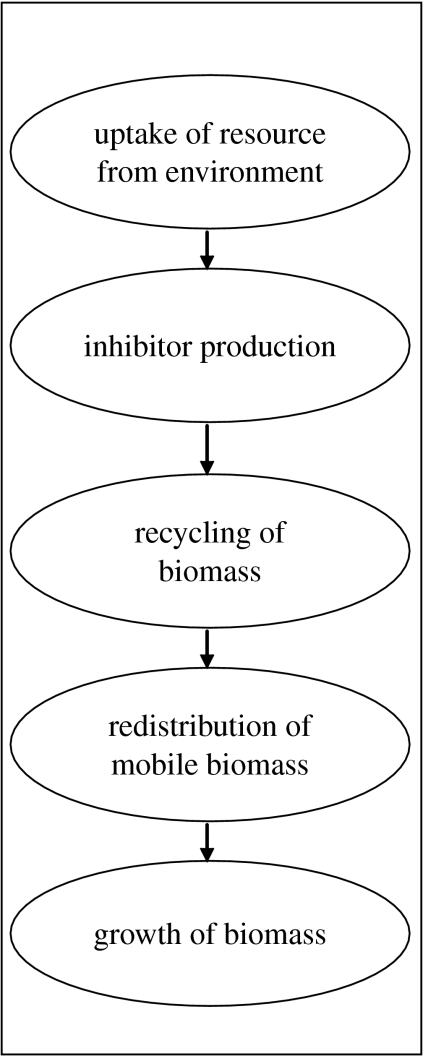
Computational models may help to reduce the knowledge gap between experimental results derived from manageable, measurable agar and wood systems and the dynamics of fungal communities in soil systems. For a model to reduce this gap, it must address three related challenges. First, a model must have an explicit account of the physiology of organisms since experimental systems afford determination of upper and lower bounds on parameters to that model and this experimental parametrization is essential if the model results are to be applied to actual communities (Bown et al. 2007). Second, if a model is to explore the link between individual functioning (process) and community-scale behaviour (pattern), i.e. the holy grail in ecology (Reineking et al. 2006), it must relate the dynamic functioning of individuals in a community together with their interactions within a spatio-temporally heterogeneous environment. Finally, in any computational model, there is a trade-off between model complexity and tractability (Cairns et al. 2007) and so the model must be parsimonious in its formulation (Cox et al. 2006). As a fundamental step in understanding the dynamics of fungal communities, we have developed a model of individual fungal colony growth that addresses these challenges (Falconer et al. 2005). The model describes a fungal colony in terms of a functional trait set, listed in table 1, that defines the colony ability to uptake resources from the environment, redistribute biomass within the mycelial network, recycle biomass and grow through that environment based on measurable physiological processes. This minimal trait set parametrizes only the essential processes required to simulate the behaviour of colony development in a heterogeneous environment, and the representation is readily extensible to consider inter-colony interactions (figure 1). This model demonstrates that colony phenotype emerges as a consequence of the interplay between environment and genotype, i.e. the trait set (Falconer et al. 2005), and that the biomass recycling (see below) is a crucial component for survival in heterogeneous environments such as soil (Falconer et al. 2007).
Table 1.
The functional trait set that characterizes colony growth (π is defined in box 1).
| trait | description |
|---|---|
| αnπθ | rate per unit biomass at which mobile biomass is immobilized into non-insulated biomass |
| αiπθ | rate per unit biomass at which mobile biomass is immobilized into insulated biomass |
| βnπ | rate at which non-insulated biomass is immobilized into mobile biomass |
| βiπ | rate at which insulated biomass is immobilized into mobile biomass |
| θ | nonlinear term associated with the immobilization process |
| λ1 | rate of uptake of non-insulated biomass per unit time |
| λ2 | rate of uptake of insulated biomass per unit time |
| ζ | fraction of non-insulated biomass that is converted to insulated biomass per unit time |
| Dn | diffusion coefficient governing the transport of mobile biomass within the colony |
| Db | diffusion coefficient governing the transport of non-insulated biomass within the colony |
Figure 1.
Schematic summarizing the biological processes as described by the conceptual model for fungal growth and interactions.
In detail, the model formulation represents an individual colony or mycelial network as biomass comprising three fractions: immobilized insulated biomass (bi); non-insulated biomass (bn); and mobilized biomass (n). Non-insulated biomass represents the active hyphal tips of a colony where the rate of uptake is high. Insulated biomass represents the aged part of the colony where the resource has already been exploited and this notion is consistent with Rayner et al. (1995). Mobile biomass is the fraction of the fungal colony that is able to be relocated within the mycelial network; immobile biomass is structural, i.e. hyphal; and the insulated immobile biomass is fixed in space whereas non-insulated biomass can grow through space by diffusion. The relative proportions of these components are dynamic and determined by four physiological processes: uptake; inter-conversion rates between mobile and immobile biomass; redistribution of mobile biomass; and growth. External resource is acquired from the environment, via uptake from insulated (λ2) and non-insulated biomass (λ1), and converted into mobile biomass. This mobile biomass may be converted into non-insulated (αn) or insulated biomass (αi) akin to the hyphal biomass production. Hyphal biomass, both non-insulated (βn) and insulated (βi), may also be degraded and converted into mobile biomass corresponding to hyphal degradation. Since mobilization and immobilization is determined by local mobile biomass concentration, it is possible that different parts of the mycelium will undergo net mobilization or immobilization. The mobile biomass is transported through the mycelial network and the flow is governed by a diffusion coefficient (Dn) derived from the local concentration of mobile biomass. Growth in regions of high uptake is accelerated by a nonlinear term (θ) associated with the immobilization process. The colony expands at a constant rate according to a diffusive process with a constant diffusion coefficient (Db). The rate of insulated biomass production is governed by ζ together with the rate of production of non-insulated biomass. This corresponds to the extension of hyphae and the rigidification of hypha behind the tip. The mathematical description of each physiological process results in a genotype vector [αn, αi, βn, βi, θ, λ1, λ2, ζ, Dn, Db] that determines the rates of uptake, redistribution of biomass and growth for that colony. Hence, our assumption is that all species of filamentous fungi essentially carry out the same elementary physiological processes but to varying degrees and this is reflected in the values within the genotype (trait set).
A key advancement in our modelling framework, and not reflected in other modelling approaches to our knowledge, is the incorporation of a biomass recycling process and recycling is known to be crucial for the survival of other indeterminate systems (Lesser 2004; Ellis et al. 2005). Biomass recycling was first hypothesized by Levi et al. (1968) and demonstrated more recently by Yang et al. (1997) and Lindahl & Finlay (2006). This biomass recycling allows fungi and other indeterminate organisms to relocate spatially existing biomass to best exploit the resource available in the spatial environment. While information relating to the mechanisms of recycling is scant (Yorimitsu & Klionsky 2005), the theoretical importance of a recycling process for colony survival in heterogeneous environments was demonstrated in Falconer et al. (2007). Further, existing theoretical models do not account for fungal interactions in terms of an explicit physiological representation of each interacting fungus and characterization of the processes governing the interaction outcome. Here the modelling framework is extended to incorporate inter-colony signalling and antagonistic responses that determine the outcome of fungal interactions. The model is used to explore the effect of genotype and environment on the phenotypes of interacting mycelia. In particular, we construct simulation experiments, to investigate
the effect of genotype on interaction outcomes in a two-dimensional spatially homogeneous environment,
the effect of resource quantity on interaction outcomes in a two-dimensional spatially homogeneous environment, and
the effect of a three-dimensional porous architecture, i.e. a spatially heterogeneous environment, on interaction outcomes.
2. Materials and methods
Simulation scenarios are created as described in §2.1 using a modelling framework based on an extension to the partial differential equations of Falconer et al. (2005) given below (box 1). This extension was designed such that it is a simple and natural extension of the original model informed by the physical interaction process. Careful consideration was given capturing the essential features of observed interactions, while maintaining scalability in terms of modelling multiple individuals. This extension takes the form of an inhibitor field that diffuses from each individual through the environment, together with processes that determine colony response to that field. Colony response is realized by modifying recycling and colony growth traits. Implementation is based on the following hypotheses relating to the interaction process.
Box 1.
The set of equations describing fungal growth and interactions. Bold, enlarged text corresponds to the model extension.
where
Inhibitor production. The rate of inhibitor production, i, is colony dependent and governed by a trait, Ω, which is usually a value between 0 and 1. There is no distinction between the different types of compounds that may be produced by a fungus, e.g. inhibitor, antibiotic, extracellular enzyme (White & Boddy 1992), and these are encapsulated by a generic inhibitor field. This inhibitor field is derived from the mobile biomass concentration, n, and the conversion of mobile biomass into inhibitor has an associated metabolic cost, Χ. The inhibitor field is diffusible with a constant diffusion coefficient, Di, and unlike the diffusion of mobile biomass it is not constrained by the boundaries of the mycelium but by the limits of the environment.
Inhibition. In the model there exists a global inhibitor field, ig, which is the sum of all the generic inhibitor fields produced by individual colonies, i. Locally, if ig>i, this reflects the presence of another individual. Each cell containing inhibitor also has a flag indicating the origin of the inhibitor, i.e. which individual(s) it originated from. A comparison of this flag list determines whether the individual is an antagonist or is compatible. If the inhibitor field is produced by an individual of compatible genotype, the two colonies will interact neutrally, their biomass fields connecting and becoming one single individual. Otherwise, an antagonist is detected and the local diffusion coefficient of non-insulated biomass (Db) is affected, preventing growth towards the antagonist. This in turn prevents the uptake of resource and subsequent production of (new) non-insulated biomass. Since non-insulated biomass is converted into insulated biomass, the affected region will be eventually converted into insulated biomass. In the model implementation, growth is inhibited upon detection of an antagonist by assigning the local diffusion coefficient to zero. Each individual has a sensitivity threshold, ψ, as some colonies will be more sensitive to an inhibitor field than others. If the global inhibitor field is greater than the colony inhibitor field by an amount greater than its sensitivity threshold (ig−i>ψ), then the local diffusion coefficient for the non-insulated biomass is assigned zero:
Autophagy. Autophagic recycling, the controlled recycling of nutrients inside an intact plasma membrane, is simulated by changing the coefficients responsible for mobilization and immobilization of insulated and non-insulated biomass, i.e. the recycling parameters. If the colony can initiate autophagic recycling (η>0) as a response to the detection of an antagonist (ig−i>0), then autophagic recycling proceeds and is simulated by a high mobilization rate of insulated and non-insulated biomass, i.e. the mobilization coefficients are set to βi=βn=0.9. This converts hyphal biomass into mobile phase. Correspondingly there is a low rate of immobilization of both insulated and non-insulated biomass, i.e. αi=αn=0.01, therefore reducing biomass assimilation:
If the total immobile biomass (bi+bn) is much smaller than mobile biomass (n) (bi+bn<10−10 and n>0), the mobile biomass is converted into environmental resource, reflecting the final necrotrophic lysis catastrophe.
The set of physiological processes including the interaction process results in a vector of 12 parameters: αn, αi, βn, βi, θ, λ1, λ2, ζ, Dn, Db, Ω and η (bold highlights the extension traits and equations). The resultant set of equations describing uptake, biomass production and recycling, the transport of mobile biomass and interactions among mycelia may be written as in box 1.
In the scenarios described below the system of equations is discretized on a two- or three-dimensional lattice large enough to simulate the colony morphologies of two species. For two dimensions, a square lattice of 256×256 is used. For three dimensions, a 48×48×48 cube is used as this was achievable computationally. Both two and three dimensions are solved using the Crank Nicholson implicit method in conjunction with successive over-relaxation. No flux boundaries were imposed.
2.1 Scenario 1: the effect of genotype on interaction outcomes in a two-dimensional spatially homogeneous environment
Here we investigate the effect of varying interaction parameters Ω and η on the interaction outcome of two fungal colonies with the same (compatible) and different (antagonistic) genotypes. The two colonies are inoculated at opposite ends of a homogeneous, two-dimensional environment with one unit of resource in each cell. In the simulations, we alter the genotype vectors defining those colonies and in particular the traits associated with inhibitor production and autophagy. Table 2 indicates the traits that were varied in each of the six simulations. In simulation 1, both antagonists produce inhibitor (Ω=0.01) and neither have autophagic properties. In simulation 2, only one antagonist produces inhibitor (Ω=0.01) with no autophagic capability; the other has autophagic capabilities (η=1) and no inhibitor production (Ω=0). For simulation 3, only one antagonist has inhibitor-producing capabilities (Ω=0.01) while neither have autophagic apparatus. In simulations 4 and 5, the trait governing inhibitor production is varied from high (0.9) to low (0.01). Finally, in simulation 6, both colonies produce inhibitor (Ω=0.01) but have compatible genotypes.
Table 2.
Interaction traits associated with simulations 1–6. (In all simulations, the inhibition sensitivity threshold ψ=0 and metabolic cost Χ=0.01.)
| simulation | colony A | colony B | compatible genotype |
|---|---|---|---|
| 1 | Ω=0.01, η=0 | Ω=0.01, η=0 | no |
| 2 | Ω=0, η=0 | Ω=0.01, η=0 | no |
| 3 | Ω=0, η=1 | Ω=0.01, η=0 | no |
| 4 | Ω=0.01, η=0 | Ω=0.01, η=0 | no |
| 5 | Ω=0.01, η=0 | Ω=0.9, η=0 | no |
| 6 | Ω=0.01, η=0 | Ω=0.01, η=0 | yes |
In the case of simulation 6, where we explore different values for interaction parameters with compatible genotypes, the traits defining the colonies are identical. In simulations 1–5, the genotypes of the two colonies are necessarily different since we wish to explore the impact of interaction parameters on incompatible types. We have already demonstrated that in homogeneous environments biomass recycling has no significant affect on the rate of biomass production and so, to effect incompatible genotypes, we vary the biomass recycling traits, and in some simulations the diffusion coefficient, between the colonies. In this way we are able to define incompatible genotypes that are not significantly different in function in homogeneous environments. The full genotype of each simulated colony is provided as a table in each of figures 2–7.
Figure 2.
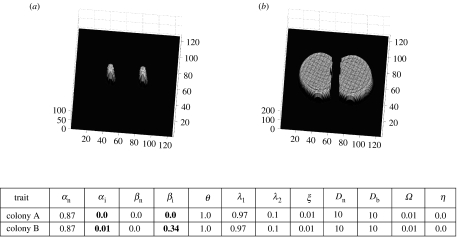
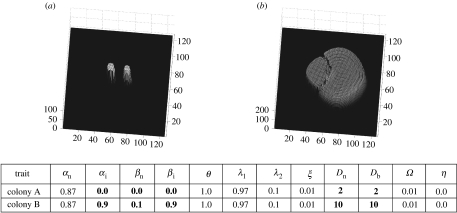
Deadlock resulting from both fungal individuals producing inhibitor and each colony's growth being sensitive to the presence of the other (a, t=1 and b, t=7). Differing traits are highlighted in bold. Colony arrangements ((a) colony A and (b) colony B) are consistent throughout figures 2–8.
Figure 3.
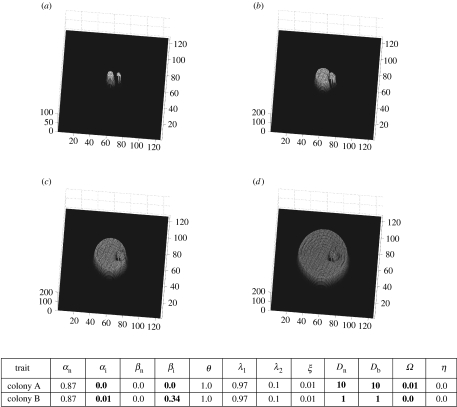
Engulfment of colony B (b,d; t=1 and t=6, respectively) by colony A (a,c; t=3 and 9, respectively).
Figure 4.
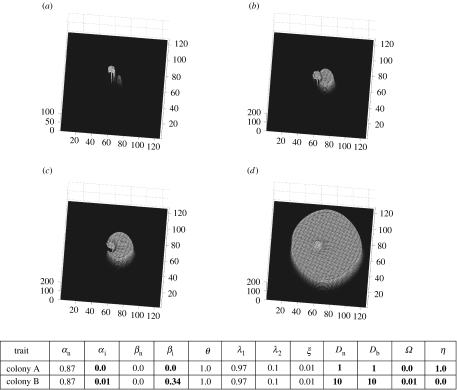
Replacement of one fungus by the other. Colony A (larger inoculum) is replaced by colony B (smaller inoculum). (a) t=1, (b) t=4 and (c) t=6 demonstrate the advancement of engulfment of one fungus by the other—the prelude to replacement. (d) t=14 shows necrotrophic replacement of colony B.
Figure 5.
Colony A is partially engulfed by colony B; (a,b) mycelial distributions at t=1 and 9, respectively.
Figure 6.
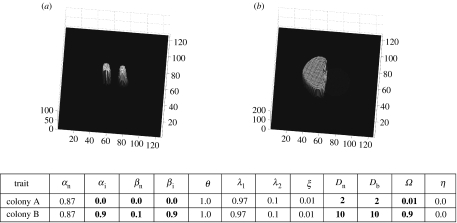
Trait sets are the same as in figure 4 but colony B's inhibitor production (Ω) is 0.9. Note that colony A is deadlocked but occupies more space than in figure 5. Also, colony B does not engulf colony A and its biomass distribution is very small, as colony B has invested heavily in inhibitor production; (a,b) mycelial distributions at t=1 and 9, respectively.
Figure 7.
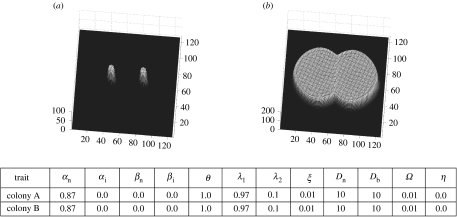
Trait sets of colony A and B are identical and are the same as colony A in figure 2. Since the genotypes are the same, colonies fuse into one individual; (a,b) mycelial distributions at t=1 and 7, respectively.
2.2 Scenario 2: the effect of resource quantity on interaction outcomes in a two-dimensional spatially homogeneous environment
Using the individuals of scenario 1 (simulation 1) that gave rise to deadlock, we investigate the effect of resource quantity on emergent mycelial distributions. The deadlock interaction outcome was investigated further as there are experimental studies (Stahl & Christensen 1992) demonstrating the effect of microclimatic variables on this outcome. We vary the amount of resource available in all cells of a homogeneous two-dimensional environment in order to determine its effect on the interaction between those colonies. In particular, we investigate the interaction outcomes with high (10) and low (0.01) resource levels.
2.3 Scenario 3: the effect of a three-dimensional porous architecture, i.e. a spatially heterogeneous environment, on interaction outcomes
Again using the individuals of scenario 1 (simulation 1), the impact of a porous architecture on the interaction outcomes is investigated. The porous architecture is generated using the same method outlined in Stacey et al. (2001) and Falconer et al. (2007). The environment is extended to three dimensions and each cell within that environment has a probability (1−p) that it is a pore, and in our simulations, we vary p between 0 and 1. This provides a porous architecture through which the colonies can grow, characterized by the bulk porosity measure, p, between 0 and 1. By using a random number generator 120 different porosity realizations, i.e. random structures, are obtained per bulk porosity (p). For each simulation, the fungal colonies are inoculated at opposite planes and grown through the structures. We determine the resulting crossing probabilities for each colony and for both colonies.
3. Results
The results of scenarios 1 and 2 are presented as total biomass distributions across the different fractions, i.e. insulated, non-insulated and mobile, at time points capturing the important features of the interaction dynamics. For simulations 1, 4, 5 and 6 of scenarios 1 and 2, this corresponds to the beginning and the end of the simulation. Additionally, the results of simulations 2 and 3 of scenario 1 show two intermediate time points that illustrate the complexity of the fungal interactions. The trait values of interacting fungi are given in each of the tables of figures 2–8. Results of scenario 3 are presented as a plot showing the effect of porosity on the probability that each and both colonies traverse the three-dimensional volume.
Figure 8.
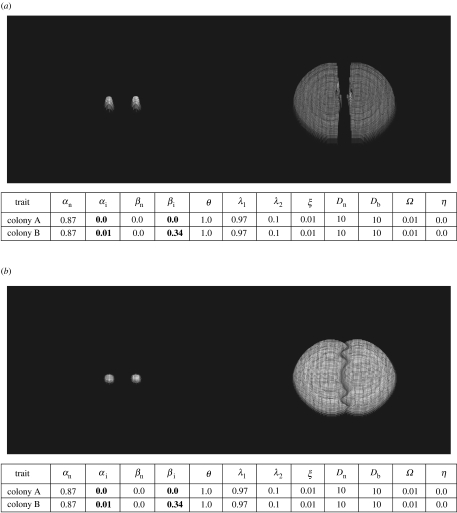
(a) High external resource results in deadlock; mycelial distributions at t=1 and 6. Colonies have the same trait sets as in figure 2 (b) Low external resource results in intermingling; mycelial distributions at t=1 and 6. Colonies have the same trait sets as in figure 2.
3.1 The effect of genotype on interaction outcomes in a two-dimensional spatially homogeneous environment
3.1.1 Simulation 1: deadlock
Both colonies produce an inhibitor field, and the detection of an inhibitor field that is non-self ceases local growth of both colonies. This interaction stops growth of both mycelia towards each other well before any mycelial contact is made, thereby resulting in deadlock (figure 2).
3.1.2 Simulation 2: engulfment
Engulfment of one colony by another occurs when one colony possesses inhibitor-producing capabilities (Ω>0). In figure 3, colony B does not release an inhibitor while colony A does. That colony A produces an inhibitor field affects the growth of colony B by ceasing its growth. Since colony B does not produce an inhibitor, colony A continues to grow, engulfing colony B as illustrated in figure 3b–d.
3.1.3 Simulation 3: replacement
Figure 4a shows the relative proportions of two inocula corresponding to two different mycelial genotypes. The smaller inoculum, colony B, has inhibitor-producing capabilities and no autophagy mechanism (Ω=0.01, η=0) while the more substantial inoculum, colony A, has autophagy capabilities but no inhibitor-producing mechanism (Ω=0, η=1). Owing to the release of inhibitor by colony B, colony A stops growing and is engulfed by colony B (figure 4b,c). Colony A exhibits autophagic properties and so the immobile biomass is converted into mobilized at a high rate and this is subsequently released into the environment. This sequestered resource may then be used by another organism, here colony B. The peak in figure 4d corresponds to the resources gained by colony B through necrotrophic lysis of colony A.
3.1.4 Simulations 4 and 5: inhibitor investment
Figures 5 and 6 show the outcome of two inocula where the investment in inhibitor production for colony B is varied between the simulations, i.e. Ω=0.01 and 0.9 for colony B in figures 5 and 6, respectively. In figure 5 colony B partially engulfs colony A. When colony B's investment in inhibitor is increased (figure 5), it does not engulf colony A but is deadlocked. Further, there is little biomass produced (same scale between figure 5 and figure 6 plots) by colony B while colony A's spatial coverage increases between figures 5 and 6.
3.1.5 Simulation 6: merging
In figure 7 the genotypes of both colonies are identical, and the same as colony A of simulation 1, with individuals possessing recycling and inhibitor-producing capabilities (Ω>0). For two colonies releasing inhibitor, deadlock, as in figure 2, would normally result. However, since these colonies are identical genetically, perfect fusion of the colonies occurs.
3.2 Scenario 2: the effect of resource quantity on interaction outcomes in a two-dimensional spatially homogeneous environment
In this scenario, we use colonies with the same trait values as the colonies of scenario 1 and simulation 1 (figure 2). The underlying external environmental resource base differs between them. In figure 8a the amount of resource in each cell is high (1.0) and this allows investment of uptake into inhibitor production. This in turn leads to deadlock as noted in §3.1.1. In figure 8b the genotypes are the same as in figure 8a but the resource level is much lower (0.01). This results in spatial intermingling of fungal biomass, where different colonies occupy and so share the same space, even though both colonies have inhibitor-producing capability, Ω>0. This sharing of space is due to there being little investment in inhibitor production since mobile biomass concentration is low. This is a consequence of low external resource combined with the colony genotype that defines a zero rate of mobilization of non-insulated biomass, a low mobilization rate of insulated biomass (0.34) and a slow rate of conversion (0.01) into insulated biomass.
Of note is the complex interaction front formed where colonies intermingle (figure 8b). In each colony, where the interaction front is close to the initial inoculum point, the biomass distribution is relatively smooth and a homogeneous interaction front is produced. However, where the interaction front is far away from that inoculum point, the front is more heterogeneous being irregular and ridged. The origin of these heterogeneities was investigated in Falconer et al. (2005) and was found to be a consequence of the mobile biomass concentration and recycling parameters. In this simulation, near to the centre of each interacting colony mobile biomass concentration is low. This means that there is little dynamic among the three biomass fractions resulting in a stabilized biomass distribution that becomes homogeneous over time due to biomass diffusion. In contrast, towards the periphery of each colony, the mobile biomass concentration is high, as a direct consequence of uptake, resulting in inter-conversion of three biomass fractions leading to a more heterogeneous form. Consequently, the interaction front reflects this mix of homogeneous and heterogeneous periphery formation.
3.3 Scenario 3: the effect of a three-dimensional porous architecture, i.e. a spatially heterogeneous environment, on interaction outcomes
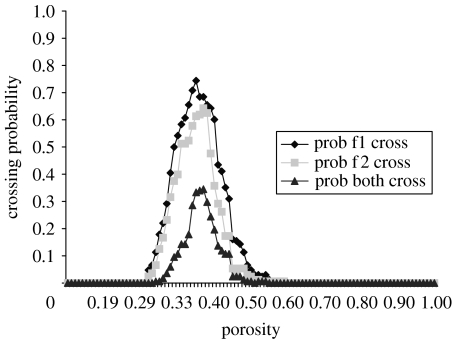
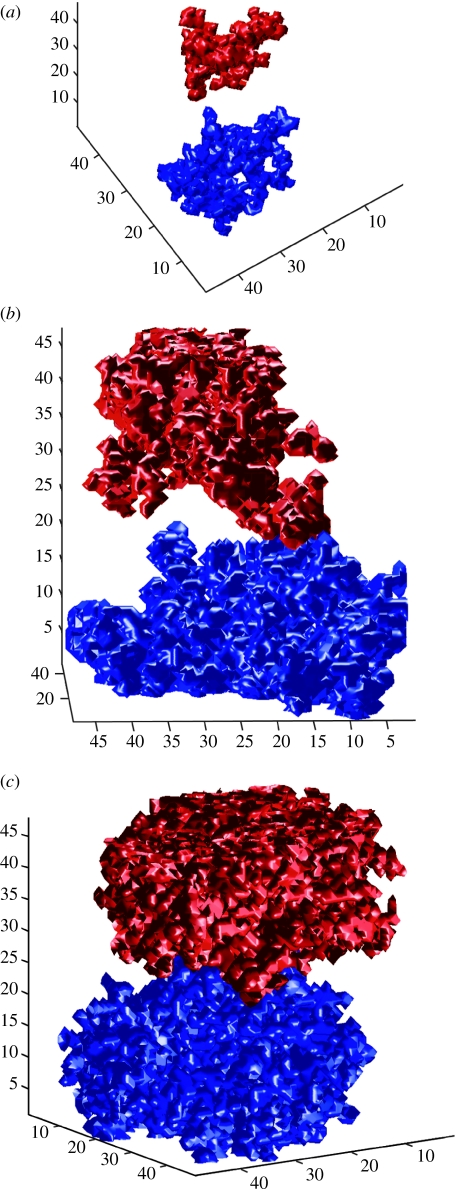
The interacting colonies A and B of figure 9 have the same trait values as the colonies of simulation 1. Figure 9 shows the probability that each and both colonies cross the porous environment for a given bulk porosity. There exists a limited range of porosity values (0.31–0.55) in which both fungi can cross the three-dimensional volume. At low porosities, i.e. p<0.31, crossing of both fungi is not possible due to limited pathways connecting the opposite planes. In these cases neither colony grows extensively through the volume (figure 10a). At intermediate porosities, there exist several connected paths from one side to the other and this allows individuals to grow from one side to the other while avoiding one another when crossing the environment (figure 10b). At high porosities, i.e. p>0.53, crossing of both fungi is precluded not by the environment but by the opposing fungus. Both fungi have secured most of the spatial territory at one or the other end of the volume, as determined by the inoculum point, resulting in complete deadlock due to inhibitor release (figure 10c).
Figure 9.
Probability of crossing for each and both colonies for various bulk porosities.
Figure 10.
Mycelial distributions affected by the porosity of the simulated structure. In (a) p=0.2 and there is no mycelial contact due to the constraints of the physical architecture (i.e. no pathway that connects the two individuals. In (b) p=0.4 and the colonies can grow past each other. In (c) p=0.7 complete deadlock due to inhibitor field as there exist many connected pathways.
4. Discussion
We present a model of fungal colony interactions based on an existing model of fungal colony growth and development (Falconer et al. 2005) together with an extension that encapsulates colony interactions in terms of inhibitor production. Using the model we are able to reproduce colony interaction outcomes observed in natural systems. In scenario 1, the model replicates deadlock, intermingling and replacement where the interaction outcomes are determined by the interacting genotypes. Shearer & Zare-Maivan (1988) showed that the deadlock may occur in the laboratory when two individuals with different genetic material interact and persistent deadlock was found between pairings of Phlebia radiata and Phlebia rufa (Griffith & Rayner 1994). Replacement has been observed in the laboratory between the pairings of Phlebia velutina and P. radiata and Calotes versicolor and P. radiata (Griffith & Rayner 1994). Baar & Stanton (2000) showed intermingling between compatible fungal types as well as deadlock, termed as inhibition at a distance in their paper, and replacement (engulfment followed by lysis) between incompatible types. The model also illustrates the cost of inhibitor production on biomass assimilation which may affect the fitness of an individual.
We achieve this using a model grounded in the mechanics of the natural system, where all of the physiological traits defining the colony are, in principle, measurable. Such a modelling framework permits an investigative approach (Marks & Lechowicz 2006), where we are able to explore and interpret the underlying mechanisms that lead to the colony formations. The only other modelling frameworks that we are aware of, which consider fungal interactions, are Davidson et al. (1996) and Bown et al. (1999). Davidson et al. (1996) consider fungal interactions in terms of a collision between two initially distinct activator concentrations (an initial activator concentration corresponds to a fungal inoculum). The interaction results in separation of fungal colonies, but this was induced via resource usage and not somatic incompatibility (non-self rejection). Further, this framework did not reproduce other interaction outcomes as it does not characterize the interaction process and does not have an explicit account of each interacting colony.
Likewise, the model presented in Bown et al. (1999) is not able to predict the interaction outcomes detailed here. That work, however, does show the importance of an explicit account of space on colony formation and subsequent inter-colony interactions, and the related experimental work of Sturrock et al. (2002) demonstrates the need to consider both spatial arrangement and environmental factors. The impact of environment on interaction outcomes is considered in scenario 2. The predicted outcomes of deadlock and intermingling in high and low resource environments, respectively, are consistent with the experimental results of Stahl & Christensen (1992), where results demonstrate that context does indeed affect interaction outcome. In Stahl & Christensen (1992), deadlock occurred, with a separation distance greater than 1.0 cm, when the colonies were grown in a resource-rich environment. In contrast, colonies intermingled neutrally in the plate cultures containing dilute cornmeal agar (low resource base).
In scenario 3, we consider space and in particular the porosity of a heterogeneous three-dimensional volume. We explore the probability that two fungi percolate the entire structure. Otten et al. (2004) show that, in the case of a single individual in two dimensions, a fungal invasion (percolation) can be stopped by a threshold population of randomly removed resource sites. Here we show that there also exist a lower and importantly an upper threshold below and above which both fungal colonies cannot traverse the spatial domain. The results show that context in terms of physical architecture plays a significant role in determining mycelial distributions. In particular, for soil environments, the pore geometry will to a large degree dictate the interaction outcome (Ritz 2004).
In our modelling framework, we are able to simulate a broad range of observed mycelial distributions and these arise from different realizations of the same fundamental set of processes that are characterized by different trait values and from different environmental contexts. The model shows how environmentally mediated cues are involved in emergent mycelial distributions and how sensitive the interaction outcomes are to environmental (resource level) and physical (pore architecture) contexts. It has been recently recognized that strategies that maintain fungal diversity should be encouraged as fungal diversity may have severe implications for ecosystem health and functioning (Swift 2005). In studies of plant ecosystem dynamics, the need to understand the mechanisms driving those dynamics is fundamental to our management of the system (Tilman 2000). Fungi play a vital role in these primary production systems (Bardgett et al. 2005, 2006) and, as in plants, in order to maintain fungal diversity in ecosystems, it is important to understand the underlying mechanisms determining the ecology of the fungal community. This modelling framework represents the first significant step towards such a fungal ecology by integrating a physiological representation of individuals and colony interactions where both are impacted on by spatial and resource heterogeneities.
Supplementary Material
Fungal deadlock
Fungal fusion
Fungal growth in porous media
References
- Ashford A, Allaway W. The role of the motile tubular vacuole system in mycorrhizal fungi. Plant Soil. 2002;244:177–187. doi: 10.1023/A:1020271121683. [DOI] [Google Scholar]
- Baar J, Stanton N.L. Ectomycorrhizal fungi challenged by saprotrophic basidiomycetes and soil microfungi under different ammonium regimes in vitro. Mycol. Res. 2000;104:641–768. doi: 10.1017/S0953756299002257. [DOI] [Google Scholar]
- Bardgett R, Bowman W.D, Kaufmann R, Schmidt S. A temporal approach to linking aboveground and belowground ecology. Trends Ecol. Evol. 2005;20:634–641. doi: 10.1016/j.tree.2005.08.005. [DOI] [PubMed] [Google Scholar]
- Bardgett R, Smith R.S, Shiel R.S, Peacock S, Simkin J.M, Quirk H. Parasitic plants indirectly regulate below-ground properties in grassland ecosystems. Nature. 2006;493:969–972. doi: 10.1038/nature04197. [DOI] [PubMed] [Google Scholar]
- Boddy L. Interspecific combative interactions between wood-decaying basidiomycetes. FEMS Microbiol. Ecol. 2000;31:185–194. doi: 10.1111/j.1574-6941.2000.tb00683.x. [DOI] [PubMed] [Google Scholar]
- Bown J.L, Sturrock C.J, Samson W.B, Staines H.J, Palfreyman J.W, White N.A, Ritz K, Crawford J.W. Evidence for emergent behaviour in the community-scale dynamics of a fungal microcosm. Proc. R. Soc. B. 1999;266:1947–1952. doi: 10.1098/rspb.1999.0871. [DOI] [Google Scholar]
- Bown J.L, Pachepsky E, Eberst A, Bausenwein U, Millard P, Squire G, Crawford J.W. Consequences of intraspecific variation for the structure and function of ecological communities: 1. Model development and predicted patterns of diversity. Ecol. Model. 2007;207:264–276. [Google Scholar]
- Cairns B.J, Ross J.V, Taimre T. A comparison of models for predicting population persistence. Ecol. Model. 2007;201:19–26. doi: 10.1016/j.ecolmodel.2006.07.018. [DOI] [Google Scholar]
- Cox G.M, Gibbons J.M, Wood A.T.A, Craigon J, Ramsden S.J, Crout N.M.J. Towards the systematic simplification of mechanistic models. Ecol. Model. 2006;198:240–246. doi: 10.1016/j.ecolmodel.2006.04.016. [DOI] [Google Scholar]
- Davidson F.A, Sleeman B.D, Rayner A.D.M, Crawford J.W, Ritz K. Context-dependent macroscopic patterns in growing and interacting mycelial networks. Proc. R. Soc. B. 1996;263:873–880. doi: 10.1098/rspb.1996.0129. [DOI] [Google Scholar]
- Ellis C.J, Crittenden P.D, Scrimgeour C.M, Ashcroft C.J. Translocation of 15N indicated nitrogen recycling in the mat-forming lichen Cladonia portentosa. New Phytol. 2005;168:423–434. doi: 10.1111/j.1469-8137.2005.01524.x. [DOI] [PubMed] [Google Scholar]
- Falconer R.E, Bown J.L, White N.A, Crawford J.W. Biomass recycling and the origin of phenotype in fungal mycelia. Proc. R. Soc B. 2005;272:1727–1734. doi: 10.1098/rspb.2005.3150. [DOI] [PMC free article] [PubMed] [Google Scholar]
- Falconer R.E, Bown J.L, White N.A, Crawford J.W. Biomass recycling: a key to efficient foraging by fungal colonies. Oikos. 2007;116:1558–1568. [Google Scholar]
- Griffith G.S, Rayner A.D.M. Interspecific interactions, mycelial morphogenesis and extracellular metabolite production in Phebia radiate (Aphyllophorales) Nova Hedw. 1994;59:331–334. [Google Scholar]
- Hietala A, Korhonen K, Sen R. An unknown mechanism promotes somatic incompatibility in Ceratobasidium bicorne. Mycologia. 2003;95:239–250. doi: 10.2307/3762035. [DOI] [PubMed] [Google Scholar]
- Johnson D, Kresk M, Wellington E, Stott A, Cole L, Bardgett R, Read D, Leake J. Soil invertebrates disrupt carbon flow through fungal networks. Science. 2005;309:1047. doi: 10.1126/science.1114769. [DOI] [PubMed] [Google Scholar]
- Lesser M.P. Experimental biology of coral reef ecosystems. J. Exp. Mar. Biol. Ecol. 2004;300:217–252. doi: 10.1016/j.jembe.2003.12.027. [DOI] [Google Scholar]
- Levi M.P, Merrill W, Cowling E.B. Role of nitrogen in wood detoriation, VI. Mycelial fractions and model nitrogen compounds as substrates for growth of Polyporus versicolor and other wood-destroying and wood-inhabiting fungi. Phytopathology. 1968;58:626–634. [Google Scholar]
- Lindahl B, Finlay R. Activities of chitinolytic enzymes during primary and secondary colonization of wood by basidiomycetous fungi. New Phytol. 2006;169:389–397. doi: 10.1111/j.1469-8137.2005.01581.x. [DOI] [PubMed] [Google Scholar]
- Lindahl S, Olsson S. Fungal translocation—creating and responding to environmental heterogeneity. Mycologist. 2004;18:79–88. doi: 10.1017/S0269915X04002046. [DOI] [Google Scholar]
- Marks C.O, Lechowicz M.J. A holistic tree seedling model for the investigation of functional trait diversity. Ecol. Model. 2006;193:141–181. doi: 10.1016/j.ecolmodel.2005.09.011. [DOI] [Google Scholar]
- Otten W, Bailey D, Gilligan C. Empirical evidence of spatial thresholds to control invasion of fungal parasites and saprotrophs. New Phytol. 2004;163:125–132. doi: 10.1111/j.1469-8137.2004.01086.x. [DOI] [PubMed] [Google Scholar]
- Pinan-Lucarre B, Balguere A, Clave C. Accelerated cell death in Podospora autophagy mutants. Eukaryot. Cell. 2005;4:1765–1774. doi: 10.1128/EC.4.11.1765-1774.2005. [DOI] [PMC free article] [PubMed] [Google Scholar]
- Rayner A.D.M, Webber J. Interspecific mycelial interactions—an overview. In: Jennings D.H, Rayner A.D.M, editors. The ecology and physiology of the fungal mycelium. Cambridge University Press; Cambridge, UK: 1984. pp. 383–417. [Google Scholar]
- Rayner A.D.M, Griffith G.S, Howard G.W. Induction of metabolic and morphogenetic changed during mycelial interactions among species of higher fungi. Biochem. Soc. Trans. 1994;22:389–394. doi: 10.1042/bst0220389. [DOI] [PubMed] [Google Scholar]
- Rayner A.D.M, Griffith G.S, Ainsworth A.M. Mycelial interconnectedness. In: Gow N.A.R, Gadd G.M, editors. The growing fungus. Chapman and Hall; London, UK: 1995. pp. 21–37. [Google Scholar]
- Reineking B, Veste M, Wissel C, Huth A. Environmental variability and allocation trade-offs maintain species diversity in a process-based model of succulent plant communities. Ecol. Model. 2006;199:486–504. doi: 10.1016/j.ecolmodel.2006.03.038. [DOI] [Google Scholar]
- Ritz K. Fungal roles in transport processes in soils. In: Gadd G.M, et al., editors. The roles and impact of fungi on biogeochemical cycles. Cambridge University Press; Cambridge, UK: 2004. pp. 51–74. [Google Scholar]
- Ritz K, Young I.M. Interactions between soil structure and fungi. Mycologist. 2004;18:52–59. doi: 10.1017/S0269915X04002010. [DOI] [Google Scholar]
- Shearer C.A, Zare-Maivan H. In vitro hyphal interactions among wood and leaf-inhabiting ascomycetes and fungi imperfecti from freshwater habitats. Mycologia. 1988;80:31–37. doi: 10.2307/3807490. [DOI] [Google Scholar]
- Smith S.E, Read D.J. Academic Press; San Diego, CA: 1997. Mycorrhizal symbiosis. [Google Scholar]
- Stacey A.J, Truscott J.E, Gilligan C.A. Soil-borne fungal pathogens: scaling-up from hyphal to colony behaviour and the probability of disease transmission. New Phytol. 2001;150:169–177. doi: 10.1046/j.1469-8137.2001.00082.x. [DOI] [Google Scholar]
- Stahl P.D, Christensen M. In vitro interactions among members of a soil microfungal community. Soil Biol. Biochem. 1992;24:309–316. doi: 10.1016/0038-0717(92)90190-9. [DOI] [Google Scholar]
- Sturrock C.J, Ritz K, Samson W.B, Bown J.L, Staines H.J, Palfreyman J.W, Crawford J.W, White N.A. The effects of fungal inoculum arrangement (scale and context) on emergent community development in an agar model system. FEMS Microbiol. Ecol. 2002;39:9–16. doi: 10.1111/j.1574-6941.2002.tb00901.x. [DOI] [PubMed] [Google Scholar]
- Swift M. Human impacts on biodiversity and ecosystem services: an overview. In: Dighton J, White J, Oudemans P, editors. The fungal community its organization and role in the ecosystem. Taylor & Francis Group; Boca Raton, FL: 2005. pp. 526–549. [Google Scholar]
- Tilman D. Causes, consequences and ethics of biodiversity. Nature. 2000;405:208–211. doi: 10.1038/35012217. [DOI] [PubMed] [Google Scholar]
- White N.A. The importance of wood-decay fungi in forest ecosystems. In: Arora D.K, editor. Fungal biotechnology in agriculture, food and environmental applications. Marcel Dekker; New York, NY: 2003. pp. 375–392. [Google Scholar]
- White N, Boddy L. Extracelluar enzyme location during interspecific fungal interactions. FEMS Microb. Ecol. 1992;98:75–80. doi: 10.1111/j.1574-6968.1992.tb05493.x. [DOI] [Google Scholar]
- Yang Y, Shipton W.A, Reddell P. Effects of phosphorus supply on in vitro growth and phosphotase activity of Frankia isolates from Casuarina. Plant Soil. 1997;189:75–79. doi: 10.1023/A:1004238021805. [DOI] [Google Scholar]
- Yorimitsu Y, Klionsky D.J. Autophagy: molecular machinery for self eating. Cell Death Differ. 2005;12:1542–1552. doi: 10.1038/sj.cdd.4401765. [DOI] [PMC free article] [PubMed] [Google Scholar]
Associated Data
This section collects any data citations, data availability statements, or supplementary materials included in this article.
Supplementary Materials
Fungal deadlock
Fungal fusion
Fungal growth in porous media


