Abstract
We used retrograde transneuronal transport of rabies virus from single muscles of rhesus monkeys to identify cortico-motoneuronal (CM) cells in the primary motor cortex (M1) that make monosynaptic connections with motoneurons innervating shoulder, elbow, and finger muscles. We found that M1 has 2 subdivisions. A rostral region lacks CM cells and represents an “old” M1 that is the standard for many mammals. The descending commands mediated by corticospinal efferents from old M1 must use the integrative mechanisms of the spinal cord to generate motoneuron activity and motor output. In contrast, a caudal region of M1 contains shoulder, elbow, and finger CM cells. This region represents a “new” M1 that is present only in some higher primates and humans. The direct access to motoneurons afforded by CM cells enables the newly recognized M1 to bypass spinal cord mechanisms and sculpt novel patterns of motor output that are essential for highly skilled movements.
Keywords: motor system, movement, rabies virus, cerebral cortex, spinal cord
The primary motor cortex (M1) is a major source of descending motor commands for voluntary movement. These commands originate, in part, from corticospinal (CST) neurons in cortical layer V, which have axons that descend to the spinal cord. CST neurons can be divided into 2 general types. One type has axons that terminate in the intermediate zone of the spinal cord, where they contact spinal interneurons. Some of these interneurons make connections with motoneurons and mediate part of the descending commands for movement. The second type of CST neuron has axons that terminate in the ventral horn of the spinal cord, where they make monosynaptic connections with motoneurons. These CST neurons are termed cortico-motoneuronal (CM) cells. CM cells, because of their direct connection with motoneurons, are thought to have a special role in the generation and control of highly skilled movements (1). We used retrograde transneuronal transport of rabies virus from single muscles of the shoulder, elbow, and finger to define the overall distribution of CM cells in M1 of rhesus monkeys. Here, we report the surprising observation that CM cells are almost entirely restricted to a caudal region of M1. Thus, M1 can be anatomically subdivided into a region that has direct control over motor output and a separate region that influences motor output only indirectly through spinal cord mechanisms.
Results
Location of CM Cells.
In 2 rhesus monkeys, we injected virus into the spinodeltoid (SpD) muscle, which assists in retraction of the shoulder. In another 2 monkeys, we injected virus into the lateral head of the triceps (lTri), which assists in elbow extension [for experimental details of each animal, see supporting information (SI) Table S1]. We also include additional analyses of material from a prior study, in which we injected virus into 3 different intrinsic and extrinsic finger muscles (2). In all of these experiments, the survival time after virus injection was set to allow retrograde transneuronal transport of virus to label only CM cells in the motor cortex (i.e., second-order neurons) (2).
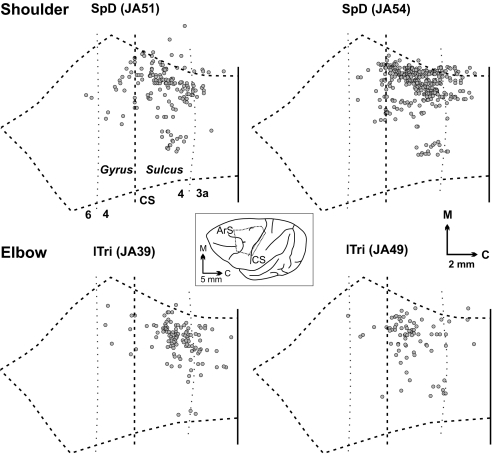
We found that the majority of CM cells (82–83%) labeled by virus transport from the SpD muscle were located in the caudal portion of M1 on the anterior bank of the central sulcus (CS) (Fig. 1Upper, Fig. 2A, and Fig. 3Upper Left). A few SpD CM cells also were located in the rostral portion of M1 on the convexity of the precentral gyrus (5–10%), and in area 3a at the bottom of the CS (7–13%). Most CM cells (72–88%) labeled by virus transport from the lTri muscle were located in caudal M1 (Fig. 1 Lower, Fig. 2B, and Fig. 3 Upper Center). A few lTri CM cells also were located in rostral M1 (4–6%) and in area 3a (6–24%). The results of virus injections into single finger muscles showed that most of their CM cells (78%) were located in caudal M1, and only a small number of these CM cells were located in rostral M1 (5%) and in area 3a (16%) (Figs. 2 and 3; see ref. 2). Clearly, CM cells that innervate the motoneurons of proximal and distal forelimb muscles are concentrated in a caudal portion of M1 that is buried in the CS.
Fig. 1.
Distribution of CM cells innervating the motoneurons of a shoulder or an elbow muscle. (Upper) Results from injections of rabies into the SpD muscle. (Lower) Results from injections into the lateral head of the lTri muscle. Each map shows an unfolded reconstruction of layer V from an experimental case. Each dot represents a labeled CM cell. In this and other figures, the vertical dashed line in each map represents the edge of the CS, and vertical dotted lines indicate the approximate location of cytoarchitectonic borders. The central Inset shows the general location of the reconstructed area on a lateral view of the macaque cerebral hemisphere. Note that most shoulder and elbow CM cells are located medially in the CS. ArS, arcuate sulcus; C, caudal; M, medial; Gyrus, crest of the precentral gyrus; Sulcus, anterior bank of the CS.
Fig. 2.
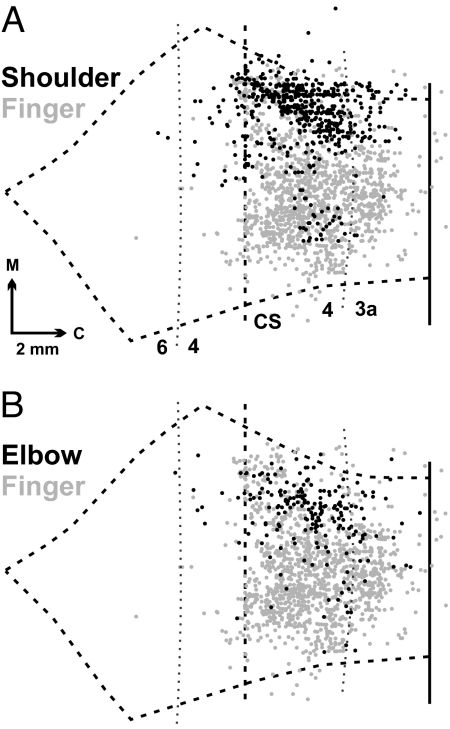
Overlap maps of CM cells innervating proximal versus distal muscles. (A) Black dots represent CM cells labeled by injections into SpD (n = 2). (B) Black dots represent CM cells labeled by injections into lTri (n = 2). Gray dots in A and B represent CM cells labeled after virus injections into finger muscles (ADP or ABPL) (from figure 3 in ref. 2). Note that some elbow and shoulder CM cells are found in regions of the CS where there is a high density of finger CM cells.
Fig. 3.
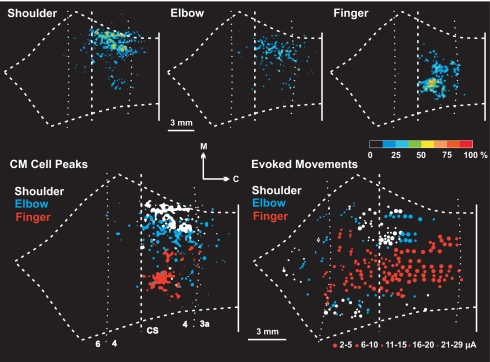
Topographic organization of CM cells in M1. (Upper) Density analysis of CM cells innervating shoulder (Left), elbow (Center), or finger (Right) motoneurons. The color scale at the right indicates the density of labeled neurons as percentages relative to the maximum peak density. Note the presence of a large medial group of shoulder CM cells along with a small lateral group. (Lower) (Left) Density peaks of shoulder (white), elbow (blue), and finger (red) CM cells. The cutoff for shoulder and finger CM cells, upper 75%; the cutoff for elbow CM cells, upper 87.5%. Note that in general the peak densities of shoulder and elbow CM cells are located medial to the peak density of finger CM cells. Even so, there is considerable intermingling of the different populations of CM cells. (Right) Results of intracortical stimulation (redrawn from ref. 3 with permission of the American Physiological Society). Colors indicate the movement evoked by threshold stimulation at each site: shoulder (white), elbow (blue), or finger (red). Symbol size indicates the threshold for each site (key below). In the CS, most shoulder and elbow sites were located medial to finger sites. However, a small number of high threshold shoulder and elbow sites were located more laterally in the CS. Compare the location of these sites with the small lateral group of shoulder CM cells shown in Upper Left.
Intermingling of CM Cells for Proximal and Distal Muscles.
We overlapped the maps of CM cells labeled after virus injections into SpD with the maps of CM cells labeled after virus injections into finger muscles (Fig. 2A). We performed the same procedure with the maps of CM cells for lTri and finger muscles (Fig. 2B). These “overlap” maps demonstrated that some shoulder and elbow CM cells were located in the region of the CS that contains many finger CM cells. Similarly, some finger CM cells were located in the region of the CS that contains many shoulder and elbow CM cells (Figs. 2 and 3; see ref. 3).
Somatotopic Organization of CM Cells.
Next, we performed a density analysis of the different populations of CM cells (Fig. 3 Upper). In every case, the peak density of CM cells was located in the anterior bank of the CS. Overall, SpD CM cells formed a large medial group and a small lateral group (Fig. 3 Upper Left). The distribution of lTri CM cells displayed a similar, although not as distinct, organization (Fig. 3 Upper Center).
We then overlapped maps of the upper 75% density of the SpD and finger CM cells and the upper 82.5% of the lTri CM cells (Fig. 3 Lower Left). Even when excluding less dense areas, the different populations of CM cells remained extensively intermingled. However, the densest region of finger CM cells was located lateral to the densest regions of elbow and shoulder CM cells. Also, the main clusters of elbow CM cells were shifted lateral to the main clusters of shoulder CM cells. The overlap and the spatial shift in the cell populations remained even when the cutoff was altered to include only the upper 50% of each population. This analysis provides clear evidence of a proximal to distal (medial to lateral) topography of arm representation within the caudal portion of M1. This topography is similar to the map of arm representation in caudal M1 generated by intracortical stimulation using short stimulus trains and low currents (<30 μA) (Fig. 3 Lower Right, replotted from ref. 3; see also Fig. 4B, which includes only results of stimulation at 2–5 μA).
Fig. 4.
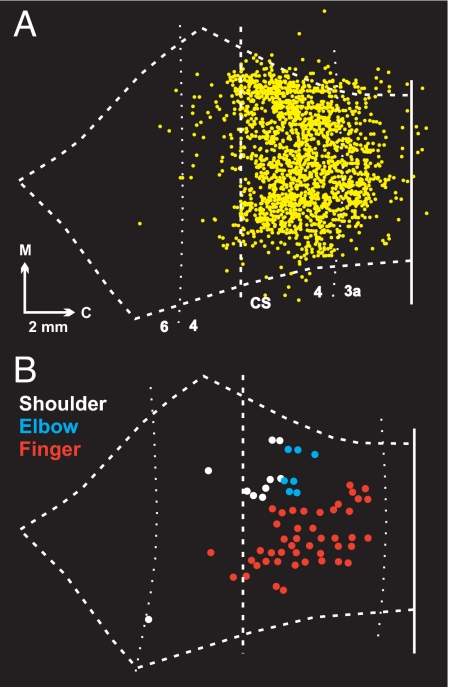
Correspondence between CM cells and low threshold sites. (A) Map of all CM cells (yellow dots) labeled by rabies injections into shoulder (SpD), elbow (lTri), and finger (ABPL, ADP, and EDC) muscles. The map is an overlap of the data presented in Fig. 1 and the data presented in figure 3 in ref. 2. (B) Plot of sites where intracortical microstimulation at the lowest threshold (2–5 μA) evoked shoulder (white), elbow (blue), and finger (red) movements (data from ref. 3). Note that the lowest threshold sites for evoking movement and CM cells are most concentrated in the caudal portion of M1 in the CS.
Maps of arm representation generated by intracortical stimulation also reveal the presence of a small lateral region of proximal representation in the CS, in addition to the large medial region of proximal representation (Fig. 3 Lower Right; see refs. 3 and 4). This lateral region displayed substantial overlap with the central core region of distal representation (e.g., figure 3 D and F in ref. 4). The thresholds for evoking proximal movements in the lateral region were generally higher than those in the medial region (Fig. 3 Lower Right). Indeed, none of the lowest threshold sites for evoking proximal movements were located in the lateral region of proximal representation (Fig. 4B). Nevertheless, there is a close correspondence between the lateral motor representation of proximal musculature and the small lateral groups of SpD and lTri CM cells (compare Fig. 3 Upper Left and Center with Fig. 3 Lower Right).
Correspondence Between CM Cells and Physiology.
We created a single map containing all of the CM cells labeled after virus injections into finger, elbow, and shoulder muscles (Fig. 4A). Although we have sampled only a fraction of the arm muscles that might be influenced by CM cells, it is clear that most CM cells are located in a caudal region of M1 that is in the CS, and only a few are located in the portion of M1 on the surface of the precentral gyrus. We replotted the data of Murphy and coworkers (3) to highlight the lowest threshold sites (2–5 μA) for evoking movement (Fig. 4B). This analysis shows that the lowest threshold sites for evoking proximal and distal movements were located largely in caudal M1 (Fig. 4B). Thus, there is an excellent fit between the location of CM cells (Fig. 4A) and the lowest threshold sites for evoking movement (Fig. 4B).
Third-Order Neurons.
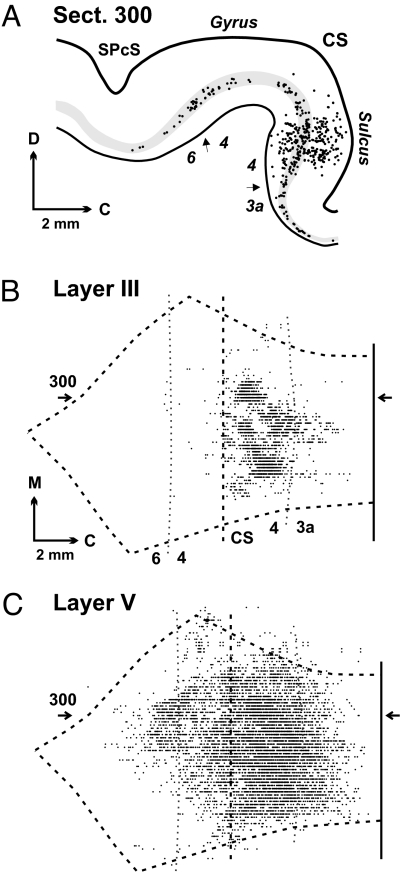
In another 8 animals (SpD, n = 4; finger muscles, n = 4), we set the survival time after a muscle injection to label not only second-order neurons (e.g., CM cells), but also third-order neurons (see Table S2). Potential third-order neurons include, but are not limited to, (i) cortical neurons in layers II, III, and VI that project directly to CM cells in layer V; (ii) CST neurons in layer V of M1 that make disynaptic connections with motoneurons; and (iii) cortical neurons in layer V that project to neurons in the red nucleus and brainstem that make monosynaptic connections with motoneurons.
When we prolonged the survival time to infect third-order neurons, we found substantial numbers of labeled neurons in layers above and below layer V (Fig. 5A). The labeling was especially dense in layer III. Labeled neurons in layer III, as well as those in layers II and VI, were largely restricted to the caudal portion of M1 in the CS (Fig. 5 A and B). Because intracortical input to layer V has a predominant vertical organization (5–7), the spatial location of these labeled neurons is consistent with our observation that CM cells (second-order neurons) are restricted to the caudal portion of M1.
Fig. 5.
Third-order neurons in motor cortex. We injected rabies virus into the ABPL muscle, and the survival time was set to allow labeling of third-order neurons (experiment JA29 in Table S2). (A) Plot of a sagittal section (300) through M1 showing labeled neurons (dots). Layer V is shaded gray. (B) Map of labeled neurons in layer III. (C) Map of labeled neurons in layer V. The location of section 300 is indicated on the maps by horizontal arrows. C, caudal; D, dorsal; M, medial; SPcS, superior precentral sulcus. Note that third-order neurons in layer III are largely confined to the caudal portion of M1 in the CS, whereas layer V neurons (second- and third-order) are found in rostral as well as caudal portions of M1.
With the longer survival time, labeled neurons in layer V were found in the rostral portion of M1 on the precentral gyrus, as well as in the caudal portion of M1 in the CS (Fig. 5 A and C). This observation is consistent with the known distribution of CST neurons in rostral and caudal M1 (8), as well as the preferential distribution of cortico-rubral neurons in rostral M1 (9). Thus, layer V neurons on the precentral gyrus were not labeled in experiments with the shorter survival time because these neurons have disynaptic connections with motoneurons, and not because they are incapable of transporting virus.
Discussion
The Distribution of CM Cells Subdivides M1.
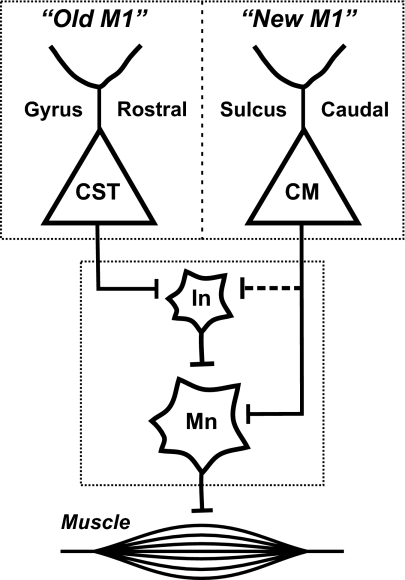
A new view of M1 organization emerges from these results (Fig. 6). Our findings indicate that M1 is subdivided into distinct rostral and caudal regions based on the differential distribution of CM cells. In macaques, the rostral region is located on the crest of the precentral gyrus, whereas the caudal region is buried in the anterior bank of the CS. Both regions of M1 have CST neurons (8). Indeed, the density of CST neurons in the 2 regions is comparable (8, 10). Almost all CST neurons in the more rostral region of M1 make monosynaptic connections with interneurons in the intermediate zone of the spinal cord (11). Thus, CST neurons in the rostral region influence motoneurons only indirectly by means of at least a disynaptic pathway. In contrast, there is a distinct population of CST neurons in the caudal region of M1 that makes monosynaptic connections with motoneurons in the ventral horn (CM cells). We have previously shown that some of these CM cells connect with motoneurons that innervate distal forelimb muscles (2). We now show that shoulder and elbow CM cells also are located largely in the caudal region of M1. In other words, almost all CM cells are confined to the caudal region of M1, and this region has direct access to motoneurons that control proximal as well as distal muscles.
Fig. 6.
New and old M1. New M1 is located caudally in the CS and has CM cells that make direct connections with motoneurons. In contrast, old M1 is located rostrally on the precentral gyrus and lacks CM cells. However, old M1 has CST neurons that influence motoneurons indirectly through their connections with spinal interneurons. CM, cortico-motoneuronal; CST, corticospinal; In, interneurons; Mn, motoneurons.
Functional Significance.
The subdivision of M1 into 2 regions has broad implications for the cortical control of movement. There are many species in which descending pathways from cortex (and brainstem) terminate largely on interneurons in the intermediate zone of the spinal cord (12). This is the case for CST neurons in the cerebral cortex of opossums, rodents, cats, and some monkeys. All of these animals lack substantial direct input to motoneurons. Instead, the CST system of these animals utilizes the integrative mechanisms of the spinal cord, such as spinal reflexes, “central pattern generators,” and “motor primitives” to generate a wide range of skilled motor behavior.
Monosynaptic input from the cerebral cortex directly to motoneurons is a relatively new phylogenetic development. This connection first gains prominence in some Old and New World monkeys and is greatly enhanced in great apes and humans (12). We and others have argued that the direct connection to motoneurons enables animals to build more flexible and complex patterns of muscle activity than are available when cortical output is mediated by less direct, spinal cord mechanisms. For example, cebus and squirrel monkeys live in the same ecological niche and have biomechanically similar hands. However, cebus monkeys have prominent direct cortical input to motoneurons (13), and can use relatively independent finger movements to pick up small objects and manipulate tools (14–16). In contrast, squirrel monkeys have, at best, weak direct input to motoneurons (13, 17, 18), and can pick up small objects only by using a sweeping motion of the hand that involves all of the fingers acting in concert. These and other observations suggest that the direct connection from the cortex to motoneurons provided by CM cells is an important part of the neural substrate for the enhanced manual dexterity of cebus monkeys, macaques, great apes, and humans. This substrate is likely to be essential for the capacity to manufacture and use tools.
“Old” and “New” M1.
When our results are viewed from this perspective, the rostral region that lacks CM cells represents an old area of M1 that is the standard for many mammals (12, 19). The caudal region that contains CM cells represents a new area of M1 that has been “added” during evolution. The direct access to motoneurons provided by CM cells may enable new M1 to generate novel patterns of muscle activity without the constraints imposed by the intrinsic circuitry of the spinal cord. We and others have previously argued that the overlap and intermingling of CM cells for different hand muscles enables M1 to create a wide variety of muscle synergies (2). Our current observation that elbow and shoulder CM cells are intermingled with finger CM cells suggests that the muscle synergies created by new M1 include multijoint as well as single-joint movements (20, 21).
The postnatal development of CM connections and motor skills provides further evidence for distinguishing between old and new M1. Cortical projections to the intermediate zone are present at birth in macaques, and they are distributed to the same areas of the intermediate zone as in the adult monkey. In contrast, direct connections to motoneurons are not present at birth in monkeys. Instead, the CM cell connection develops postnatally over the first few months of life and fully matures at ≈2 years of age (12, 22, 23). The anatomical development of this new system parallels the postnatal development of motor skills and, especially, the capacity to produce relatively independent movements of the fingers (22, 24). Thus, the CM cell system and new M1 are new from an ontogenetic as well as a phylogenetic perspective.
Prior Evidence for 2 M1s.
There have been prior suggestions in cats, monkeys, and humans that the forelimb representation in M1 contains rostral and caudal subdivisions (25–30). These subdivisions have been distinguished based on various features such as receptor binding, afferent inputs, motor outputs, patterns of activation, and the effects of lesions. In monkeys, the prior subdivisions of M1 have been largely confined to the representation of the distal forelimb (28–30). Thus, our results demonstrate that the subdivisions include the representation of the elbow and shoulder as well as the hand. Given the evidence for functional subdivisions in the distal hindlimb representation of M1 in monkeys (31), and the evidence for monosynaptic cortical input to face motoneurons (32), it is tempting to speculate that complete or nearly complete maps of the body are present in new and old M1.
CM Cells and Functional Classes of M1 Neurons.
The results of physiological studies suggest that new and old M1 are differentially involved in the generation and control of movement. Recently, Sergio et al. (33) reviewed data from various recording studies and proposed that neuron activity in rostral regions of M1 is correlated with the overall direction and kinematics of hand motion, whereas neuron activity in caudal regions of M1 is correlated with the temporal pattern of force production and the dynamics of motor output. Along similar lines, we found that M1 contains at least 2 distinct groups of neurons that encode movement in different reference frames (34). One group of neurons, termed “extrinsic-like,” displayed activity related to an abstract movement parameter, direction of action. Another set of neurons, termed “muscle-like,” displayed activity related to specific patterns of muscle activity. Perhaps muscle-like neurons are the physiological equivalent of CM cells in new M1. If this is the case, then CM cells could transmit descending commands about specific patterns of muscle activity in the same reference frame as their target motoneurons. The activity of these CM cells and new M1 could be especially important for sculpting novel patterns of motor output that are essential for highly skilled movements.
Methods
General Procedures.
This report is based on 12 experiments performed in rhesus monkeys (Macaca mulatta) (Tables S1 and S2). It also includes additional analysis of material from a prior study (2). In each animal, we injected rabies virus into a single forelimb muscle. All experimental procedures were conducted in accordance with National Institutes of Health guidelines and were approved by the relevant Institutional Animal Care and Use and Biosafety Committees. The procedures for handling rabies virus and animals infected with rabies have been described previously (35, 36) and are in accordance with the recommendations from the Department of Health and Human Services (Biosafety in Microbiological and Biomedical Procedures). Most of the procedures have been described in detail previously (2, 8). Thus, they will be summarized here.
Surgical Procedure, Experimental Animals, and Tissue Processing.
The injections of virus were performed under aseptic conditions on monkeys anesthetized with inhalation anesthesia (1.5–2.5% isoflurane in 1–3 L/min of O2). The target muscle was exposed and identified by its origin and insertion, coupled with electrical stimulation (0.2-ms pulses at 25 Hz for 1 s, at a maximum intensity of 15 V). Then the muscle was injected with a specific strain of rabies virus (N2c, 1 × 107.7 pfu/ml, provided by M. Schnell, Thomas Jefferson University, Philadelphia). After the injection, the wound was closed, the animal received an analgesic (buprenorphine, 0.01 mg/kg, i.m.), and it was transferred to an isolation room (Biosafety Level 2) for the survival period.
In a first group of experiments, we injected rabies into SpD (n = 2) or lTri (n = 2) muscles. We also included 5 experiments from a prior report (2), in which we injected 3 finger muscles: abductor pollicis longus (ABPL; n = 3), adductor pollicis (ADP; n = 1), or extensor digitorum communis (EDC; n = 1). The survival period for this group of animals (≈88 h for proximal muscles) was set to allow retrograde transport of virus from the injected muscle to its motoneurons (first-order neurons), and then retrograde transneuronal transport from the infected motoneurons to neurons that make monosynaptic connections with them (second-order neurons). In a second group of experiments, we injected rabies into ABPL (n = 1), EDC (n = 3), or SpD (n = 4) muscles. The survival period for this group of animals (≈96 h for proximal muscles) was set to allow an additional stage of retrograde transneuronal transport, from second- to third-order neurons.
At the end of the survival period, animals were deeply anesthetized (ketamine, 25 mg/kg, i.m. and Nembutal, 37 mg/kg, i.p.) and perfused through the heart with 0.1 M phosphate buffer (pH 7.4), followed by 10% buffered formalin, and finally a mixture of 10% buffered formalin and 10% glycerol at 4 °C (37). After the perfusion, the brain was extracted, stored overnight in 10% buffered formalin and 10% glycerol at 4 °C, then placed in 10% buffered formalin and 20% glycerol at 4 °C for 6–8 days. A block of tissue that contained the frontal and parietal lobes was frozen and sectioned serially (50 μm). Every tenth section was processed for cytoarchitecture by using a Nissl stain. Every other section was processed to identify neurons infected with rabies by using the avidin-biotin peroxidase method (Vectastain; Vector Laboratories), and a monoclonal antibody directed against the nucleoprotein of rabies virus (5DF12, diluted 1:100, supplied by A. Wandeler, Animal Diseases Research Institute, Ontario, Canada). Reacted sections were mounted on gelatin-coated glass slides, air dried, and coverslipped with Artmount.
Two-Dimensional Reconstruction of M1.
We examined sections from each animal by using bright-field, dark-field, and polarized illumination. Section outlines and labeled neurons were plotted by using optical encoders coupled to the microscope stage and a computer-based charting system (MD2 and MDPlot, AccuStage). Salient features, such as sulcal landmarks and cytoarchitectonic borders, were added to these charts. The charts were used to reconstruct a flattened map of the distribution of labeled neurons (for details, see refs. 2 and 8). Sections processed for cytoarchitecture were used to distinguish the boundaries of M1 with area 6 rostrally and with area 3a caudally. To compare the location of CM cells across experiments, we superimposed maps of labeled neurons by using 3 sulcal landmarks: the start of the CS, the genu of arcuate sulcus, and the superior precentral dimple. The maps were aligned on a common template taken from ref. 3 (for complete details, see ref. 2).
Peak Density Analysis.
To compare the location of CM cells innervating muscles acting at different joints, we generated separate “shoulder” and “elbow” maps by combining the results from experiments in which the same muscle was injected and the shorter survival time was used. We also generated a “finger” map by combining the results from the ADP and ABPL experiments (figure 3 in ref. 2). To generate these maps, the results from each animal were binned (200 × 200 μm), and the number of cells in each bin was counted. Next, for each pair of experiments, the values in corresponding bins were summed. Resultant values in the bins were normalized and expressed as a percentage of the maximum value. We then used a graphical analysis program (SURFER8, Golden Software) to generate contour maps by using the “natural neighbor” gridding method (Fig. 3).
Supplementary Material
Acknowledgments.
We thank Dr. M. Schnell (Thomas Jefferson University, Philadelphia) for supplying the N2c strain of rabies; Dr. A. Wandeler (Animal Disease Research Institute, Nepean, Ontario, Canada) for supplying antibodies to rabies; Ms. M. Watach and M. O'Malley for technical assistance; and M. Page for development of computer programs. This work was supported in part by the Office of Research and Development, Medical Research Service, Department of Veterans Affairs, National Institutes of Health Grants R01 NS24328 and P40 RR018604 (to P.L.S.), and a Pennsylvania Department of Health grant.
Footnotes
The authors declare no conflict of interest.
This article is a PNAS Direct Submission.
This article contains supporting information online at www.pnas.org/cgi/content/full/0808362106/DCSupplemental.
References
- 1.Porter R, Lemon RN. Corticospinal Function and Voluntary Movement. Oxford: Clarendon; 1993. p. 428. [Google Scholar]
- 2.Rathelot J-A, Strick PL. Muscle representation in the macaque motor cortex: An anatomical perspective. Proc Natl Acad Sci USA. 2006;103:8257–8262. doi: 10.1073/pnas.0602933103. [DOI] [PMC free article] [PubMed] [Google Scholar]
- 3.Kwan HC, MacKay WA, Murphy JT, Wong YC. Spatial organization of precentral cortex in awake primates. II. Motor outputs. J Neurophysiol. 1978;41:1120–1131. doi: 10.1152/jn.1978.41.5.1120. [DOI] [PubMed] [Google Scholar]
- 4.Park MC, Belhaj-Saïf A, Gordon M, Cheney PD. Consistent features in the forelimb representation of primary motor cortex in rhesus macaques. J Neurophysiol. 2001;21:2784–2792. doi: 10.1523/JNEUROSCI.21-08-02784.2001. [DOI] [PMC free article] [PubMed] [Google Scholar]
- 5.Lorente de Nò R. In: Physiology of the Nervous System. 3rd Ed. Fulton JF, editor. London: Oxford Univ Press; 1949. pp. 288–330. [Google Scholar]
- 6.Kaneko T, Cho R-H, Li Y-Q, Nomura S, Mizuno N. Predominant information transfer from layer III pyramidal neurons to corticospinal neurons. J Comp Neurol. 2000;423:52–65. doi: 10.1002/1096-9861(20000717)423:1<52::aid-cne5>3.0.co;2-f. [DOI] [PubMed] [Google Scholar]
- 7.Weiler N, Wood L, Yu J, Solla SA, Shepherd GMG. Top-down laminar organization of the excitatory network in motor cortex. Nat Neurosci. 2008;11:360–366. doi: 10.1038/nn2049. [DOI] [PMC free article] [PubMed] [Google Scholar]
- 8.Dum RP, Strick PL. The origin of corticospinal projections from the premotor areas in the frontal lobe. J Neurosci. 1991;11:667–689. doi: 10.1523/JNEUROSCI.11-03-00667.1991. [DOI] [PMC free article] [PubMed] [Google Scholar]
- 9.Humphrey DR, Gold R, Reed DJ. Sizes, laminar and topographic origins of cortical projections to the major divisions of the red nucleus in the monkey. J Comp Neurol. 1984;225:75–94. doi: 10.1002/cne.902250109. [DOI] [PubMed] [Google Scholar]
- 10.He SQ, Dum RP, Strick PL. Topographic organization of corticospinal projections from the frontal lobe: Motor areas on the lateral surface of the hemisphere. J Neurosci. 1993;13:952–980. doi: 10.1523/JNEUROSCI.13-03-00952.1993. [DOI] [PMC free article] [PubMed] [Google Scholar]
- 11.Kuypers HGJM, Brinkman J. Precentral projections to different parts of the spinal intermediate zone in the rhesus monkey. Brain Res. 1970;24:29–48. doi: 10.1016/0006-8993(70)90272-6. [DOI] [PubMed] [Google Scholar]
- 12.Kuypers HGJM. In: The Nervous System II. Brookhart JM, Mountcastle VB, editors. Bethesda: Am Physiol Soc; 1981. pp. 597–666. Handbook of Physiology. [Google Scholar]
- 13.Bortoff GA, Strick PL. Corticospinal terminations in two new-world primates: Further evidence that corticomotoneuronal connections provide part of the neural substrate for manual dexterity. J Neurosci. 1993;13:5105–5118. doi: 10.1523/JNEUROSCI.13-12-05105.1993. [DOI] [PMC free article] [PubMed] [Google Scholar]
- 14.Antinucci F, Visalberghi E. Tool use in Cebus apella: A case study. Int J Primatol. 1986;7:349–361. [Google Scholar]
- 15.Westergaard GC, Fragaszy DM. The manufacture and use of tools by capuchin monkeys (Cebus apella) J Comp Psychol. 1987;101:159–168. [Google Scholar]
- 16.Costello MB, Fragaszy DM. Prehension in Cebus and Saimiri. I. Grip type and hand preference. Am J Primatol. 1988;15:235–245. doi: 10.1002/ajp.1350150306. [DOI] [PubMed] [Google Scholar]
- 17.Maier MA, et al. Direct and indirect corticospinal control of arm and hand motoneurons in the squirrel monkey (Saimiri sciureus) J Neurophysiol. 1997;78:721–733. doi: 10.1152/jn.1997.78.2.721. [DOI] [PubMed] [Google Scholar]
- 18.Nakajima K, Maier MA, Kirkwood PA, Lemon RN. Striking differences in transmission of corticospinal excitation to upper limb motoneurons in two primate species. J Neurophysiol. 2000;84:698–709. doi: 10.1152/jn.2000.84.2.698. [DOI] [PubMed] [Google Scholar]
- 19.Nudo RJ, Masterton RB. Descending pathways to the spinal cord: A comparative study of 22 mammals. J Comp Neurol. 1988;277:53–79. doi: 10.1002/cne.902770105. [DOI] [PubMed] [Google Scholar]
- 20.Cheney PD, Fetz EE. Comparable patterns of muscle facilitation evoked by individual corticomotoneuronal (CM) cells and by single intracortical microstimuli in primates: Evidence for functional groups of CM cells. J Neurophysiol. 1985;53:786–804. doi: 10.1152/jn.1985.53.3.786. [DOI] [PubMed] [Google Scholar]
- 21.MacKiernan BJ, Marcario JK, Karrer J, Cheney PD. Correlations between corticomotoneuronal (CM) cell postspike effects and cell-target muscle covariation. J Neurophysiol. 2000;83:99–115. doi: 10.1152/jn.2000.83.1.99. [DOI] [PubMed] [Google Scholar]
- 22.Armand J, Olivier E, Edgley SA, Lemon RN. Postnatal development of corticospinal projections from motor cortex to the cervical enlargement in the macaque monkey. J Neurosci. 1997;17:251–266. doi: 10.1523/JNEUROSCI.17-01-00251.1997. [DOI] [PMC free article] [PubMed] [Google Scholar]
- 23.Olivier E, Edgley SA, Armand J, Lemon RN. An electrophysiological study of the postnatal development of the corticospinal system in the macaque monkey. J Neurosci. 1997;17:267–276. doi: 10.1523/JNEUROSCI.17-01-00267.1997. [DOI] [PMC free article] [PubMed] [Google Scholar]
- 24.Lawrence DG, Hopkins DA. The development of motor control in the rhesus monkey: Evidence concerning the role of corticomotoneuronal connections. Brain. 1976;99:235–254. doi: 10.1093/brain/99.2.235. [DOI] [PubMed] [Google Scholar]
- 25.Pappas CL, Strick PL. Anatomical demonstration of multiple representation in the forelimb region of the cat motor cortex. J Comp Neurol. 1981;200:491–500. doi: 10.1002/cne.902000404. [DOI] [PubMed] [Google Scholar]
- 26.Yumiya H, Ghez C. Specialized subregions in the cat motor cortex: Anatomical demonstration of differential projections to rostral and caudal sectors. Exp Brain Res. 1984;53:259–276. doi: 10.1007/BF00238155. [DOI] [PubMed] [Google Scholar]
- 27.Martin JH. Differential spinal projections from the forelimb areas of the rostral and caudal subregions of primary motor cortex in the cat. Exp Brain Res. 1996;108:191–205. doi: 10.1007/BF00228094. [DOI] [PubMed] [Google Scholar]
- 28.Strick PL, Preston JB. Two representations of the hand in area 4 of a primate. I. Motor output organization. J Neurophysiol. 1982;48:139–149. doi: 10.1152/jn.1982.48.1.139. [DOI] [PubMed] [Google Scholar]
- 29.Geyer S, et al. Two different areas within the primary motor cortex of man. Nature. 1996;382:805–807. doi: 10.1038/382805a0. [DOI] [PubMed] [Google Scholar]
- 30.Binkofski F, et al. Neural activity in human primary motor cortex areas 4a and 4p is modulated differentially by attention to action. J Neurophysiol. 2002;88:514–519. doi: 10.1152/jn.2002.88.1.514. [DOI] [PubMed] [Google Scholar]
- 31.Tanji J, Wise SP. Submodality distribution in sensorimotor cortex of the unanesthetized monkey. J Neurophysiol. 1981;45:467–481. doi: 10.1152/jn.1981.45.3.467. [DOI] [PubMed] [Google Scholar]
- 32.Morecraft RJ, Louie JL, Herrick JL, Stilwell-Morecraft KS. Cortical innervation of the facial nucleus in the non-human primate: A new interpretation of the effects of stroke and related subtotal brain trauma on the muscles of facial expression. Brain. 2001;124:176–208. doi: 10.1093/brain/124.1.176. [DOI] [PubMed] [Google Scholar]
- 33.Sergio LE, Hamel-Pâquet C, Kalaska JF. Motor cortex neural correlates of output kinematics and kinetics during isometric-force and arm-reaching tasks. J Neurophysiol. 2005;94:2353–2378. doi: 10.1152/jn.00989.2004. [DOI] [PubMed] [Google Scholar]
- 34.Kakei S, Hoffman DS, Strick PL. Muscle and movement representations in the primary motor cortex. Science. 1999;285:2136–2139. doi: 10.1126/science.285.5436.2136. [DOI] [PubMed] [Google Scholar]
- 35.Kelly RM, Strick PL. Rabies as a transneuronal tracer of circuits in the central nervous system. J Neurosci Methods. 2000;103:63–71. doi: 10.1016/s0165-0270(00)00296-x. [DOI] [PubMed] [Google Scholar]
- 36.Kelly RM, Strick PL. Cerebellar loops with motor cortex and prefrontal cortex of a nonhuman primate. J Neurosci. 2003;23:8432–8444. doi: 10.1523/JNEUROSCI.23-23-08432.2003. [DOI] [PMC free article] [PubMed] [Google Scholar]
- 37.Rosene DL, Mesulam MM. Fixation variables in horseradish peroxidase neurohistochemistry. I. The effects of fixation time and perfusion procedures on enzyme activity. J Histochem Cytochem. 1978;26:28–39. doi: 10.1177/26.1.413864. [DOI] [PubMed] [Google Scholar]
Associated Data
This section collects any data citations, data availability statements, or supplementary materials included in this article.


