

Abstract
Dentin sialophosphoprotein has been implicated in the mineralization process based on the defective dentin formation in Dspp null mice (Dspp-/-). Dspp is expressed at low levels in bone and Dspp-/- femurs assessed by quantitative micro-computed tomography (microCT) and Fourier transform infrared spectroscopic imaging (FTIRI) exhibit some mineral and matrix property differences from wildtype femurs in both developing and mature mice. Compared to wildtype, Dspp-/- mice initially (5 weeks) and at 7 months had significantly higher trabecular bone volume fractions and lower trabecular separation, while at 9 months, bone volume fraction and trabecular number were lower. Cortical bone mineral density, area, and moments of inertia in Dspp-/- were reduced at 9 months. By FTIRI, Dspp-/- animals initially (5 months) contained more stoichiometric bone apatite with higher crystallinity (crystal size/perfection) and lower carbonate substitution. This difference progressively reversed with age (significantly decreased crystallinity and increased acid phosphate content in Dspp-/- cortical bone by 9 months of age). Mineral density as determined in 3D micro-CT and mineral-to-matrix ratios as determined by 2D FTIRI in individual cortical and trabecular bones were correlated (r2=0.6, p<0.04). From the matrix analysis, the collagen maturity of both cortical and trabecular bone was greater in Dspp-/- than controls at 5 weeks; by 9 months this difference in cross-linking pattern did not exist. Variations in mineral and matrix properties observed at different ages are attributable, in part, to the ability of the Dspp gene products to regulate both initial mineralization and remodeling, implying an effect of Dspp on bone turnover.
Keywords: Dentin sialophosphoprotein, FTIR spectroscopic imaging, bone, micro-computed tomography, FTIRI
INTRODUCTION
Noncollagenous proteins are generally believed to actively regulate biomineral (hydroxyapatite, HA) crystal nucleation and growth during osteogenesis and dentinogenesis [1, 2], although the detailed mechanism of mineralization remains unknown. HA deposits in an oriented fashion on the collagenous matrix in bone and dentin associated with noncollagenous proteins. Many of these noncollagenous proteins belong to the SIBLING (Small Integrin Binding Ligand N-linked Glycoprotein) family of phosphorylated glycoproteins and are believed to play a crucial role in the biomineralization process. Family members include osteopontin (OPN), bone sialoprotein (BSP), dentin matrix protein 1 (DMP-1), matrix extracellular phosphoglycoprotein (MEPE), and dentin sialophosphoprotein (DSPP) [3]. The SIBLINGs, found clustered on human chromosome 4q21 [4] and mouse chromosome 5q21 [5], have many similarities: multiple phosphorylation sites, highly acidic nature, and the presence of an arginine-glycine-aspartate (RGD) cell attachment domain [3]. In vitro studies of HA formation and proliferation and characterization of the bones and teeth of mutant mice lacking one of the SIBLINGs have identified effects of osteopontin [6-8], bone sialoprotein [9-11], dentin matrix protein-1 [12-14], MEPE [15], and DSPP [16]. In cell-free in vitro studies, the major protein components of the Dspp gene, dentin sialoprotein and dentin phosphophoryn (also known as dentin phosphoprotein (DPP)) have been shown to regulate HA formation and growth [17-20].
Dspp was first cloned from developing teeth and thought to be tooth specific [21, 22]; later the Dspp gene was found to be expressed in bone [23], in neoplasms (e.g., breast and lung tumors [24], prostate tumors [25]), and in soft tissues such as the kidney [26] and salivary glands [27]. The mouse dspp gene contains five exons and four introns with exons 1-4 and part of exon 5 encoding the protein DSP, and the remainder of exon 5 encoding DPP [5]. While the gene product was originally believed to be cleaved into only two peptides [21], in the pig a third polypeptide, dentin glycoprotein (DGP), has been identified [28]. The entire intact protein encoded by the dspp gene has not yet been isolated.
Extensive evidence indicates dspp is important for dentin mineralization. For example, mutations in the dspp gene are found in dentinogenesis imperfecta (DGI), DGI-II and DGI-III family pedigrees [29,30]. The dspp-/- mice [16] have dentin defects that closely resemble DGI-III, with enlarged pulp chambers, increased width of predentin zone, hypomineralization, and pulpal exposures. Electron microscopy has revealed an irregular mineralization front and a lack of calcospherite coalescence in the dentin of these mice. Similarly, a mis-sense mutation in the signal peptide domain, most likely leading to the loss of both DSP and DPP, has been identified in a family afflicted with dentin dysplasia type II (DD type II) [31].
Since dspp is also expressed in bone [23], we postulated that there would be mineral-associated changes in the bones of the Dspp-/- mice. Fourier-transform infrared spectroscopic imaging (FTIRI) and quantitative micro-computed tomography (micro-CT) were used to characterize mineral and matrix of the bones of male 5 week-old and 7 and 9 month-old Dspp-/- mice and their corresponding wildtype controls, (Dspp+/+).
MATERIALS AND METHODS
Experimental mice
Dspp-/- mice were developed at National Institute of Dental and Craniofacial Research, NIH as described earlier [16]. In these mice, the Dspp coding sequence was disrupted by inserting a promoterless beta-galactosidase (lacZ) gene. The Dspp+/- mice were backcrossed to C57Bl/6 mice to obtain F7 generation of Dspp-/- mice. All mice were housed and cared for as per the National Institutes of Health guidelines.
Femurs from four to twelve mice were obtained from Dspp+/+ and Dspp-/- male mice at 5 weeks, 7 months, and 9 months. The bones were cleaned of soft tissue, stored in 90% ethanol, and used first for micro-computed tomography (micro-CT) as described below. The proximal ends the femur were then separated and embedded in Spurr’s medium (Electron Microscopy Science Inc., Hatfield, PA, USA). Longitudinal non-decalcified sections of the proximal ends (four sections per bone) were cut using a HM360 microtome (Microm International Gmbh, Walldorf, Germany) at 2 μm thickness and mounted on barium fluoride (BaF2) infrared windows (Spectral Systems Inc., Hopewell Junction, NY, USA) for FTIRI analyses. Samples of tibiae taken at 15 days post natal and at 5 weeks were cut at 5 μm thickness and stained for the expression of lac-Z or by the von Kossa technique and then counterstained with hematoxylin and eosin.
General characterization
Prior to embedding bones, microradiography was used to provide fine focus radiographic images with a standard setting of 20 kV, 90 s on a Model MX20 Faxitron (Faxitron X-ray Corporation, Heeling, IL, USA). Images were scanned using a computerized image analysis system to assess qualitative differences in size, shape, and density.
Micro-computed tomography (Micro-CT)
Femoral 3-D morphology was determined from whole femurs by micro-CT (Enhanced Vision Systems Model MS-8 In Vitro Micro-CT Scanner; GE Healthcare, London, Ontario, Canada). Femora, cleaned of soft tissue, were scanned four at a time in saline (0.9% sodium chloride; Baxter Healthcare, Deerfield, IL, USA). To minimize noise, a large number of views (400), increased frame averaging (7 frames/view), and increased shutter exposure time (3000 msec) were used, resulting in 4-hr scans at 12 μm isotropic voxel resolution. A multi-level phantom was included to calibrate the attenuation levels (Hounsfield units) to mineral density (g/cc). A modified Parker algorithm was used during reconstruction. Cortical and cancellous volumes of interest (VOI) were extracted and segmented using individual thresholds determined from the attenuation histogram of the VOI and fitting the data with the Otsu method [33]. Thresholding, volume selection and morphometric analyses were preformed with the system software (Microview Version 1.1, GE Healthcare) as detailed elsewhere [32]. At the mid-diaphysis, a 1.7-mm high segment was analyzed centered at the midsection. For the proximal femur, a 0.84-mm high cancellous volume was segmented and analyzed. Morphometric parameters included bone length, bone area, cortical principal and polar moments of inertia and ellipticity, cancellous bone volume fraction, and trabecular thickness, separation and number [32]. Mean and standard deviations for each parameter from each group of mice with the same genotype were calculated.
Fourier transform infrared spectroscopic imaging (FTIRI)
Sections of proximal femurs were examined by FTIRI using a Perkin Elmer Spotlight Imaging system (Perkin Elmer Instruments, Shelton, CT, USA). Cortical and trabecular bone were examined separately. The spectral resolution was either 4 cm−1 the spatial resolution was ~7 μm. Spectra were transferred to yield images corresponding to infrared band areas, peak height ratios, and integrated area ratios by a combination of instrument software and ISYS Chemical Imaging Software (v 2.1; Spectral Dimensions Inc., Olney, MD, USA), as reviewed elsewhere [34]. Background spectra were collected under identical conditions from the same BaF2 windows. After acquisition, spectra were truncated to allow analysis of the spectral data of interest and zero-corrected for the baseline, and the spectral contribution of embedding media subtracted using ISYS software. Four spectroscopic parameters [34] were calculated from the imaging data: mineral-to-matrix ratio, crystallinity, carbonate-to-phosphate ratio, and collagen cross-link ratio (XLR). The mineral-to-matrix ratio (integrated areas ratio of the v1, v3 PO4 band [900–1200 cm−1]/ amide I band [1590–1720 cm−1]) corresponds to ash weight measurements. Mineral crystallinity corresponds to the crystallite size and perfection as determined by X-ray diffraction, and was calculated from the intensity ratios of subbands at 1030 (stoichiometric HA) and 1020 cm−1 (nonstoichiometric HA). XLR is a parameter reflecting the relative ratio of nonreducible and reducible collagen cross-links in the bone, expressed as the absorbance ratio at two specific wavenumbers (1660 and 1686 cm−1). In the spectral images, pixels devoid of bone (no mineral and/or matrix spectral signature) were set equal to zero and masked to be excluded from calculations. The spectroscopic results were expressed as histograms describing the pixel distribution of parameters above, mean values, and standard deviations of the pixel distribution and corresponding color-coded images were generated using ISYS software (Olney, MD). Means and standard deviations were averaged for multiple sites in each animal and among the different mice for each age and genotype (EXCEL, Microsoft Corp., Redwood Shores, CA, USA).
To improve signal to noise ratio, the spectroscopic parameters were recalculated on single spectra (“cortical” or “trabecular”) representing all the data from cortical or trabecular fields in each image. After spectral subtraction of the embedding medium and spectral masking of the background in every scanned field, spectral data from all the pixels in the field were summed in one spectrum (summed spectrum) using a function of the processing software. Summed spectra from the three cortical or trabecular fields analyzed in each animal were in turn co-added to produce the final “cortical” or “trabecular” single spectrum that contained all the information from the respective fields analyzed for every sample. To equalize sample sizes 5 animals in each group were used. The phosphate contours in the single spectra were also deconvoluted by curve-fitting using public domain software (Moffat, Canadian Research Council), as described in detail elsewhere [8]. Parameters calculated in addition to those described above were the 1030/1020 peak area ratio which is a more sensitive measure of crystal size/perfection [35] and the relative acid phosphate content, defined as the ratio of the integrated areas of the 1123 cm-1 and 960 cm-1 subbands [36].
Statistical analysis
Departures from normal distribution were assessed graphically and by the Kolmogorov-Smirnov test. None of the outcome variables departed from normality. Data were analyzed by two-factor ANOVA with interaction. The first factor was genotype (Dspp+/+ and Dspp-/-), and the second factor was age (5 week, 7 month, and 9 month). The ANOVA type I error rate was set at 0.05. If the interaction term between genotype and age was significant, the conclusion was drawn that the effect of genotype was dependent on age. This gave justification for examining effects of genotype separately for each age. Posthoc comparisons were made using Tukey pairwise mean comparison tests. The Tukey experiment-wise error rate was set at 0.05. If the ANOVA interaction term was not significant, the main effects were examined. If the main effect of genotype was significant, contrasts among levels of genotype were tested. The contrast error rate was set at 0.05. Analyses were conducted using SYSTAT Statistics I (SPSS Inc., Chicago, IL, USA). Where simple one way Anova (comparing the means of four groups) were involved, Tukey comparisons were performed using GraphPad InStat (GraphPad Software, Inc. San Diego, CA, USA). To compare BMD and mineral-to-matrix ratios in the same bones, linear regressions were performed using the mean values for FTIRI data from the trabecular and cortical bones as a function of the measured BMD in that region.
RESULTS
General Properties
Histological analysis of lacZ stained sections of the Dspp-/- tibia and femur revealed no morphologic abnormalities at either 15 days post-natal (Figure 1A) or 5 weeks (Figure 1B). In day 15 tibias, substantial expression of Dspp (as indicated by lacZ staining (arrows)) was seen in trabecular and cortical bone, including the secondary ossification center; however, by 5 weeks, dspp expression was detected only in the primary spongiosa (Figure 1B). Weight gain was not significant although the older mice tended to be lighter (data not shown); however the lengths of the Dspp-/- femurs were significantly shorter by 9 months (Table 1).
Figure 1.
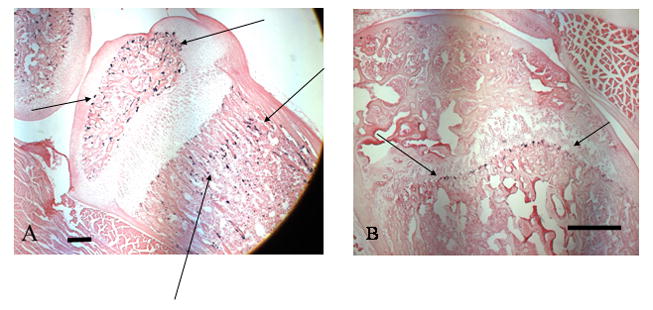
Photomicrographs of Dspp-/- mice tibias showing lacZ expression (arrows) at 15 days post natal (A) and 5 weeks (B). Note the absence of label at sites other than the secondary ossification center (arrows) in the 5 week old Dspp-/- animals. Scale is 50 μm.
Table I.
Lengths of Femora of the Dspp-/- and Dspp+/+ Mice
| Parameter | Genotype | 5 wk | 7mo | 9 mo |
|---|---|---|---|---|
| Length | Dspp+/+ | a | 16.38+0.48 | 16.95+0.29 |
| Dspp-/- | a | 16.85+0.47 | 16.11+0.47**,*** |
length could not be determined at 5 wks as bones had been split in approximately half prior to micro-CT analyses.
p<0.01 vs. same genotype at younger age;
p<0.01 vs. Dspp+/+ of same age.
At 5 weeks and 7 months of age there were no apparent gross morphological changes in the Dspp-/- femora as compared with Dspp+/+ femora as seen from fine focus radiographs (Figure 2A) and micro-CT (Figure 2B). Half femurs are shown for the Dspp+/+ reconstructions at 5 weeks because the bones were inadvertently split prior to data collection.
Figure 2.

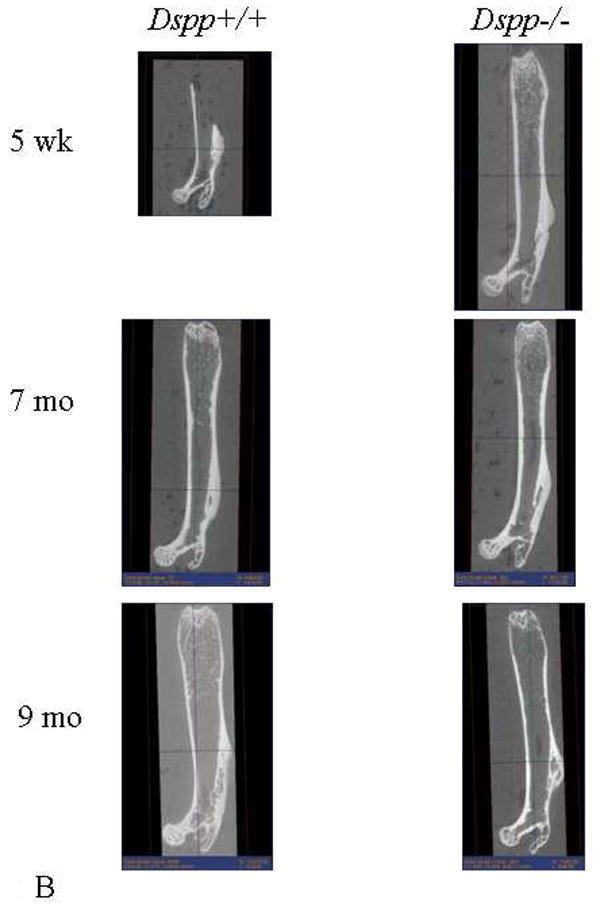
A) Typical fine focus radiograph of a femur from a 7 month-old Dspp+/+ and Dspp-/- mouse.
B) Micro-CT reconstruction of the femora of the Dspp+/+ and Dspp-/- mouse.
Morphology and Mineral Properties of Femora from Micro-CT
Compared to the Dspp+/+ controls there were no statistically significant changes in calculated micro-CT parameters for Dspp-/- cortical bone at 5 weeks and 7 months (Table 2A). In the cortical bones of the Dspp-/- mice at 9 months of age bone mineral density, cortical area, and polar moment of inertia were decreased relative to the Dspp+/+ mice.
Table 2.
Micro-CT Parameters in the Dspp-/- and Dspp+/+ Mouse Femora (mean ± SD)
| Parameter | 5 wk Dspp+/+ n=4 | 5 wk Dspp-/- n=4 | 7 mo Dspp+/+ n=7 | 7 mo Dspp-/- n=9 | 9 mo Dspp+/+ n=9 | 9 mo Dspp-/- n=12 |
|---|---|---|---|---|---|---|
| A. Cortical Bone | ||||||
| BMD (mg/cc) | 877
(29) |
948.
(63) |
1090.
(44) |
1058.
(55) |
1089
(17) |
1053.**
(39) |
| Ixx (mmˆ4) | 0.33
(0.04) |
0.33
(0.03) |
0.29
(0.12) |
0.30
(0.12) |
0.50
(0.07) |
0.25 ***
(0.08) |
| Iyy (mmˆ4) | 0.12
(0.05) |
0.14
(0.05) |
0.19
(0.06) |
0.22
(0.04) |
0.27
0.03 |
0.14 ***
0.06 |
| J (mmˆ4) | 0.45
(0.24) |
0.48
(0.14) |
0.48
(0.16) |
0.52
(0.14) |
0.76
(0.11) |
0.40 ***
(0.14) |
| Area (mmˆ2) | 0.91
(0.14) |
1.049
(0.10) |
2.02
(0.43) |
2.08
(0.44) |
2.66
(0.04) |
1.96 ***
(0.05) |
| Ellipticity | 2.69
(0.066) |
2.33
(0.066) |
0.21
(0.10) |
0.26
(0.08) |
1.86
(0.14) |
1.71
(0.24) |
| B. Trabecular Bone | ||||||
| BMD(mg/cc) | 717.
53 |
761.
50. |
720
64 |
658*
70. |
745
102 |
704
111 |
| BVF | 0.163
0.013 |
0.22**
0.03 |
0.185
0.055 |
0.28**
0.08 |
0.25
0.06 |
0.148***
0.04 |
| Tb.Th | 0.038
0.011 |
0.0493
0.012 |
0.05
0.01 |
0.046
0.011 |
0.053
0.028 |
0.056
0.023 |
| Tb.N | 5.24
0.53 |
5.66
0.25 |
4.0
1.2 |
6.5*
3. 1 |
5.09
1.2 |
2.9***
1.1 |
| Tb.Sp | 0.153
0.011 |
0.13*
0.010 |
0.22
0.07 |
0.13**
0.05 |
0.15
0.04 |
0.28**
0.09 |
Comparison to Dspp+/+ at same age,
p<0.05,
p<0.01,
p<0.001
BMD = thresholded tissue mineral density calculated from bone mineral in volume of interest/total volume
BVF= Bone volume fraction (Bone volume/total volume)
Area = cortical area
Ixx = maximum principal moment of inertia in plan of cross-section
Iyy= minimum principal moment of inertia in plane of cross-section
J= polar moment of inertia
Tb.Th = trabecular thickness
Tb.N = trabecular number
Tb.Sp = trabecular separation
In the Dspp-/- trabecular bone at 5 weeks, bone volume fraction was significantly greater and trabecular spacing was lower than in the Dspp+/+ (Table 2B). At 7 months the Dspp-/- femoral trabeculae were significantly less dense than those from the Dspp+/+ mice, the bone volume fraction remained larger, and the trabecular spacing was lower with the trabecular number greater. At 9 months, the Dspp-/- mice femora, in contrast, had lower bone volume fraction and trabecular number, and greater trabecular spacing (Table 2B).
FTIRI of Dspp+/+ and Dspp-/-Mice Femora
The spectroscopic parameters measured in the of bones of Dspp+/+ and Dspp-/- mice are summarized in Table 3, with typical images and their respective pixel histograms presented for the 5 wk data in Figure 3. The text below summarizes the findings, and their agreement when different processing methods were used, as well as their correlation with the micro-CT data.
Table 3.
FTIRI Parameters Measured in Images and Co-added Spectra of Dspp-/- and Dspp+/+ Mice Femora
| A. Cortical Bone | |||||||
|---|---|---|---|---|---|---|---|
| Parameter | 5 wk Dspp+/+ n=6 | 5 wk Dspp-/- n=5 | 7 mo Dspp+/+ n=7 | 7 mo Dspp-/- n=7 | 9 mo Dspp+/+ n=9 | 9 mo Dspp-/- n=6 | |
| Min/Mat | (imaging) | 7.0
(1.4) |
7.4
(0.4) |
7.5
(0.7) |
6.7
(0.4) |
6.8
(0.7) |
7.1
(0.6) |
| (co-added) | 7.3
(0.1) |
7.6
(0.7)* |
7.2
(0.8) |
7.5
(1.2) |
7.0
(0.2) |
6.9
(0.3) |
|
| CO3/PO4 | (imaging) | 0.0087
(0.0006) |
0.0068*
(0.0016) |
0.0066
(0.0004) |
0.0064
(0.001) |
0.0080
(0.0006) |
0.0077
(0.0008) |
| (co-added) | 0.0060
(0.0008) |
0.0048
(0.0002) * |
0.0069
(0.0009) |
0.0072
(0.0009) |
0.0067
(0.0005) |
0.009
(0.001) |
|
| Crystallinity | (imaging) | 1.15
(0.02) |
1.18
(0.03) |
1.12
(0.07) |
1.15
(0.06) |
1.13
(0.04) |
1.09
(0.03) |
| (co-added) | 1.090
(0.004) |
1.21
(0.03)* |
1.17
(0.03) |
1.18
(0.05) |
1.21
(0.03) |
1.16
(0.02)* |
|
| (curvefit) | 1.04
(0.14) |
1.19
(0.06)* |
1.07
(0.08) |
1.22
(0.08)* |
1.18
(0.02) |
1.16
(0.04) |
|
| XLR | (imaging) | 2.85
(0.10) |
4.0
(0.3)** |
3.4
(0.1) |
3.1
(0.1) |
3.2
(0.2) |
3.0**
(0.1) |
| (co-added) | 2.40
(0.10) |
4.13
(0.3)* |
3.9
(0.3) |
4.1
(0.4) |
3.91
(0.06) |
4.0
(0.3) |
|
| Acid P | (curvefit) | 1.96
(0.09) |
1.15
(0.40)* |
1.4
(0.5) |
2.0
(0.7) |
3.0
(1.3) |
0.7
(0.2)* |
| B. Trabecular Bone | |||||||
| Parameter | 5 wk Dspp+/+ n=6 | 5 wk Dspp-/- n=5 | 7 mo Dspp+/+ n=7 | 7 mo Dspp-/- n=7 | 9 mo Dspp+/+ n=9 | 9 mo Dspp-/- n=6 | |
| Min/Mat | (imaging) | 5.52
(1.11) |
5.16
(0.75) |
4.84
(1.01) |
5.70
(0.83) |
4.50
(0.87) |
4.86
(0.73) |
| (co-added) | 7.05
(0.75) |
5.73
(0.25)* |
5.22
(0.78) |
6.13
(0.59) |
5.23
(0.44) |
5.01
(0.50) |
|
| CO3/PO4 | (imaging) | 0.0079
(0.0009) |
0.0069
(0.0022) |
0.0067
(0.0013) |
0.0052**
(0.0007) |
0.0088
(0.0040) |
0.0066
(0.0009) |
| (co-added) | 0.0045
(0.0010) |
0.0070
(0.0011)* |
0.0063
(0.0009) |
0.0056
(0.0003) |
0.0074
(0.0011) |
0.0089
(0.0014) |
|
| Crystallinity | (imaging) | 1.080
(0.001) |
1.08
(0.04) |
1.07
(0.01) |
1.15**
(0.02) |
1.09
(0.05) |
1.05
(0.05) |
| (co-added) | 1.058
(0.006) |
1.081
(0.048) |
1.132
(0.078) |
1.172
(0.029) |
1.134
(0.045) |
1.095
(0.040) |
|
| Curvefit | 0.99
(0.11) |
1.35
(0.24)* |
1.50
(0.30) |
1.44
(0.20) |
1.11
(0.06) |
1.34
(0.11)* |
|
| XLR | (imaging) | 2.87
(0.29) |
3.80**
(0.20) |
2.72
(1.05) |
2.46
(0.56) |
3.59
(0.34) |
3.44
(0.47) |
| XLR | (co-added) | 2.42
(0.16) |
4.17
(0.48)* |
3.28
(0.22) |
3.63
(0.25)t |
3.64
(0.41) |
3.64
(.40) |
| Acid P | Curvefit | 2.30
(0.70) |
2.30
(.50) |
2.41
(0.60) |
3.06
(0.70) |
1.73
(0.37) |
2.31
(0.40)* |
Mean (standard deviation) –*p<0.05 (n=5) Comparison to Dspp+/+ of same age,
p<0.05,
p<0.01,
Min/Mat = peak area ratio of integrated areas of phosphate/amide I bands
CO3/PO4 = peak area ratio of integrated areas of carbonate (850-890 cm-1)/phosphate bands
Crystallinity = peak height intensity of subbands at 1030 cm-1(stoichiometric apatite) / 1020 cm-1 (non-stoichiometric apatite)
XLR = collagen cross link ratio; peak height intensity ratio of subbands at 1660 cm-1 /1683 cm-1
Figure 3.
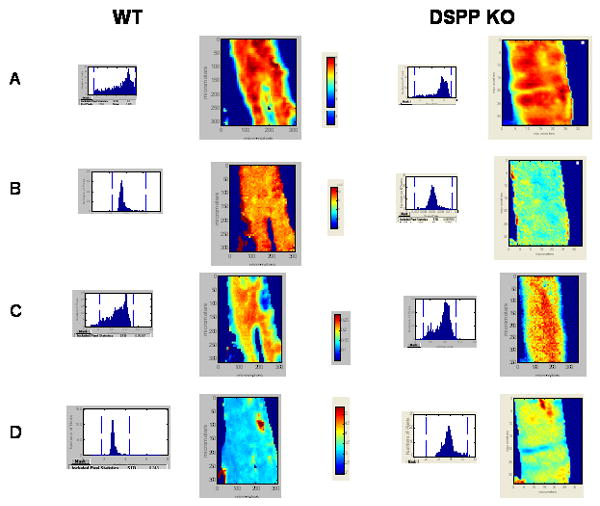
Typical FTIRI images illustrating differences and similarities at 5 weeks in the cortical bone of the Dspp+/+ (WT) and Dspp-/- (KO) mice. A) mineral-to-matrix, B) carbonate-to-phosphate, C) crystallinity, and D) collagen maturity. Pixel histograms adjacent to the figures illustrate the data distribution in the image shown.
Mineral-to-matrix ratio
In the cortices of the Dspp-/- femora there were few changes in mineral-to-matrix ratio with genotype or age (Table 3A). In contrast, in the Dspp+/+ cortices the mineral-to-matrix ratio measured by imaging increased ~7% from 5 weeks to 7 months, but at 9 months was ~10% lower than that at 7 months. This finding agreed with the changes in the micro-CT density which also increased from 5 weeks to 7 months in the Dspp+/+, but showed little change from 7 months to 9 months. The co-added spectra which weighted all regions of the spectra equally showed a statistically significant 3-5% increase in mineral content of the Dspp-/- femoral cortices at 5 weeks, associated with the decreased scatter in the Dspp+/+ data. No genotype dependent differences were found in the mineral-to-matrix ratios at other ages.
In both Dspp-/- and Dspp+/+ femora the trabecular tissue at each age (Table 3B) had a lower mineral-to-matrix ratio than the cortical bone of the same genotype, but values in the Dspp-/- and Dspp+/+ mice were only significantly different at 5 weeks where, opposite to the cortical findings, a ~20% decrease in DSPP-/- mineral content of was noted for the co-added data and a non-significant decrease of ~7% for the imaging data. At 7 months the mineral-to-matrix ratio in the Dspp-/- trabecular bone was increased ~17% based on both the imaging and co-added data, however the differences were not statistically significant. At 9 months mineral-to-matrix values were reduced relative to values at 7 months, but again there were no significant differences among genotypes.
Carbonate-to-phosphate ratio
The carbonate-to-phosphate ratio was significantly decreased in the cortical bone of the Dspp-/- mice as compared to Dspp+/+ mice at 5 weeks (Table 3A) and in the trabecular bone of the Dspp-/- as compared to the Dspp+/+ bone at 7 months (Table 3B). No age-dependent trends were found. The imaging data and the co-added data were in agreement showing a 20% increase in ratio at 5 weeks in the cortical bone and a 11-20% increase in the trabecular bone at 7 months.
Crystallinity
At 5 weeks and 7 months the crystallinity parameter, a measure of crystal size and perfection, appeared to be greater in the Dspp-/- cortical bone than in the Dspp+/+ bone (Table 3A). At 5 weeks the increase was ~8-15%, with significance noted only in the curvefit and co-added data; at 7 months only the curvefit data showed a significant increase in the Dspp-/- cortices. At 9 months crystallinity values in cortical bones of Dspp-/- were decreased ~4%, but the decrease was only significant for co-added data.
In the trabecular bone (Table 3B), the Dspp-/- crystallinity significantly exceeded that of the Dspp+/+ at 5weeks and 7 months. The imaging data and the co-added and curve-fit data paralleled one another, but the curve-fit data showed a greater range of values due to the comparison of subband area ratios rather than intensity ratios. No significant differences were noted between genotypes at 9 months.
XLR
The collagen cross-link parameter, XLR, calculated from the intensity ratios at 1660/1686 wavenumbers was significantly higher in the Dspp-/- mice cortical and trabecular bones compared with values in Dspp+/+ mice at 5 weeks (Table 3A,3B) showing a 39 (imaging) to 42% (co-added) increase in cortical bone and a 32 (imaging) to 36 (co-added) % increase in trabecular bone. The older ages showed no differences. In the Dspp+/+ mice, XLR increased with age in both the cortical and trabecular bones; no age-dependent increase was found in the Dspp-/- bones.
Correlation of micro-CT and FTIRI Data
This experiment gave us the opportunity to determine whether parameters measured in 3D by micro-CT correlated with those measured in 2D by FTIRI. A significant (p<0.04) linear correlation existed between the measured BMD (micro-CT) and the 2D mineral-to-matrix ratio despite the variability in the data (Figure 4).
Figure 4.
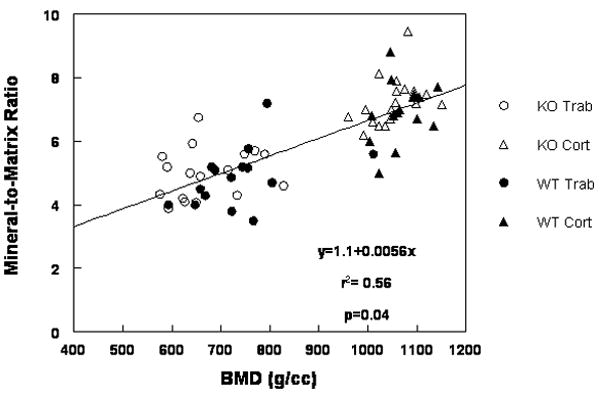
Linear correlation between micro-CT BMD and FTIRI mineral-to-matrix ratio for all bones studied. Data from Dspp+/+ (WT) and Dspp-/- (KO) are indicated for trabecular (Trab) and cortical bone (Cort).
DISCUSSION
Members of the SIBLING protein family found in mineralized tissues are believed to be multifunctional, regulating mineralization and having signaling activities [1-3]. This study of skeletal changes in the Dspp-/- male mouse has shown how ablating the gene for a major dentin SIBLING protein which is expressed at low levels in bone can have small but significant age-dependent effects in bone. The findings help explain the mechanism of action of the gene products of DSPP in bone. In addition, the study has also demonstrated the direct correlation between micro-CT data and FTIRI data.
The dspp gene produces three products; DSP, DPP, and DGP. DPP is a potent in vitro nucleator of HA at low concentrations and an inhibitor at higher concentrations [17]. DPP also facilitates in vitro collagen-based mineralization [18]. DSP, on the other hand, is not an effective regulator of in vitro mineralization although it has a slight ability to nucleate or inhibit HA formation and growth depending on concentration [19]. The effects of DGP on mineralization have not yet been reported. The in vivo effects of each of these individual fragments can not be determined from the ablation of dspp, however the results in the animals lacking dspp can be interpreted in light of the in vitro data.
Comparing the Dspp-/- and Dspp+/+ femora, the greatest and most consistent differences were found in the cortical tissue at 5 weeks, where the Dspp-/- femora were more dense, had increased crystallinity and increased collagen maturity (features of older bone), and there was increased crystallinity and collagen maturity of the trabeculae. At 9 months the findings were reversed with the Dspp-/- femora being less mineralized, smaller, with reduced crystallinity and collagen maturity in both cortical and trabecular bone. These differences may reflect the multiple activities of DSSP.
The phosphorylated forms of both DPP and DSP are reported to be regulators of hydroxyapatite formation and growth in vitro, acting as hydroxyapatite nucleators at lower concentrations [17-19, 38-40], and inhibitors of hydroxyapatite proliferation and growth at higher concentrations [17]. If a regulatory function exists in bone, as well as in dentin, one would expect the greatest effect in the youngest animals examined, as we observed. At 5 weeks of age, the mice lacking DSPP had bones that are denser than their aged matched controls. DSPP would thus be a mineralization inhibitor and/or stimulates remodeling. At five weeks, C57Bl/6 mice were at the developmental stage where both primary and secondary mineralization are taking place, and mineral content has not yet peaked [40]. The total amount of bone mineral would not be expected to be greatly changed during this rapid phase of mineralization, however associated with an increase in the relative amount of osteoid might account for the substantial increase in XLR. Additionally, since DPP binds to collagen [18], the bone collagen fibril packing in the absence of DPP could be altered, also contributing to the increased collagen maturity. In the absence of dspp less turnover of the bone matrix may occur, as reflected by the presence of larger crystals. Direct, yet to be identified, effects on osteoclast recruitment may account for the differences between cortical and trabecular bone regions.
At 7 months, when male C57/Bl6 mice reach their peak bone mass and peak cortical thickness [40] the absence of dspp gene products had a lesser effect, perhaps because little new bone formation and less remodeling are occurring relative to the 5 week old animals. The micro-CT values for the Dspp+/+ mice were in good agreement with the values in the literature [40]; the FTIRI parameters only showed significant differences in the trabeculae, which would be expected to be undergoing remodeling. Thus, the increased bone volume fraction and decreased trabecular spacing in the Dspp-/- femora along with the increased crystallinity and mineral-to-matrix ratio suggest that the missing Dspp gene products could be important for bone remodeling.
At 9 months, when age-related osteopenia occurs in the C57/Bl6 male mice [40], with structural properties being modified to compensate for increased brittleness, the Dspp-/- mice failed to show this compensation, having reduced density, reduced moments of inertia, and reduced trabecular number relative to the Dspp+/+ mice. Interestingly, the mineral that was present did not differ significantly in material properties from that in the Dspp+/+ bones although the acid phosphate content was significantly reduced in both cortical and trabecular bone. Since acid phosphate incorporation into bone decreases with age [41,42] this data indicates that the bone remaining in the Dspp-/- mice has an older tissue age. Crystallinity and collagen maturity were also modestly reduced relative to the control, suggesting impaired turnover. However, we cannot tell whether the observed changes in the bone mineral properties are a reflection of metabolic factors associated with the inability of Dspp-/- mice to eat their food properly due to an unobserved dentin abnormality, or is an indication of the function of dspp. The teeth of the 9 month-old mice used for these analyses were all examined to insure they were intact, but these mice were significantly smaller than the age-matched Dspp+/+ mice, suggesting that despite the absence of significant differences in weight gain, they might have had a growth defect. Altered expression of other matrix proteins might also contribute to the observed phenotype. The predentin of Dspp-/- mouse teeth show elevated biglycan and decorin expressionwhich may result from decreased mineralization or alternatively may contribute to decreased mineralization. Expression levels for other non-collagenous matrix proteins in the bones of these mice have not been reported.
The correlation between the micro-CT and FTIRI data is important. While comparing synchrotron micro-CT and FTIR analyses of homogenized powders Burghardt et al [43] concluded that FTIR and micro-CT results are complementary rather than comparable, however as shown here, when analyzing data in the same region, the results do become comparable. The relation between the micro-CT density and mineral-to-matrix ratio probably is seen because of the relatively comparable resolution of these methods, but is of course limited, as the 3D properties calculated from micro-CT provide more information that the 2-D FTIRI data.
CONCLUSION
While normal levels of dspp expression in bone are low, its disruption in mice resulted in modest but significant changes in their bone material properties at each of the time points studied. At 5 weeks accelerated mineralization was evident. The significant changes observed in the 9 month Dspp-/- bones with aging included decreases in structural properties such as area, polar moment of inertia and trabecular number, and in material properties such as mineral content and composition and collagen maturity not seen in the Dspp+/+ mice with age. With both structural and material deficits, these bones would be expected to be more fragile than their age- and sex- matched wild type controls, although mechanical tests on these bones were not performed.
Acknowledgments
Supported by NIH grants DE04141 and AR046121 (AB) and NIDCR- Division of Intramural funds (ABK). The investigation was conducted in a facility constructed with support from Research Facilities Improvement Program Grant Number C06-RR12538-01 from the National Center for Research Resources, National Institutes of Health.
Footnotes
Publisher's Disclaimer: This is a PDF file of an unedited manuscript that has been accepted for publication. As a service to our customers we are providing this early version of the manuscript. The manuscript will undergo copyediting, typesetting, and review of the resulting proof before it is published in its final citable form. Please note that during the production process errors may be discovered which could affect the content, and all legal disclaimers that apply to the journal pertain.
References
- 1.Qin C, Baba O, Butler WT. Post-translational modifications of sibling proteins and their roles in osteogenesis and dentinogenesis. Crit Rev Oral Biol Med. 2004;15:126–36. doi: 10.1177/154411130401500302. [DOI] [PubMed] [Google Scholar]
- 2.Butler WT, Brunn JC, Qin C, McKee MD. Extracellular matrix proteins and the dynamics of dentin formation. Connect Tissue Res. 2002;43:301–307. doi: 10.1080/03008200290000682. [DOI] [PubMed] [Google Scholar]
- 3.Fisher LW, Fedarko NS. Six genes expressed in bones and teeth encode the current members of the SIBLING family of proteins. Connect Tissue Res. 2003;44 Suppl 1:33–40. [PubMed] [Google Scholar]
- 4.MacDougall M. Dental structural diseases mapping to human chromosome 4q21. Connect Tissue Res. 2003;44:285–291. [PubMed] [Google Scholar]
- 5.Feng J, Luan X, Wallace J, Dai J, Dunkurni A, D’Souza RN, Kozak CA, MacDougall M. Organization, chromosomal mapping, and promoter activity of mouse dentin sialophosphoprotein gene. J Biol Chem. 1998;273:9457–9464. doi: 10.1074/jbc.273.16.9457. [DOI] [PubMed] [Google Scholar]
- 6.Boskey AL, Maresca M, Ullrich W, Doty SB, Butler WT, Prince CW. Osteopontin-hydroxyapatite interactions in vitro: inhibition of hydroxyapatite formation and growth in a gelatin-gel. Bone Miner. 1993;22:147–159. doi: 10.1016/s0169-6009(08)80225-5. [DOI] [PubMed] [Google Scholar]
- 7.Gericke A, Qin C, Spevak L, Fujimoto Y, Butler WT, Sorensen ES, Boskey AL. Importance of phosphorylation for osteopontin regulation of biomineralization. Calcif Tissue Int. 2005;77:45–54. doi: 10.1007/s00223-004-1288-1. [DOI] [PMC free article] [PubMed] [Google Scholar]
- 8.Boskey AL, Spevak L, Paschalis E, Doty SB, McKee MD. Osteopontin deficiency increases mineral content and mineral crystallinity in mouse bone. Calcif Tissue Int. 2002;71:145–154. doi: 10.1007/s00223-001-1121-z. [DOI] [PubMed] [Google Scholar]
- 9.Hunter GK, Goldberg HA. Nucleation of hydroxyapatite by bone sialoprotein. Proc Natl Acad Sci U S A. 1993;90:8562–8565. doi: 10.1073/pnas.90.18.8562. [DOI] [PMC free article] [PubMed] [Google Scholar]
- 10.Hunter GK, Poitras MS, Underhill TM, Grynpas MD, Goldberg HA. Induction of collagen mineralization by a bone sialoprotein--decorin chimeric protein. J Biomed Mater Res. 2001;55:496–502. doi: 10.1002/1097-4636(20010615)55:4<496::aid-jbm1042>3.0.co;2-2. [DOI] [PubMed] [Google Scholar]
- 11.Huffman NT, Keightley JA, Chaoying C, Midura RJ, Lovitch D, Veno PA, Dallas SL, Gorski JP. Association of specific proteolytic processing of bone sialoprotein and bone acidic glycoprotein-75 with mineralization within biomineralization foci (BMF) J Biol Chem. 2007;282:26002–26013. doi: 10.1074/jbc.M701332200. [DOI] [PMC free article] [PubMed] [Google Scholar]
- 12.Tartaix PH, Doulaverakis M, George A, Fisher LW, Butler WT, Qin C, Salih E, Tan M, Fujimoto Y, Spevak L, Boskey AL. In vitro effects of dentin matrix protein-1 on hydroxyapatite formation provide insights into in vivo functions. J Biol Chem. 2004;279:18115–18120. doi: 10.1074/jbc.M314114200. [DOI] [PubMed] [Google Scholar]
- 13.He G, George A. Dentin matrix protein 1 immobilized on type I collagen fibrils facilitates apatite deposition in vitro. J Biol Chem. 2004;279:11649–11656. doi: 10.1074/jbc.M309296200. [DOI] [PubMed] [Google Scholar]
- 14.Ling Y, Rios HF, Myers ER, Lu Y, Feng JQ, Boskey AL. DMP1 depletion decreases bone mineralization in vivo: an FTIR imaging analysis. J Bone Miner Res. 2005;20:2169–2177. doi: 10.1359/JBMR.050815. [DOI] [PMC free article] [PubMed] [Google Scholar]
- 15.Gowen LC, Petersen DN, Mansolf AL, Qi H, Stock JL, Tkalcevic GT, Simmons HA, Crawford DT, Chidsey-Frink KL, Ke HZ, McNeish JD, Brown TA. Targeted disruption of the osteoblast/osteocyte factor 45 gene (OF45) results in increased bone formation and bone mass. J Biol Chem. 2003;278:1998–2007. doi: 10.1074/jbc.M203250200. [DOI] [PubMed] [Google Scholar]
- 16.Sreenath T, Thyagarajan T, Hall B, Longenecker G, D’Souza R, Hong S, Wright JT, MacDougall M, Sauk J, Kulkarni AB. Dentin sialophosphoprotein knockout mouse teeth display widened predentin zone and develop defective dentin mineralization similar to human dentinogenesis imperfecta type III. J Biol Chem. 2003;278:24874–24880. doi: 10.1074/jbc.M303908200. [DOI] [PubMed] [Google Scholar]
- 17.Boskey AL, Maresca M, Doty S, Sabsay B, Veis A. Concentration-dependent effects of dentin phosphophoryn in the regulation of in vitro hydroxyapatite formation and growth. Bone Miner. 1990;11:55–65. doi: 10.1016/0169-6009(90)90015-8. [DOI] [PubMed] [Google Scholar]
- 18.He G, Ramachandran A, Dahl T, George S, Schultz D, Cookson D, Veis A, George A. Phosphorylation of phosphophoryn is crucial for its function as a mediator of biomineralization. J Biol Chem. 2005;280:33109–33114. doi: 10.1074/jbc.M500159200. [DOI] [PubMed] [Google Scholar]
- 19.Boskey A, Spevak L, Tan M, Doty SB, Butler WT. Dentin sialoprotein (DSP) has limited effects on in vitro apatite formation and growth. Calcif Tissue Int. 2000;67:472–478. doi: 10.1007/s002230001169. [DOI] [PubMed] [Google Scholar]
- 20.Wallwork ML, Kirkham J, Chen H, Chang SX, Robinson C, Smith DA, Clarkson BH. Binding of dentin noncollagenous matrix proteins to biological mineral crystals: an atomic force microscopy study. Calcif Tissue Int. 2002;71:249–255. doi: 10.1007/s00223-001-1011-4. [DOI] [PubMed] [Google Scholar]
- 21.MacDougall M, Simmons D, Luan X, Nydegger J, Feng J, Gu TT. Dentin phosphoprotein and dentin sialoprotein are cleavage products expressed from a single transcript coded by a gene on human chromosome 4. Dentin phosphoprotein DNA sequence determination. J Biol Chem. 1997;272:835–842. doi: 10.1074/jbc.272.2.835. [DOI] [PubMed] [Google Scholar]
- 22.D’Souza RN, Cavender A, Sunavala G, Alvarez J, Ohshima T, Kulkarni AB, MacDougall M. Gene expression patterns of murine dentin matrix protein 1 (Dmp1) and dentin sialophosphoprotein (DSPP) suggest distinct developmental functions in vivo. J Bone Miner Res. 1997;12:2040–2049. doi: 10.1359/jbmr.1997.12.12.2040. [DOI] [PubMed] [Google Scholar]
- 23.Qin C, Brunn JC, Cadena E, Ridall A, Tsujigiwa H, Nagatsuka H, Nagai N, Butler WT. The expression of dentin sialoprotein gene in bone. J Dent Res. 2002;81:392–394. doi: 10.1177/154405910208100607. [DOI] [PubMed] [Google Scholar]
- 24.Fisher LW, Jain A, Tayback M, Fedarko NS. Small integrin binding ligand N-linked glycoprotein gene family expression in different cancers. Clin Cancer Res. 2004;10:8501–8511. doi: 10.1158/1078-0432.CCR-04-1072. [DOI] [PubMed] [Google Scholar]
- 25.Chaplet M, Waltregny D, Detry C, Fisher LW, Castronovo V, Bellahcene A. Expression of dentin sialophosphoprotein in human prostate cancer and its correlation with tumor aggressiveness. Int J Cancer. 2006;118:850–856. doi: 10.1002/ijc.21442. [DOI] [PubMed] [Google Scholar]
- 26.Ogbureke KU, Fisher LW. Renal expression of SIBLING proteins and their partner matrix metalloproteinases (MMPs) Kidney Int. 2005;68:155–166. doi: 10.1111/j.1523-1755.2005.00389.x. [DOI] [PubMed] [Google Scholar]
- 27.Ogbureke KU, Fisher LW. Expression of SIBLINGs and their partner MMPs in salivary glands. J Dent Res. 2004;83:664–670. doi: 10.1177/154405910408300902. [DOI] [PubMed] [Google Scholar]
- 28.Yamakoshi Y, Hu JC, Fukae M, Zhang H, Simmer JP. Dentin glycoprotein: the protein in the middle of the dentin sialophosphoprotein chimera. J Biol Chem. 2005;280:17472–17479. doi: 10.1074/jbc.M413220200. [DOI] [PubMed] [Google Scholar]
- 29.MacDougall M, Dong J, Acevedo AC. Molecular Basis of Human Dentin Diseases. Am J Med Genet. 2006;140A:2536–2546. doi: 10.1002/ajmg.a.31359. [DOI] [PubMed] [Google Scholar]
- 30.Zhang X, Zhao J, Li C, Gao S, Qiu C, Liu P, Wu G, Qiang B, Lo WHY, Shen Y. DSPP mutation in dentinogenesis imperfecta Shields type II. Nature Genet. 2001;27:151–152. doi: 10.1038/84765. [DOI] [PubMed] [Google Scholar]
- 31.Rajpar MH, Koch MJ, Davies RM, Mellody KT, Kielty CM, Dixon MJ. Mutation of the signal peptide region of the bicistronic gene DSPP affects translocation to the endoplasmic reticulum and results in defective dentine biomineralization. Hum Mol Genet. 2002;11:2559–2565. doi: 10.1093/hmg/11.21.2559. [DOI] [PubMed] [Google Scholar]
- 32.Fritton JC, Myers ER, Wright TM, van der Meulen MC. Loading induces site-specific increases in mineral content assessed by microcomputed tomography of the mouse tibia. Bone. 2005;36:1030–1038. doi: 10.1016/j.bone.2005.02.013. [DOI] [PubMed] [Google Scholar]
- 33.Otsu N. A threshold selection method from gray-level histograms. IEEE Trans Syst Man Cybern. 1979;9:62–66. [Google Scholar]
- 34.Boskey A, Pleshko Camacho N. FT-IR imaging of native and tissue-engineered bone and cartilage. Biomaterials. 2007;28:2465–2478. doi: 10.1016/j.biomaterials.2006.11.043. [DOI] [PMC free article] [PubMed] [Google Scholar]
- 35.Boskey AL, Moore DJ, Amling M, Canalis E, Delany AM. Infrared analysis of the mineral and matrix in bones of osteonectin-null mice and their wildtype controls. J Bone Miner Res. 2003;18:1005–1011. doi: 10.1359/jbmr.2003.18.6.1005. [DOI] [PubMed] [Google Scholar]
- 36.Boskey AL, DiCarlo E, Paschalis E, West P, Mendelsohn R. Comparison of mineral quality and quantity in iliac crest biopsies from high- and low-turnover osteoporosis: an FT-IR microspectroscopic investigation. Osteoporos Int. 2005;16:2031–2038. doi: 10.1007/s00198-005-1992-3. [DOI] [PMC free article] [PubMed] [Google Scholar]
- 37.Chang S, Chen H, Liu J, Wood D, Bentley P, Clarkson B. Synthesis of a potentially bioactive, hydroxyapatite-nucleating molecule. Calcif Tissue Int. 2006;78:55–61. doi: 10.1007/s00223-005-0118-4. [DOI] [PubMed] [Google Scholar]
- 38.George A, Hao J. Role of phosphophoryn in dentin mineralization. Cells Tissues Organs. 2005;181:232–240. doi: 10.1159/000091384. [DOI] [PubMed] [Google Scholar]
- 39.Milan AM, Sugars RV, Embery G, Waddington RJ. Adsorption and interactions of dentine phosphoprotein with hydroxyapatite and collagen. Eur J Oral Sci. 2006;114:223–231. doi: 10.1111/j.1600-0722.2006.00347.x. [DOI] [PubMed] [Google Scholar]
- 40.Ferguson VL, Ayers RA, Bateman TA, Simske SJ. Bone development and age-related bone loss in male C57BL/6J mice. Bone. 2003;33:387–398. doi: 10.1016/s8756-3282(03)00199-6. [DOI] [PubMed] [Google Scholar]
- 41.Roberts JE, Bonar LC, Griffin RG, Glimcher MJ. Characterization of very young mineral phases of bone by solid state 31phosphorus magic angle sample spinning nuclear magnetic resonance and X-ray diffraction. Calcif Tissue Int. 1992;50:42–48. doi: 10.1007/BF00297296. [DOI] [PubMed] [Google Scholar]
- 42.Miller LM, Carlson CS, Carr GL, Chance MR. A method for examining the chemical basis for bone disease: synchrotron infrared microspectroscopy. Cell Mol Biol (Noisy-le-grand) 1998;44:117–127. [PubMed] [Google Scholar]
- 43.Burghardt AJ, Wang Y, Elalieh H, Thibault X, Bikle D, Peyrin F, Majumdar S. Evaluation of fetal bone structure and mineralization in IGF-I deficient mice using synchrotron radiation microtomography and Fourier transform infrared spectroscopy. Bone. 2007;40:160–168. doi: 10.1016/j.bone.2006.06.017. [DOI] [PubMed] [Google Scholar]