

Abstract
Several mechanistic pathways linking hyperglycemia to diabetes complications, including glycation of proteins and formation of advanced glycation end products (AGEs), have been proposed. We investigated the hypothesis that skin collagen glycation and AGEs predict the risk of progression of microvascular disease. We measured glycation products in the skin collagen of 211 Diabetes Control and Complications Trial (DCCT) volunteers in 1992 who continued to be followed in the Epidemiology of Diabetes Interventions and Complications study for 10 years. We determined whether the earlier measurements of glycated collagen and AGE levels correlated with the risk of progression of retinopathy and nephropathy from the end of the DCCT to 10 years later. In multivariate analyses, the combination of furosine (glycated collagen) and carboxymethyllysine (CML) predicted the progression of retinopathy (χ2 = 59.4, P < 0.0001) and nephropathy (χ2 = 18.2, P = 0.0001), even after adjustment for mean HbA1c (A1C) (χ2 = 32.7, P < 0.0001 for retinopathy) and (χ2 = 12.8, P = 0.0016 for nephropathy). The predictive effect of A1C vanished after adjustment for furosine and CML (χ2 = 0.0002, P = 0.987 for retinopathy and χ2 = 0.0002, P = 0.964 for nephropathy). Furosine explained more of the variation in the 10-year progression of retinopathy and nephropathy than did CML. These results strengthen the role of glycation of proteins and AGE formation in the pathogenesis of retinopathy and nephropathy. Glycation and subsequent AGE formation may explain the risk of these complications associated with prior A1C and provide a rational basis for the phenomenon of “metabolic memory” in the pathogenesis of these diabetes complications.
Nonenzymatic glycation of proteins and subsequent formation of advanced glycation end products (AGEs) is one of the pathogenetic mechanisms thought to link hyperglycemia to diabetic retinopathy and nephropathy (1,2). Inhibitors of AGE formation (3–8) and breakers of AGE-protein cross-links (9,10) reduce both microvascular complications in experimental diabetic models. The relationship of long-term intensive control of glycemia and its effect on these complications with indicators of skin collagen glycation (furosine), glycoxidation and AGE formation (pentosidine and carboxymethyllysine [CML]), and cross-linking (acid and pepsin solubility) were previously examined in 215 patients with type 1 diabetes from the Diabetes Control and Complications Trial (DCCT) (11) who underwent a skin biopsy ∼1 year before the close of the trial. Compared with conventional treatment, intensive treatment was associated with significantly lower levels of furosine, pentosidine, CML, and relative fluorescence and with higher levels of acid- and pepsin-soluble collagen (11). Age- and duration-adjusted collagen variables were significantly associated with the A1C value closest in time to the biopsy and with mean DCCT A1C. Retinopathy, nephropathy, and neuropathy outcomes as dependent variables were significantly associated with the full set of collagen measurements as independent variables, even after adjustment for A1C levels (11). The early Amadori product of glycation, as well as AGEs, contributed to the cross-sectional associations.
To further test the glycation/AGE hypothesis, we have monitored these subjects for development and progression of complications in the Epidemiology of Diabetes Interventions and Complications (EDIC) study to determine whether skin glycation products could be better predictors of the future risk of complications than A1C. We now report the relationship of the incidence of retinopathy and nephropathy progression during 10 years of follow-up to the previous levels of skin collagen glycation and AGEs.
RESEARCH DESIGN AND METHODS
A total of 216 subjects (53% of those available in eight DCCT clinics) with type 1 diabetes volunteered to undergo a skin biopsy in 1991–1992. Informed consent was obtained. One hundred twenty-two had originally been assigned to the intensive and 94 to the conventional treatment groups of the DCCT. Of the intensive group subjects, 65 (53%) were from the primary prevention cohort that had no retinopathy or microalbuminuria at the DCCT baseline and 57 (47%) were from the secondary intervention cohort of the DCCT with mild to moderate nonproliferative retinopathy and albumin excretion rates (AERs) <200 mg/24 h (12). Of those in the conventional group, 58 (62%) were from the primary prevention cohort and 36 (38%) were from the secondary prevention cohort. Forty nondiabetic subjects between 20 and 51 years of age served as age-matched control subjects.
During the EDIC study, fundus photographs were performed in the whole cohort at years 4 and 10 and in one-fourth of the cohort in rotation annually. Four-hour timed urine collections for AER were obtained biannually. Of the skin biopsy cohort, four participants died and one became inactive. Of those subjects who had not undergone scatter laser photocoagulation during the DCCT, 184 had fundus photographs at the EDIC study year 10, including 87% of those who had previously been on intensive and 85% of those on conventional therapy. Of 196 subjects who had no microalbuminuria at the DCCT close out, 185 had renal assessments at the EDIC study years 9–10, including 95% of those who had previously been on intensive and 94% of those on conventional therapy.
Assessment of complications
Retinopathy and nephropathy were assessed as during the DCCT (12), and EDIC study outcomes were predefined (13). Progression of retinopathy during the EDIC study was defined as a three-step or greater worsening at any time from the DCCT close out to the EDIC study year 10 on the final Early Treatment of Diabetic Retinopathy Scale of retinopathy severity (12) or initial scatter laser therapy during this interval. Progression of nephropathy was defined as the initial development of microalbuminuria (AER ≥40 mg/24 h), albuminuria (AER ≥300 mg/24 h), or dialysis/transplant at any time between the DCCT close out and the EDIC study years 9 or 10. For both outcomes, the cumulative incidence of events from the DCCT close out was analyzed.
Skin biopsy procedure
A 4-mm skin punch biopsy was taken from the buttocks 10 mm below the iliac crest and immediately rinsed in saline and frozen. Skin collagen levels and methodology for furosine, CML, pentosidine, relative fluorescence at 370/440 nm exitation/emission wavelengths, percent pepsin solubility, and percent acid solubility were previously reported (11). A1C was measured as previously reported (14).
Statistical methods
Covariance adjustment of collagen variables for age and diabetes duration was performed by analysis of residuals from a simple linear model (1). These adjusted skin collagen variables were used in all analyses. Univariate differences between groups with respect to a quantitative variable were assessed using Wilcoxon’s rank-sum test for continuous or ordinal variables and χ2/Fisher’s exact test for categorical variables (15). The Mantel-Haenszel method was used to calculate stratified adjusted odds ratios (ORs) with test-based confidence limits (15). The Breslow Day test was used to test for homogeneity of ORs over strata (15). Multivariate logistic regression analysis was used to assess the effects of covariates on the odds of retinopathic and nephropathic outcomes, and the proportion of variation in risk was assessed using the entropy R2 (15). Significance of effects of specific covariate blocks, unadjusted as well as adjusted for other covariates, were evaluated using likelihood ratio tests (15). The effects of A1C on outcomes were explored using the mean DCCT A1C, the mean EDIC study A1C, and the time-weighted mean DCCT-EDIC A1C. The DCCT mean A1C is the mean of all quarterly DCCT measurements. The EDIC study mean A1C is the mean of all EDIC study annual measurements. The combined mean A1C is computed as the average of the DCCT and current EDIC study mean values, weighted by the time in DCCT and that in EDIC study. All analyses were performed using SAS software.
RESULTS
Study subject characteristics
The characteristics of the skin biopsy participants with 10-year EDIC study follow-up at the DCCT baseline and the DCCT close-out examinations are shown in Table 1. By comparison, with the nonparticipating DCCT subjects active in the EDIC study at 10 years, the participants at baseline were slightly older, had slightly shorter duration of diabetes, had slightly higher systolic blood pressure, and had slightly lower doses of insulin. The mean A1C and plasma glucose levels were not significantly different. At the DCCT close out, the participants had slightly lower serum triglycerides, a lower percentage of severe nonproliferative retinopathy, and lower AER. Intensive versus conventional treatment group skin biopsy study participants had lower mean A1C levels (7.1 vs. 9.3%, P < 0.0001), lower mean plasma glucose levels (150 vs. 231 mg/dl, P < 0.0001), and were more obese (male 120 vs. 113% ideal body weight, P = 0.017; female 119 vs. 109% ideal body weight, P = 0.003) at the DCCT close out.
TABLE 1.
DCCT baseline and close-out characteristics of participants versus nonparticipants active as of year 10 of the EDIC study
| DCCT baseline | Skin biopsy study |
||
|---|---|---|---|
| Participants | Nonparticipants | P | |
| n | 211 | 1,143 | - |
| DCCT baseline | |||
| Age (years) | 28±7 | 27±7 | 0.006 |
| Women | 48 | 48 | 0.979 |
| Diabetes duration (years) | 5.0±4.1 | 5.7±4.1 | 0.013 |
| xStimulated C-peptide (pmol/ml) | 0.12±0.11 | 0.11±0.12 | 0.376 |
| Insulin dosage (units/kg) | 0.63±0.23 | 0.67±0.25 | 0.008 |
| A1C | 8.8±1.7 | 8.9±1.6 | 0.922 |
| Systolic blood pressure (mmHg) | 116±11 | 114±12 | 0.011 |
| Diastolic blood pressure (mmHg) | 73±9 | 72±9 | 0.268 |
| Triglycerides (mmol) (now in mg/dl) | 81±52 | 80±47 | 0.825 |
| HDL cholesterol (mmol) (now in mg/dl) | 51±12 | 50±12 | 0.634 |
| LDL cholesterol (mmol) (now in mg/dl) | 111±30 | 109±29 | 0.409 |
| No retinopathy (10/10) | 57 | 49 | - |
| Microaneurisms only <(20/20) | 25 | 32 | - |
| Mild nonproliferative diabetic retinopathy <(30/30) | 10 | 10 | - |
| Moderate nonproliferative diabetic retinopathy <(45/45) | 7 | 8 | 0.145 |
| Albuminuria (mg/24 h) | 15±14 | 16±20 | 0.225 |
| Creatinine clearance (ml/min) | 131±32 | 128±28 | 0.248 |
| AER >40 mg/day | 4.3 | 5.1 | 0.619 |
| Presence of clinical neuropathy | 8.1 | 5.8 | 0.201 |
| DCCT close out (EDIC baseline) | |||
| DCCT mean A1C | 8.0±1.6 | 8.2±1.4 | 0.400 |
| Systolic blood pressure (mmHg) | 117±11 | 116±12 | 0.670 |
| Diastolic blood pressure (mmHg) | 75±9 | 74±9 | 0.192 |
| Triglycerides (mmol) (now in mg/dl) | 79±42 | 87±53 | 0.017 |
| HDL cholesterol (mmol) (now in mg/dl) | 51±13 | 51±13 | 0.944 |
| LDL cholesterol (mmol) (now in mg/dl) | 111±29 | 114±29 | 0.098 |
| Severe nonproliferative diabetic retinopathy or worse (53/<53+) | 1.9 | 5.5 | 0.032 |
| Laser (focal or scatter) | 2.8 | 5.5 | 0.105 |
| Albuminuria (mg/24 h) | 25±102 | 49±329 | 0.047 |
| AER >40 mg/dl | 9.5 | 9.8 | 0.877 |
Data are means±SD or percent.
Progression of retinopathy
Sixty-seven skin biopsy participants had progression of retinopathy (28 [27%] from the former intensive treatment group and 39 [49%] from the former conventional treatment group, P = 0.0023). Figure 1 and Table 2 present comparisons of skin collagen parameters, adjusted for age and diabetes duration in those who did and did not show progression of retinopathy between the DCCT close out and EDIC study year 10. Mean levels of furosine, CML, pentosidine, and fluorescence in those whose retinopathy progressed were significantly higher than in those without retinopathy progression. The mean level of pepsin solubility was significantly lower in the group of progressors, indicating a worse physicochemical collagen abnormality, than in nonprogressors. The acid-soluble levels were not different.
FIG. 1.
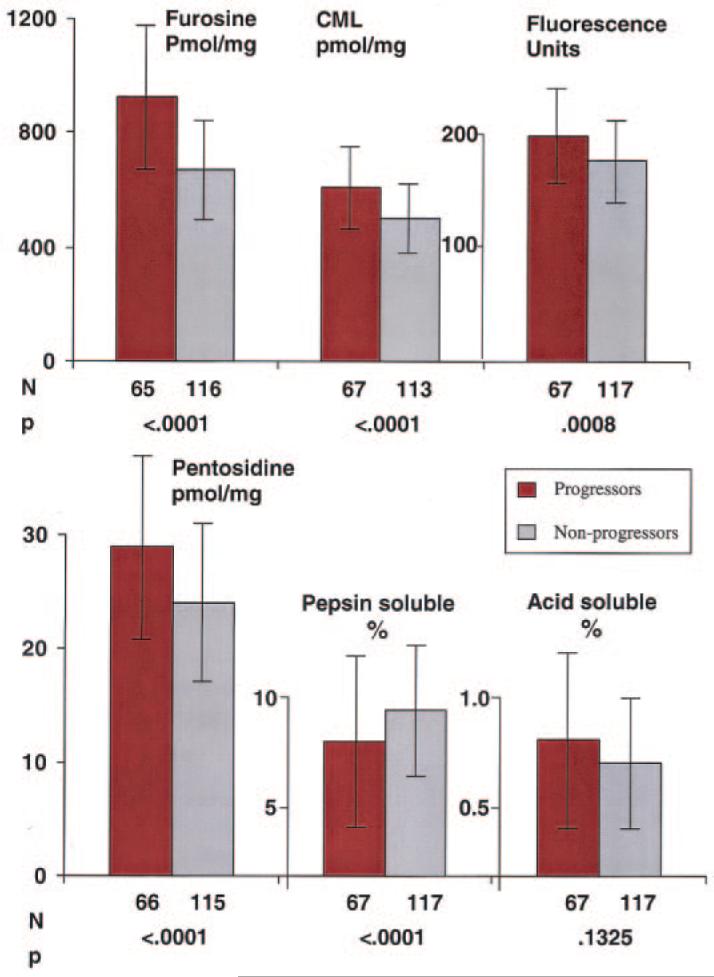
Distribution of skin collagens by retinopathy progression status. The mean and SD of each skin collagen parameter are compared in those participants whose retinopathy progressed (red bars) three or more steps on the Early Treatment of Diabetic Retinopathy Scale scale and/or required retinal photocoagulation between the end of the DCCT and year 10 of EDIC versus those whose retinopathy did not progress ( ). All values are adjusted for age and diabetes duration at the time of the biopsy.
TABLE 2.
Univariate analysis of risk factors versus retinopathy and nephropathy outcome
| Three or more—step ETDRS progression or scatter laser therapy from DCCT close out through EDIC study year 10 |
Development of microalbuminuria or worse from DCCT close out through EDIC study year 9–10 |
|||||
|---|---|---|---|---|---|---|
| Characteristics | Event | Nonevent | P value | Event | Nonevent | P value |
| n | 67 | 117 | - | 34 | 151 | - |
| Demographics | ||||||
| Age at EDIC study baseline | 34.4 ± 6.8 | 34.0 ± 6.5 | 0.7777 | 34.1 ± 6.3 | 34.6 ± 6.6 | 0.5883 |
| Women (%) | 55.2 | 45.3 | 0.1950 | 55.9 | 47.7 | 0.3875 |
| Diabetes duration at EDIC study baseline (years) | 11.3 ± 4.4 | 11.0 ± 5.0 | 0.3679 | 10.5 ± 4.0 | 11.0 ± 4.8 | 0.7269 |
| DCCT treatment group | ||||||
| Intensive (%) | 41.8 | 65.0 | 0.0023 | 52.9 | 58.3 | 0.5698 |
| Glycemic control | ||||||
| DCCT mean A1C (%) | 9.0 ± 1.7 | 7.6 ± 1.2 | <0.0001 | 8.8 ± 1.6 | 7.8 ± 1.4 | 0.0005 |
| EDIC study mean A1C up to EDIC study year 10 (%) |
8.8 ± 1.4 | 7.7 ± 0.9 | <0.0001 | - | - | - |
| EDIC study mean A1C up to EDIC study year 9–10 (%) |
- | - | - | 9.2 ± 1.3 | 7.8 ± 1.1 | <0.0001 |
| Medical at EDIC baseline | ||||||
| Mean blood pressure (mmHg) | 90.7 ± 9.3 | 88.1 ± 8.0 | 0.1174 | 92.6 ± 8.4 | 88.0 ± 8.2 | 0.0089 |
| Hypertension ever (%) | 14.9 | 7.7 | 0.1208 | 25.3 | 7.3 | 0.0048 |
| Triglycerides (mmol) (now in mg/dl) | 81.0 ± 44.0 | 76.6 ± 43.3 | 0.6882 | 86.6 ± 45.4 | 73.9 ± 39.1 | 0.1165 |
| HDL cholesterol (mmol) (now in mg/dl) | 53.0 ± 14.2 | 51.2 ± 12.2 | 0.4670 | 51.8 ± 12.4 | 51.6 ± 12.9 | 0.9218 |
| LDL cholesterol (mmol) (now in mg/dl) | 112 ± 29 | 108 ± 29 | 0.3577 | 116 ± 30 | 108 ± 28 | 0.0856 |
| Overweight (%) | 35.8 | 35.0 | 0.9154 | 38.2 | 37.1 | 0.9004 |
| Smoker at DCCT close out (%) | 26.9 | 15.4 | 0.0589 | 23.5 | 17.2 | 0.3907 |
| Retinopathy at EDIC study baseline | ||||||
| No retinopathy (10/10) (%) | 25.4 | 30.8 | - | 17.7 | 33.1 | - |
| Microaneurisms only <(20/20) (%) | 29.9 | 41.0 | - | 38.2 | 39.1 | - |
| Mild to moderate nonproliferative diabetic retinopathy or worse (35/<35+) (%) |
44.8 | 28.2 | 0.0711 | 44.1 | 27.8 | 0.1007 |
| Renal at EDIC baseline | ||||||
| Albuminuria (mg/24 h) | 44.7 ± 166 | 11.7 ± 21.1 | 0.0002 | 13.6 ± 9.4 | 8.3 ± 5.1 | 0.0014 |
| AER ≥40 (%) | 17.9 | 4.3 | 0.0023 | - | - | - |
| Neuropathy at EDIC baseline (%) | 16.4 | 4.3 | 0.0052 | 14.7 | 8.7 | 0.2845 |
| Skin collagens at EDIC study baseline (pmol/mg collagen) |
||||||
| Furosine | 924 ± 253 | 669 ± 172 | <0.0001 | 878 ± 242 | 717 ± 205 | 0.0001 |
| CML | 607 ± 134 | 501 (120) | <0.0001 | 596 ± 126 | 514 ± 129 | 0.0007 |
| Pentosidine | 29.0 ± 8.2 | 24.3 ± 6.9 | <0.0001 | 8.6 | 24.7 ± 6.8 | 0.0003 |
| Fluorescence | 197 ± 40 | 176 ± 37 | 0.0002 | 201 ± 45 | 181 ± 50 | 0.0033 |
| Acid-soluble collagen (%) | 0.6 ± 0.4 | 0.5 ± 0.3 | 0.1325 | 0.6 ± 0.4 | 0.6 ± 0.3 | 0.1599 |
| Pepsin-soluble collagen (%) | 5.9 ± 3.9 | 7.3 ± 3.0 | <0.0001 | 6.0 ± 2.8 | 7.1 ± 3.4 | 0.0187 |
Data are means ± SD or percent, unless otherwise indicated. ETDRS, Early Treatment of Diabetic Retinopathy Scale. Values in bold indicate P < 0.05.
Univariate risk factors for progression of retinopathy are shown in Table 2. Progressors were more likely to have been on the DCCT conventional treatment and to have had higher mean DCCT and EDIC study A1C levels. At the DCCT close out, retinopathy progressors were also more likely to have had microalbuminuria (17.9 vs. 4.3%, P = 0.0023) and neuropathy (16.4 vs. 4.3%, P = 0.0052). There were no significant differences in blood pressure, lipid levels, or prevalence of overweight.
Multiple logistic regression analysis was performed to determine which skin collagen parameters measured before the close out of the DCCT were predictive of subsequent progression of retinopathy during the EDIC study (Table 3). The dependent retinopathy outcome was predicted by the mean DCCT A1C level (R2 = 0.14, P < 0.0001). The entire panel of six collagen parameters was a highly significant and even stronger predictor of retinopathy progression (R2 = 0.26, P < 0.0001).
TABLE 3.
Summary of multiple multivariate logistic regressions for retinopathy
| Covariate effects from multiple models |
df | χ2 | P value | R2 |
|---|---|---|---|---|
| Unadjusted effect | ||||
| DCCT mean A1C | 1 | 34.3 | <0.0001 | 0.142 |
| EDIC study mean A1C | 1 | 40.5 | <0.0001 | 0.168 |
| Furosine, CML, pentosidine, fluorescence, acid/pepsin soluble |
6 | 62.2 | <0.0001 | 0.258 |
| Pentosidine, fluorescence, acid/pepsin soluble |
4 | 21.8 | 0.0002 | 0.090 |
| Furosine, CML | 2 | 59.4 | <0.0001 | 0.246 |
| Furosine | 1 | 52.2 | <0.0001 | 0.216 |
| CML | 1 | 27.7 | <0.0001 | 0.115 |
| Adjusted effect | ||||
| DCCT mean A1C effect adjusted for |
||||
| Furosine, CML | 1 | 0.0 | 0.9874 | 0.000 |
| Furosine | 1 | 0.4 | 0.5430 | 0.001 |
| CML | 1 | 17.4 | <0.0001 | 0.072 |
| EDIC study mean A1C effect adjusted for |
||||
| Furosine, CML | 1 | 26.0 | <0.0001 | 0.108 |
| Furosine | 1 | 24.6 | <0.0001 | 0.102 |
| CML | 1 | 43.4 | <0.0001 | 0.180 |
| Furosine, CML effect adjusted for |
||||
| Pentosidine, fluorescence, | ||||
| acid/pepsin soluble | 2 | 46.3 | <0.0001 | 0.192 |
| DCCT mean A1C | 2 | 32.7 | <0.0001 | 0.136 |
| EDIC study mean A1C | 2 | 45.9 | <0.0001 | 0.190 |
| Pentosidine, fluorescence, acid/pepsin soluble effect adjusted for |
||||
| Furosine, CML | 4 | 4.8 | 0.3034 | 0.020 |
| Furosine effect adjusted for | ||||
| DCCT mean A1C | 1 | 22.2 | <0.0001 | 0.092 |
| EDIC study mean A1C | 1 | 33.5 | <0.0001 | 0.139 |
| CML effect adjusted for | ||||
| DCCT mean A1C | 1 | 14.4 | <0.0001 | 0.061 |
| EDIC study mean A1C | 1 | 27.6 | <0.0001 | 0.114 |
Dependent variable: three or more—step progression of retinopathy on the Early Treatment of Diabetic Retinopathy Scale or scatter laser therapy from DCCT close out through EDIC study year 10. As defined in the statistical methods section, χ2 and P values are from likelihood ratio test, and R2 is entropy R2.
When examined in subblocks, furosine plus CML (R2 = 0.25, P < 0.0001) and fluorescence, pentosidine, acid, and pepsin solubility (R2 = 0.09, P = 0.0002) were highly significant. However, the variation in risk ascribable to the whole collagen block was explained by furosine and CML alone, and the significance of the other four—collagen parameter subblock was lost when adjusted for furosine and CML (R2 = 0.02, P = 0.3034). By contrast, furosine and CML remained significant when adjusted for the other four collagen parameters (R2 = 0.19, P < 0.0001). Importantly, the predictive ability of the combination of furosine and CML was independent of the DCCT mean A1C (R2 = 0.14, P < 0.0001); however, the predictive value of the DCCT mean A1C was lost after adjusting for furosine and CML (R2 = 0.0000, P = 0.9874). Likewise, the predictive ability of furosine and CML was independent of the EDIC study mean A1C (R2 = 0.19, P < 0.0001), but that of the EDIC study mean A1C remained significant after adjustment for furosine and CML (R2 = 0.11, P < 0.0001) because its influence was closer in time to the outcome and followed that of the glycation products.
When originally measured, furosine and CML each individually correlated with the preceding mean DCCT A1C (11). Therefore, it is noteworthy that furosine alone predicted retinopathy worsening (R2 = 0.22, P < 0.0001) and, after (R2 = 0.09, P < 0.0001) adjustment, for the DCCT mean A1C. Similarly, the effect of CML alone was significant even with adjustment for the DCCT mean A1C, but the magnitude of the effect was less than that of furosine alone. Furosine and CML both predicted the risk of retinopathy progression over the 10 years of the EDIC study, independent of the mean A1C. Mean EDIC study A1C remained a significant predictor of retinopathy, adjusted for either furosine or CML, whereas the mean DCCT A1C effect vanished after adjustment for furosine but remained significant after adjustment for CML. For each 1-SD increase in furosine or CML, the ORs for progression of retinopathy were 3.52 (95% CI 2.32–5.34) (P < 0.0001) and 2.45 (1.68–3.57) (P < 0.0001), respectively.
Figure 2 further illustrates the predictive ability of furosine and the DCCT mean A1C on retinopathy progression. The risk of retinopathy progression in the upper quartile of furosine (>Q3) is compared with the progression in the lower three quartiles of furosine (<Q3). The comparison was first made within the upper quartile of A1C (OR 10.1 [95% CI 1.8–57.9], P = 0.0038) and then in the lower three quartiles of A1C (3.0 [0.8–10.9], P = 0.0890). Both comparisons show greater risk in the upper quartile than the lower three quartiles of furosine, though the second comparison was not significant due to the smaller number of events in the lower three quartiles of A1C. When stratified by A1C, the overall OR of retinopathy progression for furosine >Q3 vs. <Q3 remains significant (4.8 [1.8–13.2], P = 0.0014, homogeneity of OR across strata tested by Breslow-Day test: P = 0.2636). By contrast, the overall OR for the DCCT mean A1C (>Q3 vs. <Q3) stratified by furosine is not significant anymore (1.6 [0.6–4.5], P = 0.3664, Breslow-Day P value = 0.2643), even though the DCCT mean A1C was a highly significant predictor of retinopathy progression by itself (4.8 [2.4–9.9], P < 0.0001). These results further demonstrated the dominance of furosine over A1C as a risk factor for retinopathy progression.
FIG. 2.

Risk of retinopathy progression by DCCT mean A1C and furosine. Shown is the risk of progression of retinopathy in the upper quartile of skin collagen furosine (>Q3) (blue bars) compared with the progression in the lower three quartiles of furosine (<Q3) (yellow bars). The comparison is made in the upper (>Q3) and lower three (<Q3) quartiles of A1C separately. *P value is from a between-group furosine (>Q3 vs. <Q3) comparison within each A1C (HBA1c) strata using the χ2 test. The greatest risk of progression occurs when both furosine and A1C are >Q3, but the dominance of furosine over A1C as a risk factor is evident.
Progression of nephropathy
A total of 34 participants had progression of nephropathy (18 [17%] from the former intensive group and 16 [20%] from the former conventional group, P = 0.5698). Figure 3 and Table 2 present comparisons of the mean skin collagen parameters adjusted for age and diabetes duration in those subjects who did and did not develop nephropathy up to EDIC study years 9–10. The results were comparable with those for retinopathy. Mean values of furosine, CML, pentosidine, and fluorescence were significantly higher in the nephropathy progressors, and the mean value of pepsin solubility but not acid solubility was significantly lower in the progressors.
FIG. 3.
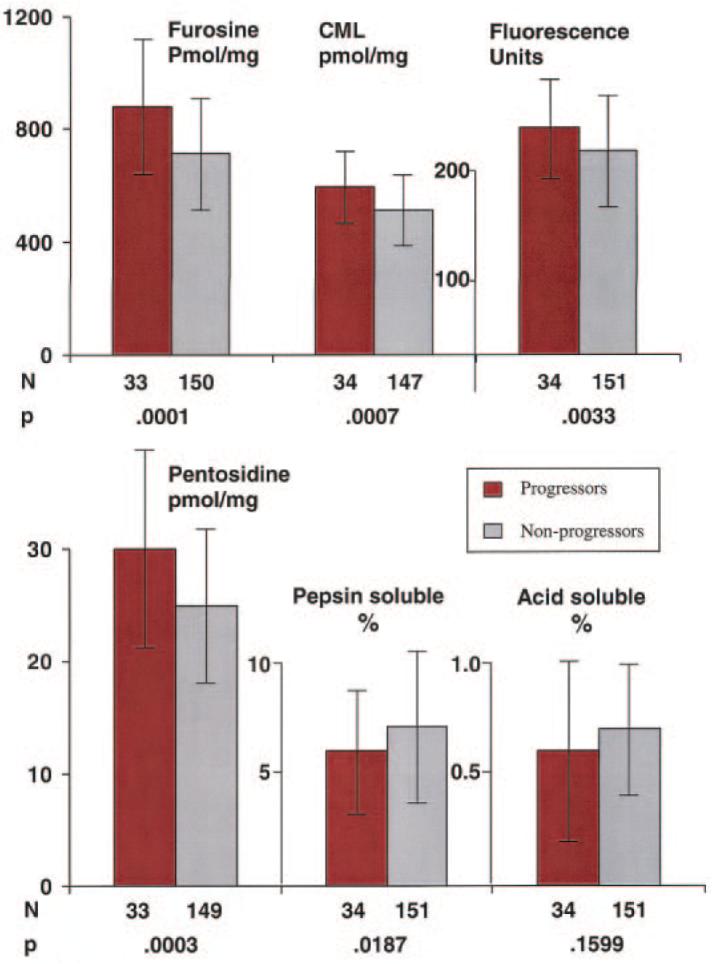
Distribution of skin collagens by nephropathy progression status. The mean and SD of each skin collagen parameter are compared in those participants who developed microalbuminuria or worse (red bars) between the end of the DCCT and EDIC year 9–10 versus those who did not develop microalbuminuria ( ). All values are adjusted for age and diabetes duration at the time of the biopsy.
Univariate risk factors for progression of nephropathy in the skin biopsy cohort are shown in Table 2. The mean A1C level during the DCCT and during the EDIC study were both higher in progressors. The prevalence of hypertension was significantly higher (25.0 vs. 8.6%, P = 0.0281), but mean blood pressure was higher with only borderline statistical significance (92.7 vs. 88.2, P = 0.0555) at close out of the DCCT in the progressors. LDL cholesterol and AER were also significantly higher at that time.
In multivariate logistic regression analyses (Table 4), nephropathy progression was predicted by the DCCT mean A1C (R2 = 0.06, P = 0.0012), more strongly by the EDIC study mean A1C (R2 = 0.19, P < 0.0001), and by the log of the DCCT close-out AER (R2 = 0.08, P = 0.0002). The pattern of prediction by collagen parameters was similar to that of the retinopathy outcomes. The furosine and CML combination was again a significant predictor of progression of nephropathy, explaining most of the variation in risk attributable to the whole panel of collagen parameters (R2 = 0.11, P = 0.0001) and independent of the mean DCCT A1C and DCCT close-out AER (R2 = 0.08, P = 0.0014). By contrast, DCCT A1C was no longer predictive of nephropathy progression when adjusted for the combination of furosine and CML (R2 = 0.0000, P = 0.9643). The remaining four—collagen parameter subblock was not significantly predictive of nephropathy progression after adjustment for furosine and CML. The furosine and CML combination was a significant nephropathy predictor, independent of the EDIC study mean A1C, but the latter also remained significant after adjustment for the two collagen parameters.
TABLE 4.
Summary of multiple multivariate logistic regressions for nephropathy
| Covariate effects from multiple models |
df | χ2 | P value | R2 |
|---|---|---|---|---|
| Unadjusted effect | ||||
| DCCT mean A1C | 1 | 10.4 | 0.0012 | 0.062 |
| EDIC study mean A1C | 1 | 32.0 | <0.0001 | 0.189 |
| Log DCCT close-out AER | 1 | 13.6 | 0.0002 | 0.081 |
| Furosine, CML, pentosidine, fluorescence, acid/pepsin soluble |
6 | 19.3 | 0.0036 | 0.114 |
| Pentosidine, fluorescence, acid/pepsin soluble |
4 | 12.6 | 0.0135 | 0.075 |
| Furosine, CML | 2 | 18.2 | 0.0001 | 0.108 |
| Furosine | 1 | 13.4 | 0.0002 | 0.080 |
| CML | 1 | 10.2 | 0.0014 | 0.060 |
| Adjusted effect | ||||
| DCCT mean A1C effect adjusted for |
||||
| Furosine, CML | 1 | 0.0 | 0.9643 | 0.000 |
| Furosine | 1 | 0.2 | 0.6413 | 0.001 |
| CML | 1 | 4.8 | 0.0278 | 0.029 |
| DCCT mean A1C, log AER effect adjusted for |
||||
| Furosine, CML | 2 | 10.8 | 0.0046 | 0.064 |
| EDIC study mean A1C effect adjusted for |
||||
| Furosine, CML | 1 | 23.1 | <0.0001 | 0.137 |
| Furosine | 1 | 21.8 | <0.0001 | 0.129 |
| CML | 1 | 26.0 | <0.0001 | 0.154 |
| Furosine, CML effect adjusted for |
||||
| Pentosidine, fluorescence, acid/pepsin soluble |
2 | 11.0 | 0.0041 | 0.065 |
| DCCT mean A1C, log | ||||
| AER | 2 | 13.1 | 0.0014 | 0.078 |
| DCCT mean A1C | 2 | 12.8 | 0.0016 | 0.076 |
| EDIC study mean A1C | 2 | 14.4 | 0.0008 | 0.085 |
| Pentosidine, fluorescence, acid/pepsin soluble effect adjusted for |
||||
| Furosine, CML | 4 | 4.5 | 0.3394 | 0.027 |
| Furosine effect adjusted for | ||||
| DCCT mean A1C | 1 | 7.1 | 0.0079 | 0.042 |
| EDIC study mean A1C | 1 | 7.1 | 0.0076 | 0.042 |
| CML effect adjusted for | ||||
| DCCT mean A1C | 1 | 6.3 | 0.0123 | 0.037 |
| EDIC study mean A1C | 1 | 10.7 | 0.0011 | 0.064 |
Dependent variable: development of microalbuminuria or worse from DCCT close out through EDIC study year 10. As defined in the statistical methods section, χ2 and P values are from likelihood ratio test, and R2 is entropy R2.
Furosine alone (R2 = 0.08, P = 0.0002) and CML alone (R2 = 0.06, P = 0.0014) each predicted development of nephropathy, independently of the mean DCCT A1C (furosine R2 = 0.04, P = 0.0079 and CML R2 = 0.04, P = 0.0123). Furosine and CML each predicted nephropathy after adjustment for mean EDIC study A1C. However, whereas the mean DCCT A1C lost its significance when adjusted for furosine and CML, mean EDIC study A1C did not. For each 1-SD increase of furosine or CML, the ORs for progression of nephropathy were 2.03 (95% CI 1.38–2.98, P = 0.0003) and 1.81 (1.24–2.64, P = 0.002), respectively.
DISCUSSION
The present study provides the first demonstration, to our knowledge, that skin levels of glycated collagen (furosine), an Amadori product of glucose, and of a specific AGE, namely CML, can predict the subsequent progression of diabetic microvascular complications in people with type 1 diabetes, even for as long as the ensuing 10 years. The strength and consistency of the association in multivariate analyses and the biological gradient it exhibits support the inference that a causal relationship of glycation and AGE formation with the risks of retinopathy and nephropathy may exist. While levels of glycation products could not be measured in the retina or the kidney of the DCCT subjects, previous studies have revealed correlations among various adducts in diabetic human tissues (16).
The independence of the predictive association of skin collagen glycation and AGE formation with progression of complications from frequently measured A1C both before and after the skin biopsy suggests that this relationship is not just a reflection of chronically elevated plasma glucose levels. This is an important distinction because hyperglycemia clearly drives glycation of hemoglobin as well as glycation of collagen and AGE formation. Indeed, skin collagen furosine and AGEs correlate well with preceding A1C (11). However, when preceding chronic hyperglycemia (expressed as the mean DCCT A1C) is adjusted for the furosine and CML levels it led to, its own strong predictive power can be substituted for by the skin collagen glycation product and the AGE. By contrast, subsequent hyperglycemia (expressed as the mean EDIC study A1C) retained its predictive power after adjustment for the preceding skin collagen levels of furosine and CML. Most previous studies (17–19) have shown only cross-sectional associations between AGEs and complications in various cohorts of type 1 and type 2 diabetic individuals and have not taken into account the coexisting correlations between AGEs and A1C. In our own previous cross-sectional study, the associations between complications and AGEs were largely independent of A1C (11). Another study (20) reported an inverse association between CML concentrations in protein from memory T-cells and years of retinopathy-free diabetes that was also independent of A1C.
The possible pathogenetic significance of glucose bound to collagen (furosine) as a predictor of complications qualitatively parallels that of glucose bound to hemoglobin (A1C) as a predictor, since both are simply glycated molecules and not AGEs. However, as illustrated in Fig. 2, a high furosine level (>Q3) with a low level of A1C (<Q3) was associated with a higher prevalence of progression of retinopathy of 50% than was a high level of A1C (>Q3) with a low level of furosine (<Q3), where the prevalence was only 22%. The level of furosine in skin collagen correlated strongly with the A1C concentration measured for up to 1 year before the biopsy (11). Nonetheless, furosine was an independent predictor, even after adjustment for A1C (Table 3) and at both the highest and lowest levels of A1C (Fig. 2). Furosine also contributed more to the variation in retinopathy than did A1C and was a stronger predictor (Table 3). This at least suggests that the proclivity to be glycated of collagen, or other extracellular or intracellular proteins for which collagen might only be a marker, is a factor, in addition to and independent of the actual ambient glucose level, in the pathogenesis of micro-vascular complications. Glycation of mesangium, in fact, has been proposed as one mediator in the development of diabetic nephropathy (21). Furthermore, ACE inhibitors (22) and pyridoxamine (23,24) reduce the development of diabetic nephropathy, concurrent with a decreased accumulation of AGEs resulting from glycation.
Nonetheless, it must be noted that there are other reasons why A1C and furosine could have different relations to average glycemic levels and different predictive powers for complications. For example, interindividual differences in glycation of hemoglobin at similar blood glucose levels that are not explained by differences in erythrocyte survival have been reported (25). Moreover, A1C may be partially enzymatically deglycated (26–28), while no such reaction has thus far been discovered for furosine incorporated within extracellular collagen. The role of glycation may also be questioned on the grounds that high-dose thiamine and benfotiamine can prevent diabetic nephropathy without decreasing A1C or furosine levels (29).
Although CML is in part a downstream product of furosine, thus arising from hyperglycemia, CML is also a product of lipid peroxidation and glycoxidation (30) and of metal and peroxynitrite catalyzed oxidative stress (31); overproduction of reactive oxygen species in mitochondria exposed to excessive cellular flux of glucose contributes to CML formation (32,33). However, other products of oxidative stress such as ortho-tyrosine and methionine sulfoxide have not been elevated in skin collagen from diabetic humans, even though CML was present in excess (34). CML, whatever its origin, and Amadori products of glycation are found in increased amounts in the retina and kidneys of diabetic animals (35–37), along with other damaging AGEs, and in human diabetic retinopathy (35) and nephropathy (38). CML has been found to have detrimental biological effects by activating the RAGE receptor in one study (39) but not another (40), where endotoxin-free ribose-BSA was the ligand used. CML may perpetuate a vicious proinflammatory cycle and stimulate extracellular matrix production and thereby contribute to progression of nephropathy (40–42). Small increases in glomerular protein CML were partially reversed in the course of benfotiamine therapy that prevented diabetic nephropathy in rats (29). The present findings support the relevance of such CML observations in animals to human type 1 diabetes.
The multivariate modeling results consistently suggest that variation in the risks of progression of both retinopathy and nephropathy attributable to preceding glycemia can be partly explained by the skin collagen levels of furosine and CML. A single pathway or similar pathways could lead to both complications. However, furosine and CML account for only a portion of the variance in retinopathy and nephropathy. Alternatively, it is possible that CML and other AGEs in collagen may be long-lived biomarkers of damage produced by other molecular mechanisms in the patients’ past, for example stemming from methylglyoxal, which is also present in elevated levels in diabetic tissues (43). Glycation of extracellular collagen may also only be a marker for glycation of intracellular proteins and other macromolecules, with harmful cellular consequences. Moreover, glycation and AGE formation (1,2) are not the sole mechanisms of hyperglycemic damage that have been uncovered (44). Other pathways demonstrated in diabetic animals (1,2,32) need to be further studied in humans. The roles of protein kinase C and aldose reductase activation, hexosamine production, insufficient activity of superoxide dismutase, and increased oxidative stress should be explored with emphasis on the abilities of unique biomarkers of each pathway to predict the development and progression of complications over time. Nonetheless, the present results reaffirm the possibility that developing safe drugs that block glycation (5) or break AGE cross-links (45) or that interfere with a damaging pathway that includes CML as a component may have the potential to reduce the development or progression of both retinopathy and nephropathy. In a randomized clinical trial (46), aminoguanidine, an inhibitor of AGE formation, reduced urinary protein excretion and progression of retinopathy but failed to benefit significantly the primary outcome measure of a doubling of serum creatinine.
The DCCT/EDIC study has clearly shown that prior intensive treatment and lower mean A1C during the DCCT period continue to exert a beneficial effect during the EDIC study on retinopathy for at least 7 years (47) and on nephropathy for at least 7–8 years (48). This beneficial effect persists even though the large differences in A1C between the two formerly randomized treatment groups dissipated during the EDIC study (48). Our findings suggest a plausible mechanism for this phenomenon that we call “metabolic memory.” A damaging effect of AGE (e.g., CML) formation in long-lived protein molecules such as collagen, which has a half-life of 15 years in normal human skin (49), could explain why the beneficial effects of intensive therapy and the deleterious effects of conventional therapy persist. On the other hand, this would not apply to simple glycated collagen (furosine), which has a much shorter half-life. Thus, furosine in collagen may be reporting preceding periods of hyperglycemic damage without necessarily mediating that damage itself.
Certain limitations of these results should be noted. Skin collagen parameter measurements were available from only a single biopsy at a single point in time. We have thus far not been able to determine the variability in these levels. We do not know whether skin collagen changes in humans quantitatively represent similar changes in their retina and kidneys, although diabetic animal studies (35,36) demonstrate a wide tissue distribution of AGEs. Finally, whether the observations in this research cohort are generalizable to the whole population with type 1 diabetes is unknown.
In summary, measurements of skin collagen furosine (glycated collagen) and AGEs, especially CML, predict the risk of future progression of retinopathy over 10 years and nephropathy over 9–10 years in individuals with type 1 diabetes. Their effects are independent of the preceding A1C levels or those later present during progression of these complications. Thus, they may have effects downstream from hyperglycemia. These human data strengthen the hypothesis that glycation and AGE formation may play pathogenetic roles in the development of these complications.
ACKNOWLEDGMENTS
This study was supported by a grant from the American Diabetes Association and grants and a contract from the National Institute of Diabetes and Digestive and Kidney Diseases (NIDDK UO1 AM 30628), the National Institute of Aging (AG 05601 and AG 18629), National Institutes of Health (DK 57733), and the participating Clinical Research Centers at University Hospitals of Cleveland (M01 RR00080), MA General Hospital (M01 RR01066), Albert Einstein College of Medicine (RR12248), Mayo Clinic (RR01066), University of California San Diego (RR00827), University of Iowa (RR00059), and Washington University (RR00036).
We thank Dr. David Nathan and Dr. John Lachin for their critical review of the manuscript and Theresa Bongorno for its skillful preparation.
Glossary
- AER
albumin excretion rate
- AGE
advanced glycation end product
- CML
Nε-(carboxymethyl)-lysine
- DCCT
Diabetes Control and Complications Trial
- EDIC
Epidemiology of Diabetes Interventions and Complications
APPENDIX
The DCCT Skin Collagen Ancillary Study Group. Albert Einstein College of Medicine, Bronx, NY: H. Shamoon and H. Duffy; Case Western Reserve University, Cleveland, OH: S.G., W.D., and E. Brown; Massachusetts General Hospital, Boston, MA: D. Nathan and M. Larkin; Mayo Foundation, Rochester, MN: F.J. Service and A.L. Schmidt; University of California, San Diego, CA: O. Kolterman and G. Lorenzi; University of Iowa, Iowa City, IA: W.S., R. Zeitler, and M. Bayless; University of South Florida, Tampa, FL: J.M. and N. Grove; Washington University, St. Louis, MO: J. Santiago,† J. McGill, and L. Levandoski.
Footnotes
Deceased.
A complete list of the members of the DCCT Skin Collagen Ancillary Study Group can be found in the APPENDIX.
The costs of publication of this article were defrayed in part by the payment of page charges. This article must therefore be hereby marked “advertisement” in accordance with 18 U.S.C. Section 1734 solely to indicate this fact.
REFERENCES
- 1.Brownlee M. Negative consequences of glycation. Metabolism. 2000;49:9–13. doi: 10.1016/s0026-0495(00)80078-5. [DOI] [PubMed] [Google Scholar]
- 2.King GL, Brownlee M. The cellular and molecular mechanisms of diabetes complications. Endocrinol Metab Clin North Am. 1996;25:255–270. doi: 10.1016/s0889-8529(05)70324-8. [DOI] [PubMed] [Google Scholar]
- 3.Wilkinson-Berka JL, Kelly DJ, Koerner SM, Jaworski K, Davis B, Thallas V, Cooper ME. ALT-946 and aminoguanidine, inhibitors of advanced glycation, improve severe nephropathy in the diabetic transgenic (mREN-2)27 rat. Diabetes. 2002;51:3283–3289. doi: 10.2337/diabetes.51.11.3283. [DOI] [PubMed] [Google Scholar]
- 4.Twigg SM, Cao Z, MCLennan SV, Burns WC, Brammar G, Forbes JM, Cooper ME. Renal connective tissue growth factor induction in experimental diabetes is prevented by aminoguanidine. Endocrinology. 2002;143:4907–4915. doi: 10.1210/en.2002-220619. [DOI] [PubMed] [Google Scholar]
- 5.Thornalley PJ. Use of aminoguanidine (Pimagedine) to prevent the formation of advanced glycation endproducts. Arch Biochem Biophys. 2003;419:31–40. doi: 10.1016/j.abb.2003.08.013. [DOI] [PubMed] [Google Scholar]
- 6.Gardiner TA, Anderson HR, Stitt AW. Inhibition of advanced glycation end-products protects against retinal capillary basement membrane expansion during long-term diabetes. J Pathol. 2003;201:328–333. doi: 10.1002/path.1429. [DOI] [PubMed] [Google Scholar]
- 7.Hammes HP, Brownlee M, Edelstein D, Saleck M, Martin S, Federlin K. Aminoguanidine treatment inhibits the development of experimental diabetic retinopathy. Proc Natl Acad Sci. 1991;88:11555–11558. doi: 10.1073/pnas.88.24.11555. [DOI] [PMC free article] [PubMed] [Google Scholar]
- 8.Kern TS, Engerman RL. Pharmacological inhibition of diabetic retinopathy. Diabetes. 2001;50:1636–1642. doi: 10.2337/diabetes.50.7.1636. [DOI] [PubMed] [Google Scholar]
- 9.Forbes JM, Thallas V, Thomas MC, Founds HW, Burns WC, Jerums G, Cooper ME. The breakdown of preexisting advanced glycation end products is associated with reduced renal fibrosis in experimental diabetes. FASEB. 2003;17:1762–1764. doi: 10.1096/fj.02-1102fje. [DOI] [PubMed] [Google Scholar]
- 10.Thallas-Bonke V, Lindschau C, Rizkalla B, Bach LA, Boner G, Meier M, Haller H, Cooper ME, Forbes JM. Attenuation of extracellular matrix accumulation in diabetic nephropathy by the advanced glycation end product cross-link breaker ALT-711 via a protein kinase C-α–dependent pathway. Diabetes. 2004;53:2921–2930. doi: 10.2337/diabetes.53.11.2921. [DOI] [PubMed] [Google Scholar]
- 11.Monnier VM, Bautista O, Kenny D, Sell DR, Fogarty J, Dahms W, Cleary PA, Lachin J, Genuth S. Skin collagen glycation, glycoxidation, and cross-linking are lower in subjects with long-term intensive versus conventional therapy of type 1 diabetes: relevance of glycated collagen products versus HbA1c as markers of diabetic complications. DCCT Skin Collagen Ancillary Study Group. Diabetes Control and Complications Trial. Diabetes. 1999;48:870–880. doi: 10.2337/diabetes.48.4.870. [DOI] [PMC free article] [PubMed] [Google Scholar]
- 12.The Diabetes Control and Complications Trial Research Group The effect of intensive treatment of diabetes on the development and progression of long-term complications in insulin-dependent diabetes mellitus. N Engl J Med. 1993;329:977–986. doi: 10.1056/NEJM199309303291401. [DOI] [PubMed] [Google Scholar]
- 13.Epidemiology of Diabetes Interventions and Complications (EDIC) Research Group Epidemiology of Diabetes Interventions and Complications (EDIC): design, implementation, and preliminary results of a long-term follow-up of the Diabetes Control and Complications Trial cohort. Diabetes Care. 1999;22:99–111. doi: 10.2337/diacare.22.1.99. [DOI] [PMC free article] [PubMed] [Google Scholar]
- 14.The DCCT Research Group Feasibility of centralized measurements of glycated hemoglobin in the Diabetes Control and Complications Trial: a multicenter study. Clin Chem. 1987;33:2267–2271. [PubMed] [Google Scholar]
- 15.Lachin JM. Biostatistical Methods: The Assessment of Relative Risks. John Wiley & Sons; New York: 2000. [Google Scholar]
- 16.Sell DR, Biemel KM, Reihl O, Lederer MO, Strauch CM, Monnier VM. Glucosepane is a major protein cross-link of the senescent human extra-cellular matrix. J Biol Chem. 2005;280:12310–12315. doi: 10.1074/jbc.M500733200. [DOI] [PubMed] [Google Scholar]
- 17.Buckingham B, Reiser KM. Relationship between the content of lysyl oxidase-dependent cross-links in skin collagen, nonenzymatic glycosylation, and long-term complications in type 1 diabetes mellitus. J Clin Invest. 1990;86:1046–1054. doi: 10.1172/JCI114807. [DOI] [PMC free article] [PubMed] [Google Scholar]
- 18.Beisswenger PJ, Moore LL, Brinkck-Johnsen T, Curphey TJ. Increased collagen-linked pentosidine levels and advanced glycosylation end products in early diabetic nephropathy. J Clin Invest. 1993;92:212–217. doi: 10.1172/JCI116552. [DOI] [PMC free article] [PubMed] [Google Scholar]
- 19.Beisswenger PJ, Makita Z, Curphey TJ, Moore LL, Jean S, Brinck-Johnsen T, Bucala R, Vlassara H. Formation of immunochemical advanced glycosylation end products precedes and correlates with early manifestations of renal and retinal disease in diabetes. Diabetes. 1995;44:824–829. doi: 10.2337/diab.44.7.824. [DOI] [PubMed] [Google Scholar]
- 20.Hammes HP, Brownlee M, Lin J, Schleicher E, Bretzel RG. Diabetic retinopathy risk correlates with intracellular concentrations of the glycoxidation product Nε-(carboxymethyl) lysine independently of glycohaemoglobin concentrations. Diabetologia. 1999;42:603–607. doi: 10.1007/s001250051201. [DOI] [PubMed] [Google Scholar]
- 21.McLennan SV, Martell SKY, Yue DK. Effects of mesangium glycation on matrix metalloproteinase activities: possible role in diabetic nephropathy. Diabetes. 2002;51:2612–2618. doi: 10.2337/diabetes.51.8.2612. [DOI] [PubMed] [Google Scholar]
- 22.Forbes JM, Cooper ME, Thallas V, Burns WC, Thomas MC, Brammar GC, Lee F, Grant SL, Burrell LA, Jerums G, Osicka TM. Reduction of the accumulation of advanced glycation end products by ACE inhibition in experimental diabetic nephropathy. Diabetes. 2002;51:3274–3282. doi: 10.2337/diabetes.51.11.3274. [DOI] [PubMed] [Google Scholar]
- 23.Stitt A, Gardiner TA, Alderson NL, Canning P, Frizzell N, Duffy N, Boyle C, Januszewski AS, Chachich M, Baynes JW, Thorpe SR. The AGE inhibitor pyridoxamine inhibits development of retinopathy in experimental diabetes. Diabetes. 2002;51:2826–2832. doi: 10.2337/diabetes.51.9.2826. [DOI] [PubMed] [Google Scholar]
- 24.Degenhardt TP, Alderson NL, Arrington DD, Beattie RJ, Basgen JM, Steffes MW, Thorpe SR, Baynes JW. Pyridoxamine inhibits early renal disease and dyslipidemia in the streptozotocin-diabetic rat. Kidney Int. 2002;61:939–950. doi: 10.1046/j.1523-1755.2002.00207.x. [DOI] [PubMed] [Google Scholar]
- 25.Hempe JM, Gomez R, McCarter RJ, Jr, Chalew SA. High and low hemoglobin glycation phenotypes in type 1 diabetes: a challenge for interpretation of glycemic control. J Diabetes Complications. 2002;16:313–320. doi: 10.1016/s1056-8727(01)00227-6. [DOI] [PubMed] [Google Scholar]
- 26.Delpierre G, Collard F, Fortpied J, Van Schaftingen E. Fructosamine 3-kinase is involved in an intracellular deglycation pathway in human erythrocytes. Biochem J. 2002;365:801–808. doi: 10.1042/BJ20020325. [DOI] [PMC free article] [PubMed] [Google Scholar]
- 27.Delpierrre G, Vertommen D, Communi D, Rider MH, Van Schaftingen E. Identification of fructosamine residues deglycated by fructosamine-3-kinase in human hemoglobin. J Biol Chem. 2004;279:27613–27620. doi: 10.1074/jbc.M402091200. [DOI] [PubMed] [Google Scholar]
- 28.Wu X, Monnier VM. Enzymatic deglycation of proteins. Arch Biochem Biophys. 2003;419:16–24. doi: 10.1016/j.abb.2003.08.011. [DOI] [PubMed] [Google Scholar]
- 29.Babaei-Jadidi R, Karachalias N, Ahmed N, Battah S, Thornalley PJ. Prevention of incipient diabetic nephropathy by high-dose thiamine and benfotiamine. Diabetes. 2003;52:2110–2120. doi: 10.2337/diabetes.52.8.2110. [DOI] [PubMed] [Google Scholar]
- 30.Fu MX, Requena JR, Jenkins AJ, Lyons TJ, Baynes JW, Thorpe SR. The advanced glycation end product, Nε-(carboxymethyl)lysine, is a product of both lipid peroxidation and glycoxidation reactions. J Biol Chem. 1996;271:9982–9986. doi: 10.1074/jbc.271.17.9982. [DOI] [PubMed] [Google Scholar]
- 31.Nagai R, Unno Y, Hayashi MC, Masuda S, Hayase F, Kinae N, Horiuchi S. Peroxynitrite induces formation of Nε-(carboxymethyl)lysine by the cleavage of Amadori product and generation of glucosone and glyoxal from glucose: novel pathways for protein modification by peroxynitrite. Diabetes. 2002;51:2833–2839. doi: 10.2337/diabetes.51.9.2833. [DOI] [PubMed] [Google Scholar]
- 32.Brownlee M. Biochemistry and molecular cell biology of diabetes complications. Nature. 2001;414:813–820. doi: 10.1038/414813a. [DOI] [PubMed] [Google Scholar]
- 33.Nagai R, Ikeda K, Higashi T, Sano H, Jinnouchi Y, Araki T, Horiuchi S. Hydroxyl radical mediates Nε-(carboxymethyl)lysine formation from Amadori product. Biochem Biophys Res Comm. 1997;234:167–172. doi: 10.1006/bbrc.1997.6608. [DOI] [PubMed] [Google Scholar]
- 34.Wells-Knecht MC, Lyons TJ, McCance DR, Thorpe SR, Baynes JW. Age-dependent increase in Ortho-tyrosine and Methionine sulfoxide in human skin collagen is not accelerated in diabetes: evidence against a generalized increase in oxidative stress in diabetes. J Clin Invest. 1997;100:839–846. doi: 10.1172/JCI119599. [DOI] [PMC free article] [PubMed] [Google Scholar]
- 35.Hammes HP, Alt A, Niwa T, Clausen JT, Bretzel RG, Brownlee M, Schleicher ED. Differential accumulation of advanced glycation end products in the course of diabetic retinopathy. Diabetologia. 1999;42:728–736. doi: 10.1007/s001250051221. [DOI] [PubMed] [Google Scholar]
- 36.Karachalias N, Babaei-Jadidi R, Ahmed N, Thornalley PJ. Accumulation of frucotsyl-lysine and advanced glycation end products in the kidney, retina and peripheral nerve of streptozotocin-induced diabetic rats. Biochem Soc Trans. 2003;31:1423–1425. doi: 10.1042/bst0311423. [DOI] [PubMed] [Google Scholar]
- 37.Thornalley PJ, Battah S, Ahmed N, Karachalias N, Agalou S, Babaei-Jadidi R, Dawnay A. Quantitative screening of advanced glycation endproducts in cellular and extracellular proteins by tandem mass spectrometry. Biochem J. 2003;375:581–592. doi: 10.1042/BJ20030763. [DOI] [PMC free article] [PubMed] [Google Scholar]
- 38.Suzuki D, Miyata T, Saotome N, Horie K, Inagi R, Yasuda Y, Uchida K, Izuhara Y, Yagame M, Sakai H, Kurokawa K. Immunohistochemical evidence for an increased oxidative stress and carbonyl modification of proteins in diabetic glomerular lesions. J Am Soc Nephrol. 1999;10:822–832. doi: 10.1681/ASN.V104822. [DOI] [PubMed] [Google Scholar]
- 39.Kislinger T, Fu C, Huber B, Qu W, Taguchi A, Du Yan S, Hofmann M, Yan SF, Pischetsrieder M, Stern D, Schmidt AM. Nε (carboxymethyl)lysine modifications of proteins are ligands for RAGE that activate cell signaling pathways and modulate gene expression. J Biol Chem. 1999;274:31740–31749. doi: 10.1074/jbc.274.44.31740. [DOI] [PubMed] [Google Scholar]
- 40.Valencia JV, Mone M, Zhang J, Weetall M, Buxton FP, Hughes TE. Divergent pathways of gene expression are activated by the RAGE ligands S100b and AGE-BSA. Diabetes. 2004;53:743–751. doi: 10.2337/diabetes.53.3.743. [DOI] [PubMed] [Google Scholar]
- 41.Lassila M, Seah KK, Allen TJ, Thallas V, Thomas MC, Candido R, Burns WC, Forbes JM, Calkin AC, Cooper ME, Jandeleit-Dahm KA. Accelerated nephropathy in diabetic apolipoprotein E-knockout mouse: role of advanced glycation end products. J Am Soc Nephrol. 2004;15:2125–2138. doi: 10.1097/01.ASN.0000133025.23732.46. [DOI] [PubMed] [Google Scholar]
- 42.Wendt TM, Tanji N, Guo J, Kislinger TR, Qu W, Lu Y, Bucciarelli LG, Rong LL, Moser B, Markowitz GS, Stein G, Bierhaus A, Liliensiek B, Arnold B, Nawroth PP, Stern DM, D’Agati VD, Schmidt AM. RAGE drives the development of glomerulosclerosis and implicates podocyte activation in the pathogenesis of diabetic nephropathy. Am J Pathol. 2003;162:1123–1137. doi: 10.1016/S0002-9440(10)63909-0. [DOI] [PMC free article] [PubMed] [Google Scholar]
- 43.Shamsi FA, Partal A, Sady C, Glomb MA, Nagaraj RH. Immunological evidence for methylglyoxal-derived modifications in vivo: determination of antigenic epitopes. J Biol Chem. 1998;273:6928–6936. doi: 10.1074/jbc.273.12.6928. [DOI] [PubMed] [Google Scholar]
- 44.Sheetz MJ, King GL. Molecular understanding of hyperglycemia’s adverse effects for diabetes complications. JAMA. 2002;288:2579–2588. doi: 10.1001/jama.288.20.2579. [DOI] [PubMed] [Google Scholar]
- 45.Vasan S, Foiles P, Founds H. Therapeutic potential of breakers of advanced glycation end product-protein crosslinks. Arch Biochem Biophys. 2003;419:89–96. doi: 10.1016/j.abb.2003.08.016. [DOI] [PubMed] [Google Scholar]
- 46.Bolton WK, Cattran DC, Williams ME, Adler SG, Appel GB, Cartwright K, Foiles PG, Freedman BI, Raskin P, Ratner RE, Spinowitz BS, Whittier FC, Wuerth JP. the ACTION I Investigator Group: Randomized trial of an inhibitor of formation of advanced glycation end products in diabetic nephropathy. Am J Nephrol. 2004;24:32–40. doi: 10.1159/000075627. [DOI] [PubMed] [Google Scholar]
- 47.Writing Team for the Diabetes Control and Complications Trial/Epidemiology of Diabetes Interventions and Complications Research Group Effect of intensive therapy on the microvascular complications of type 1 diabetes mellitus. JAMA. 2002;287:2563–2569. doi: 10.1001/jama.287.19.2563. [DOI] [PMC free article] [PubMed] [Google Scholar]
- 48.Writing Team for the Diabetes Control and Complications Trial/Epidemiology of Diabetes Interventions and Complications Research Group Sustained effect of intensive treatment of type 1 diabetes mellitus on development and progression of diabetic nephropathy: the Epidemiology of Diabetes Interventions and Complications (EDIC) study. JAMA. 2003;290:2159–2167. doi: 10.1001/jama.290.16.2159. [DOI] [PMC free article] [PubMed] [Google Scholar]
- 49.Verzijl N, DeGroot J, Thorpe SR, Bank RA, Shaw JN, Lyons TJ, Bijlsma JW, Lafeber FP, Baynes JW, TeKoppele JM. Effect of collagen turnover on the accumulation of advanced glycation end products. J Biol Chem. 2000;275:39027–39031. doi: 10.1074/jbc.M006700200. [DOI] [PubMed] [Google Scholar]