

Abstract
Objectives. We assessed the impact of existing best-practice physical activity programs for older adults on physical activity participation and health-related outcomes.
Methods. We used a multisite, randomized trial with 544 older adults (mean age 66 years) and measures at baseline, 5, and 10 months to test the impact of a multiple-component physical activity program compared with results for a control group that did not participate in such a program.
Results. For adults who participated in a multiple-component physical activity program, we found statistically significant benefits at 5 and 10 months with regard to self-efficacy for exercise adherence over time (P < .001), adherence in the face of barriers (P = .01), increased upper- and lower-body strength (P = .02, P = .01), and exercise participation (P = .01).
Conclusions. Best-practice community-based physical activity programs can measurably improve aspects of functioning that are risk factors for disability among older adults. US public policy should encourage these inexpensive health promotion programs.
Moderate exercise 3 to 5 times per week for at least 30 minutes produces multiple health benefits for older adults at most levels of functional ability.1 However, older adults are the most sedentary population in the United States,2,3 with more than 60% failing to participate in regular physical activity.4
A number of randomized controlled trials have tested specific exercise programs for older adults. To our knowledge, Wilcox et al. is the only study that has examined the impact of evidence-based programs adopted by community providers of physical activity programs for older adults.5 This study found that older adults who participated in 2 newly adopted programs experienced statistically significant benefits regarding physical activity participation, depression, stress, and body mass index. However, that study did not examine the impact of exercise programs already existing in the community. We sought to address this gap with our study.
Community organizations like senior centers and YMCAs are the primary providers of physical activity programs for older adults in the United States. These providers strive to achieve a balance among the programs they offer, taking into consideration such factors as exercise science, older adults' preferences, and real-world feasibility. In 2003, the Center for Healthy Aging of the National Council on Aging (NCOA) conducted a national competition to identify 10 best-practice physical activity programs operated by community organizations serving older adults. The competition was funded by the Robert Wood Johnson Foundation and was conducted in collaboration with the Center for Research on Health and Aging (CRHA) at the University of Illinois at Chicago. The Centers for Disease Control and Prevention's Healthy Aging Research Network, the Active Aging Partnership, and nationally known physical activity experts helped NCOA develop best-practice criteria based on findings from the literature and expert judgment.
Programs that participated in the national competition had to serve a large population of older adults, have a solid history of physical activity programming, and collect and evaluate outcomes data. The NCOA hosted application forms on its Web site, posted notices of the competition on Web sites and e-mail discussion lists, and networked with other national organizations to publicize the competition. More than 1100 competition applications were downloaded, and 83 were submitted. National experts scored the applications based on several criteria, including years of operation, numbers of clients served, types of instructors used, inservice education for instructors, and monitoring of participant attendance and outcomes. The top 29 applicants participated in telephone interviews that elicited more detailed information concerning each organization's approach to program development and supervision, instructor training, collection and analysis of outcomes data, and sustainability. Finally, 10 programs were identified as national best-practice programs based on all of the above information. The NCOA awarded $1000 and a certificate of achievement to each of the 10 winning programs.
A site visit team that included NCOA staff, researchers from the University of Illinois at Chicago, and other study partners visited the 10 best-practice sites to learn more about program elements, infrastructure support, partnership activities, and other factors that contributed to their success. During the visits, we assessed each site's capacity to participate in the National Impact Study, which would assess the impact of site programs on participants. Based on findings from the site visits, we selected provider sites for participation in our study, recruited and enrolled study participants from those sites, and assessed the impact that participation in a multicomponent physical activity program had on those participants.
METHODS
We used a randomized trial to assess program impact, with baseline measures and posttests at 5 and 10 months. We hypothesized that the outcomes of treatment participants would improve significantly relative to the outcomes of the control group.
We conducted in-person interviews to assess the outcomes described in the next section.
Intermediate Outcomes
Self-efficacy for exercise.
We used a 3-item scale developed by Lorig et al. to assess exercise efficacy.6 This scale is scored by summing responses and dividing them by the total number of items.
Outcome expectations for exercise.
We assessed outcome expectations using a 17-item scale developed by Seymour.7 The measure assesses both beliefs and relative importance of each outcome. Participants rated agreement with statements about the benefits of exercise on a scale of 1 to 5 and rated the importance of each outcome on a scale of 1 to 10. The measure is reliable with Cronbach α of 0.89 for beliefs and 0.97 for importance.7
Exercise adherence self-efficacy.
We used McAuley's barriers scale to assess self-efficacy for exercise adherence in the face of barriers, and we used McAuley's time-adherence scale to assess self-efficacy for continuing to exercise for the 6 months following administration of the test.8 Scores for both scales range from 0 to 100, with scale scores representing the mean of the summed items.
Main Outcomes
Exercise adherence.
We used the 41-item Community Healthy Activities Model Program for Seniors (CHAMPS) questionnaire to assess participation in leisure-time physical activity, moderate and vigorous physical activity, and nonexercise activities.9
Lower-extremity muscle strength.
We used a timed sit–stand test to assess lower extremity muscle strength.10 For this test, participants sat in a straight-back chair and then stood with their arms folded. If they successfully stood, we asked them to stand and sit down 5 times as quickly as possible. We used a stopwatch to measure the cumulative time required to complete all 5 sits and stands to the nearest 10th of a second.
Upper-body strength.
We used an “arm curl” test to assess upper-body strength. We counted the number of times participants could curl a hand weight through the full range of motion in 30 seconds. Women used a 5-pound weight, and men used an 8-pound weight.10
Upper-body flexibility.
We used a “back scratch” test to assess upper-body flexibility.10 While standing, participants used both arms to reach behind their backs, with 1 arm going over the shoulder on that arm's side of the body and reaching down from above, and the other arm going behind the waist on that arm's side of the body and reaching up from below. On the hand reaching down from above, the palm was kept facing the back, and on the hand reaching up from below, the palm was kept facing outward. Participants extended the fingers on both hands and tried to get the fingers of each hand as close as possible to the fingers of the other hand. The interviewer measured the distance between or overlap of the fingers.
Six-minute distance walk.
In the 6-minute distance walk, participants walked as far as possible within 6 minutes, accompanied by a research staff member who used a Rolatape (MM12 series Rolatape, Watseka, IL) to measure the distance walked in feet.10
Body mass index.
For body mass index, interviewers measured height in stockinged feet, and they measured weight in indoor clothing in stockinged feet.
Depression.
We used the 10-item Center for Epidemiological Studies Depression Scale (CES-D) Short Form to assess participants' feelings and emotional states during the prior week.11,12
Health-related quality of life.
We used the Medical Outcomes Study Short Form 36 (SF-36) health survey, which addresses 8 generic dimensions related to health: physical functioning, role disability caused by emotional and physical health, bodily pain, general health, vitality, and general mental health.13 Scale scores range from 0 (poor) to 100 (excellent).
Selection of Study Sites
Criteria for selection of a study site included the strength of the activity program, the site's capacity to enroll a large number of new participants, and heterogeneity across provider types.
The best-practice providers we evaluated during our site visits offered a wide variety of physical activity programs, including such activities as yoga, strength training, and line dancing. Because multiple-component programs that include flexibility activities, aerobic exercise, and strength training in a single class and that meet at least 3 times per week are most likely to achieve positive outcomes,14–16 we limited study participation to providers that already offered this type of program successfully.
During our site visits we learned that many program participants had been enrolled in programs for several years. Because it would be difficult to assess program impact on this population, we asked sites if they could start new classes and recruit at least 125 new enrollees who would be our “treatment” group and 125 control participants. The sites we selected for our study met these criteria or were willing to work to meet them. The remaining sites were at capacity and could not expand services without more resources than those offered by national competition funds.
We also sought diverse provider types so we could capture the heterogeneity among physical activity program providers. The following sites were selected for the study: Resources for Seniors, Inc, a senior services provider in Raleigh, North Carolina; Madison School and Community Recreation, a parks and recreation provider in Madison, Wisconsin; and Holy Cross Hospital, a general hospital in Silver Spring, Maryland. All 3 sites were located in middle-class areas, partnered with local sites (e.g., gyms, schools, and senior centers) to offer programs, and used certified exercise instructors to conduct their programs.
Selection, Randomization, and Surveying of Participants
Participants were 50 years or older, were able to walk independently, were not engaged in a regular program of exercise, and agreed to participate in the study. All participants signed forms indicating their informed consent to study participation. We also obtained physician consent to the participants' participation. Exclusion criteria included being 49 years or younger and regular participation in an exercise program.
At the end of the baseline interview, participants were randomized using numbered envelopes containing the labels “treatment” or “control.” Neither participants nor interviewers were blinded to group assignment. The treatment was a multiple-component physical activity program that provided flexibility activities, low-impact aerobic exercise, and resistance training for 60 minutes 3 times per week over the 10 months for which each participant was observed. Control group participants could enroll in any programs the provider offered except for the multicomponent program, and they could also participate in physical activity programs other than those offered by the provider.
Enrollment occurred between August 2004 and March 2005. Participants were recruited through notices in provider newsletters, flyers posted at the provider sites or distributed at local events, and advertisements in newspapers. The promotional materials featured a toll-free number for people to call if they were interested in participating in the study. The CRHA set up and staffed the study hotline, and CRHA staff conducted the initial phone screening to determine which callers were eligible for the study. Of the 995 persons who called the study hotline, 544 enrolled, 66 were ineligible for participation, and 343 did not participate for a variety of reasons. Of the nonparticipants, 153 failed to complete baseline interviews because of field interviewer absenteeism and turnover. Other reasons for nonparticipation included time conflicts and problems with the provider's distance from the participant. Participation in regular exercise was the primary reason for ineligibility (n = 38). Additionally, CRHA staff were unable to establish follow-up contact with 42 persons who had initally expressed an interest in the study.
CRHA staff transmitted eligible callers' contact information to on-site data collectors at the 3 sites. Baseline interviews were completed in person with 544 participants (289 treatment, 255 control). Posttest interviews were completed at 5 months after baseline with 374 participants (69% of baseline) and at 10 months after baseline with 384 participants (70% of baseline). We gave US $10 gift cards to participants after each interview. Field staff made 10 attempts to schedule posttest interviews. If participants told field staff they were not interested in participating, they were classified as study dropouts and were not contacted again. If field staff could not schedule an in-person interview and if participants said they had a limited amount of time, field staff then conducted telephone interviews as soon as possible using a prioritized list of scales. Field staff provided detailed information regarding the specific circumstances pertaining to arrangements for follow-up interviews to CRHA staff, who also tried to retain participants by conducting telephone interviews in lieu of in-person interviews.
Data Analyses
The study was powered conservatively to enroll 750 participants at baseline across the 3 sites. This target allowed for a generous attrition rate that would yield a sample of 300 participants remaining at 10 months (50 treatment participants and 50 control participants at each site). We obtained 5-month outcomes for 228 (79%) treatment group participants and 145 (57%) control group participants, and we obtained 10-month outcomes for 229 (79%) treatment group participants and 149 (58%) control group participants. A logistic regression model compared those who remained in the study with those who left across the sites.17 We regressed a variable indicating continued participation in the study on each of the outcome variables, on a dummy variable for treatment condition, and on the interaction of each of the outcome variables with the dummy variable for treatment condition. We found significant interactions involving all 3 self-efficacy variables and the timed sit–stand test. The 3 self-efficacy variables were intercorrelated in the range of r = 0.5. To avoid collinearity, we used only 1 variable—baseline exercise efficacy—as a covariate in the outcome analyses to account for differential attrition. However, results did not vary when either the exercise efficacy scores or the timed sit–stand scores were included as covariates. Therefore, we report results without any baseline covariates.
Data analysis involved 1 between-group factor (treatment vs control) and 1 within-participant factor (time). Our treatment of time was nonlinear in that we included indicator variables for the 2 measurement points and we treated the baseline as the reference category. The intervention (main) effect was significant at each site. Because we had repeated-measures data and different numbers of respondents by group over time, we analyzed the data by means of a random-intercept model, which assumes that data are missing at random. A simple random-effects model for the data can be written as
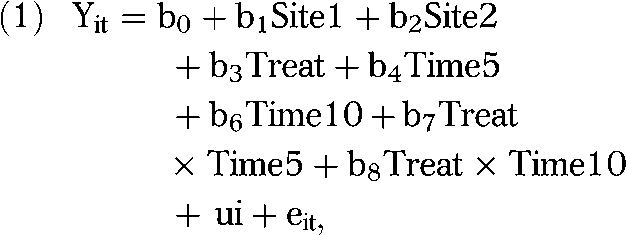 |
where the interaction terms Treat × Time5 and Treat × Time10 test whether the 2 groups differed at the first and second posttests relative to baseline. Effect sizes for each outcome at each time point were computed as the difference between the treatment and control group means at that time point, divided by the pooled standard deviation over groups. We used the Cohen d to measure the strength of the relationships between variables (effect sizes), and we used the Cohen criteria to categorize results as having a small (d = .2), medium (d = .5), or large (d = .8) effect.18
RESULTS
We enrolled 544 (289 treatment, 255 control) participants across the 3 sites. There were no significant differences between study groups at baseline (Table 1). The majority of participants (77%) were women, 16% were minorities, and 53% had annual household incomes under $50 000. The mean age was 66 years in both groups (range = 51–88 years); 47% of participants were aged 50 to 64 years, 37% were aged 65 to 74 years, and 15% were 75 years or older. A large majority of participants (86%) had attended some college. Importantly, 72% were overweight or obese, and 75% reported having at least 1 chronic medical condition.
TABLE 1.
Demographic and Disease Characteristics of Study Participants, by Treatment Group: NCOA-Designated Best-Practice Physical Activity Programs, 2004–2005
| Treatment Group (n = 289), % (No.) | Control Group(n = 255), % (No.) | |
| Age,a y | ||
| 50–64 | 47.4 (121) | 47.5 (137) |
| 65–74 | 38.8 (99) | 36.3 (105) |
| ≥ 75 | 13.7 (35) | 16.3 (47) |
| Women | 76.6 (221) | 78.0 (199) |
| Education | ||
| Less than high school | 0.7 (2) | 1.6 (4) |
| High school | 12.5 (36) | 13.3 (34) |
| At least some college | 86.8 (251) | 85.1 (217) |
| Income ≤ $50 000 | 54.3 (157) | 51.4 (131) |
| Marital status | ||
| Married | 54.7 (158) | 53.7 (137) |
| Divorced | 20.8 (60) | 25.9 (66) |
| Widowed | 14.9 (43) | 13.3 (34) |
| Separated | 1.7 (5) | 1.2 (3) |
| Never married | 5.5 (16) | 3.5 (9) |
| Member of unmarried couple | 2.4 (7) | 2.0 (5) |
| Race/ethnicity | ||
| White | 85.5 (247) | 81.2 (207) |
| African American | 9.7 (28) | 13.3 (34) |
| Hispanic or Latino | 1.4 (4) | 0.4 (1) |
| Asian or Pacific Islander | 1.4 (4) | 2.0 (5) |
| American Indian | 0.3 (1) | 1.2 (3) |
| Other/refused to answer | 1.7 (5) | 2.0 (5) |
| BMI,b kg/m2 | ||
| Underweight | 1.7 (5) | 0.8 (2) |
| Normal | 27.7 (80) | 25.1 (64) |
| Overweight | 33.2 (96) | 38.0 (97) |
| Obese | 37.4 (108) | 36.1 (92) |
| Chronic conditions | ||
| Arthritis | 53.0 (151) | 54.5 (138) |
| Hypertension | 39.6 (114) | 33.9 (86) |
| Diabetes | 14.2 (41) | 11.1 (28) |
| Heart disease | 11.4 (32) | 8.3 (21) |
Note. BMI = body mass index; NCOA = National Council on Aging. There were no significant differences between treatment and control groups with regard to the characteristics listed in this table.
The mean age of the treatment group was 65.8 years, with a range of 51 to 88 years. The mean age of the control group was 65.5 years, with a range of 50 to 87 years.
Underweight was BMI < 18.5 kg/m2, normal weight was BMI = 18.5–24.9 kg/m2, over weight was BMI = 25–29.9 kg/m2, and obesity was BMI ≥ 30 kg/m2.
We tracked class attendance weekly for the treatment group, and we analyzed cumulative 10-month attendance data for all 3 sites descriptively. Overall, 87% of treatment participants attended at least 1 class. Those who attended at least 1 class attended, on average, 59 classes (approximately 55% of the total number of classes offered during the study period), ranging from 1 to 145 classes attended (median = 66). Daily attendance at each site ranged from 42% to 58% of the site's treatment-group population. Staff at the study sites told us these attendance rates were consistent with those they had observed in their other exercise programs.
At 5 months after baseline, treatment group participants improved significantly compared with control group participants in adherence efficacy over time and adherence efficacy in the face of barriers (Table 2). Treatment group participants maintained these improvements at 10 months, at which time they also improved significantly relative to control group participants in exercise efficacy. No between-group differences were found in outcome expectations for exercise at 5 or 10 months.
TABLE 2.
Random-Effects Analysis Comparing Baseline Values to Intermediate Outcomes at 5 and 10 Months: NCOA-Designated Best-Practice Physical Activity Programs, 2004–2005
| Intermediate outcomes at 5 Mos | Intermediate outcomes at 10 Mos | Treatment Group | Treatment × Time at 5 Mos | Treatment × Time at 10 Mos | |
| Lorig self-efficacy scale for exercise | |||||
| b | –0.246 | –0.653 | –0.085 | 0.264 | 0.350 |
| z score | –1.790 | –4.780 | –0.600 | 1.480 | 1.970 |
| P | .074 | <.001 | .552 | .140 | .049 |
| Outcome expectations for exercise | |||||
| b | 0.041 | 0.080 | –0.118 | 0.004 | 0.017 |
| z score | 1.220 | 2.400 | –0.290 | 0.100 | 0.380 |
| P | .222 | .016 | .775 | .922 | .701 |
| McAuley efficacy scale of adherence in the face of barriers | |||||
| b | –10.711 | –12.072 | –0.307 | 6.374 | 3.998 |
| z score | –7.920 | –9.010 | –0.200 | 3.660 | 2.229 |
| P | <.001 | <.001 | .843 | <.001 | .022 |
| McAuley efficacy scale of adherence over time | |||||
| b | –10.635 | –12.570 | –0.953 | 10.629 | 7.694 |
| z score | –5.690 | –6.790 | –0.540 | 4.370 | 3.180 |
| P | <.001 | <.001 | .589 | <.001 | <.001 |
Note. NCOA = National Council on Aging. α < .05.
Scores on the timed sit–stand test and the arm-curl test improved significantly for treatment participants compared with control participants at 5 and 10 months (Table 3). Performance improved in both groups relative to baseline, but the rate of improvement was significantly greater in the treatment group. Treatment group participants also reported significantly higher participation in all types of physical activity than did control group participants at 5 and 10 months, and treatment group participation in moderate physical activity at 5 and 10 months reached borderline levels of statistical significance. Again, participation levels increased in both groups at 5 and 10 months relative to baseline. Treatment group participants increased their frequency of physical activity by an average of 26% over baseline, whereas control group members increased their frequency of physical activity by an average of 9% over baseline. No group differences were seen in scores for CES-D, body mass index, 6-minute walk, back-scratch test, weekly caloric expenditure (which was tracked by the CHAMPS questionnaire), or SF-36 at 5 or 10 months.
TABLE 3.
Random-Effects Analysis Comparing Baseline Values to Main Outcomes at 5 and 10 Months: Participants in NCOA-Designated Best-Practice Physical Activity Programs, 2004–2005
| Main Outcomes at 5 Mos | Main Outcomes at 10 Mos | Treatment Group | Treatment × Time at 5 Mos | Treatment × Time at 10 Mos | |
| CES-D | |||||
| b | –0.003 | –0.405 | 0.164 | 0.092 | 0.430 |
| z score | –0.01 | –1.84 | 0.67 | 0.32 | 1.51 |
| P | .989 | .065 | .503 | .747 | .131 |
| Body mass index | |||||
| b | –0.038 | 0.096 | –0.071 | –0.035 | –0.276 |
| z score | –0.25 | 0.65 | –0.14 | –0.19 | –1.45 |
| P | .799 | .514 | .891 | .853 | .146 |
| Timed sit–stand test | |||||
| b | 2.095 | 2.754 | 0.589 | 2.255 | 2.341 |
| z score | 3.53 | 4.23 | 0.69 | 2.97 | 2.82 |
| P | <.001 | <.001 | .493 | .003 | .005 |
| 6-minute walk | |||||
| b | 0.056 | 0.105 | 0.053 | –0.022 | 0.014 |
| z score | 2.82 | 5.14 | 1.78 | –0.87 | 0.52 |
| P | .005 | .000 | .075 | .383 | .603 |
| Arm-curl test | |||||
| b | 2.355 | 3.800 | 0.374 | 1.012 | 1.281 |
| z score | 6.73 | 10.61 | 0.85 | 2.25 | 2.76 |
| P | <.001 | <.001 | .395 | .025 | .006 |
| Back-scratch test | |||||
| b | 1.298 | 0.793 | 0.125 | –0.443 | 0.403 |
| z score | 5.29 | 3.17 | 0.30 | –1.41 | 1.25 |
| P | <.001 | .002 | .766 | .158 | .210 |
| CHAMPS | |||||
| Caloric expenditure: all PA | |||||
| b | 0.106 | 0.048 | 0.019 | 0.072 | 0.052 |
| z score | 1.65 | 0.73 | 0.28 | 0.88 | 0.61 |
| P | .099 | .465 | .781 | .381 | .539 |
| Caloric expenditure: moderate PA | |||||
| b | 0.061 | –0.039 | –0.062 | 0.059 | 0.035 |
| z score | 0.72 | –0.44 | –0.68 | 0.54 | 0.31 |
| P | .473 | .658 | .497 | .591 | .756 |
| Frequency of exercise: all PA | |||||
| b | 1.733 | 1.654 | 0.281 | 3.199 | 2.976 |
| z score | 1.65 | 1.59 | 0.26 | 2.35 | 2.20 |
| P | .098 | .112 | .798 | .019 | .028 |
| Frequency of exercise: moderate PA | |||||
| b | 1.237 | 1.029 | 0.184 | 1.447 | 1.304 |
| z score | 1.80 | 1.51 | 0.26 | 1.63 | 1.47 |
| P | .072 | .131 | .795 | .104 | .141 |
| MOS SF-36 | |||||
| General health | |||||
| b | –0.416 | –2.350 | –1.383 | 0.095 | 1.624 |
| z score | –0.46 | –2.61 | –1.06 | 0.08 | 1.41 |
| P | .647 | .009 | .288 | .935 | .159 |
| Physical function | |||||
| b | 0.046 | –2.513 | 0.625 | 0.422 | 1.719 |
| z score | 0.04 | –2.21 | 0.36 | 0.29 | 1.17 |
| P | .968 | .027 | .717 | .774 | .240 |
| Physical role | |||||
| b | –4.535 | –6.421 | –3.986 | 3.311 | 3.493 |
| z score | –1.50 | –2.15 | –1.26 | 0.85 | 0.90 |
| P | .133 | .031 | .209 | .396 | .367 |
| Emotional role | |||||
| b | 0.453 | 1.875 | –1.906 | –1.660 | –4.913 |
| z score | 0.21 | 0.88 | –0.87 | –0.59 | –1.76 |
| P | .834 | .381 | .383 | .554 | .078 |
| Social function | |||||
| b | –2.262 | –4.104 | –0.688 | 0.287 | 1.745 |
| z score | –1.42 | –2.59 | –0.45 | 0.14 | 0.85 |
| P | .155 | .010 | .655 | .889 | .396 |
| Bodily pain | |||||
| b | –0.970 | –2.998 | –1.862 | –0.246 | 2.492 |
| z score | –0.71 | –2.21 | –1.21 | –0.14 | 1.42 |
| P | .480 | .027 | .227 | .889 | .156 |
| Vitality | |||||
| b | 0.023 | 1.458 | 2.718 | –1.301 | –2.526 |
| z score | 0.02 | 1.15 | 1.62 | –0.79 | –1.54 |
| P | .985 | .251 | .106 | .429 | .123 |
Note. NCOA = National Council on Aging; CES-D = Center for Epidemiological Studies Depression Scale; CHAMPS = Community Healthy Activities Model Program for Seniors; MOS SF-36 = Medical Outcomes study Short Form 36; PA = physical activity. α < .05.
Effect sizes (Table 4) for exercise efficacy, outcome expectations for exercise, adherence efficacy in the face of barriers, and CES-D were small according to our categorization of effect sizes (discussed in the “Data Analyses” section). The effect size for adherence efficacy over time was 0.592 at 5 months but decreased to 0.257 at 10 months. Effect sizes for body mass index were small at both time points, but trends favored treatment group participants. Effect sizes for all of the performance measures were small, as were the effect sizes for the scores on the CHAMPS questionnaire. Notably, the effect size for the timed sit–stand measure increased at 10 months. However, these effect sizes were conservative estimates because they were based on “intent to treat” analyses that did not adjust for attendance. It is possible that “as treated” analyses would yield stronger results.
TABLE 4.
Treatment Effect Sizes at 5 and 10 Months: NCOA-Designated Best-Practice Physical Activity Programs, 2004–2005
| 5 Mos, Effect Size | 10 Mos,Effect Size | |
| Intermediate outcomes | ||
| Lorig self-efficacy scale for exercise | 0.121 | 0.123 |
| Outcome expectations for exercise | 0.021 | 0.058 |
| McAuley self-efficacy scale for barriers adherence | 0.395 | 0.195 |
| McAuley self-efficacy scale for adherence over time | 0.592 | 0.267 |
| Main outcomes | ||
| CES-D | 0.090 | 0.210 |
| Body mass index | –0.033 | –0.037 |
| Performance measures | ||
| 6-minute walk | 0.166 | 0.161 |
| Timed sit–stand | 0.245 | 0.341 |
| Arm-curl test | 0.256 | 0.278 |
| Back-scratch test | –0.090 | 0.111 |
| CHAMPS | ||
| Caloric expenditure: all PA | 0.154 | 0.041 |
| Caloric expenditure: moderate PA | 0.093 | 0.039 |
| Frequency of physical activity: all PA | 0.314 | 0.211 |
| Frequency of physical activity: moderate PA | 0.245 | 0.136 |
Note. CES-D = Center for Epidemiological Studies Depression Scale; CHAMPS = Community Healthy Activities Model Program for Seniors; PA = physical activity.
DISCUSSION
To the best of our knowledge, only 1 other study besides ours has tested the impact of best-practice physical activity programs offered in community settings on older adult participants, and ours is the only one we know of that has tested the impact of already-existing programs, as opposed to brand-new programs. Our findings have important implications for providers, participants, and policymakers.
All of the providers in our study had large numbers of participants enrolled in exercise programs prior to this study. However, recruiting and enrolling a new cohort of sedentary older adults for the study was a challenge. Although we originally planned to enroll participants over a period of 3 months, we were obliged to extend the enrollment period to 6 months because of low enrollment. The extended recruitment period and a small infusion of additional resources ($20 000 per site) enabled the providers to expand their reach and enroll substantial numbers of new participants. Importantly, the providers also found ways to maintain the increased reach of these new program offerings after the study ended.
All 3 sites experienced variable attendance at the activity programs examined in our study. Site staff described these variations as “normal,” reflecting the fact that older adults have many competing uses for their time. Despite variable attendance, we saw important effects on both intermediate and main study outcomes in these intent-to-treat analyses. In the future, we will conduct further analyses that will probe reasons for nonattendance (e.g., illness, caregiving responsibilities, transportation barriers) and will examine the level of attendance necessary to achieve the benefits we observed. Future “as treated” analyses will also examine the types and levels of physical activity engaged in by control group participants, who also showed some benefits over time. These analyses may shed light on the benefit achieved through participation in other forms of exercise and may enable us to quantify the value associated with multiple-component physical activity as compared with a single-component form of activity.
Retaining participants in measurement was challenging. We had originally planned to enroll 750 participants at baseline across the 3 sites, but despite aggressive recruitment that garnered more than 900 inquiries about the study, we were only able to successfully enroll 544 participants at baseline. However, the study was conservatively powered for a sample of 300 participants remaining at 10 months (50 treatment and 50 control participants at each of the 3 sites). In fact, 374 participants completed the 5-month posttest interview, and 384 participants completed the 10-month posttest interview. We also maximized statistical power by using random effects to model the outcome analyses. Control group members were more likely to refuse to participate in posttest measurement than were treatment group members. However, analyses using covariates that were correlated with attrition did not change the study findings.
Although we did not find significant differences in outcomes by site, there were site main effects. Site differences in overall performance levels regardless of study group may reflect compositional differences in site populations, such as age distribution. However, there were no significant differences in demographic characteristics, staff credentials, quality of programming, or supplements to programming that would contribute to site differences. We have not explored site differences because the major test of interest is the site–treatment interaction. The treatment should be effective in multiple sites regardless of the nature of the site's clientele, and these results support that hypothesis.
Overall, our findings demonstrate that substantial demand exists for multiple-component exercise programs. In addition, we learned that it was possible to maintain this level of programming—double that which was offered previously—after funding ended. The findings also provide strong evidence that community providers can provide multiple-component physical activity programs that can provide measurable benefits to participants. Our between-group analyses found that treatment participants improved significantly in exercise efficacy, adherence efficacy over time, and adherence efficacy in the face of barriers, as compared with our control group. Participants' involvement in physical activity also increased by 26% percent over baseline, and treatment participants experienced significant improvements in both upper- and lower-extremity strength at both time points. This is an important finding because impairment in lower-extremity performance has been shown to predict future disability and institutionalization.19–21 Thus, our finding that relatively low-cost programs (compared with the cost of medical care or institutionalization) can improve this outcome is very good news.
US public policy should encourage programs of the type examined in this study. Multiple-component physical activity programs should be supported by local community partners and by national agencies like the Administration on Aging and the Centers for Medicare and Medicaid Services. Our results suggest that the expenditures needed to implement these programs are justified because this kind of program can improve health and well-being among older adults, thus averting future expenditures that will be much larger than the cost of the programs. The results also demonstrate that technical assistance with outreach and marketing can help these programs reach new participants who are currently not enjoying the benefits of regular physical activity.
Acknowledgments
The National Impact Study was funded by the Robert Wood Johnson Foundation (grant 044931).
We thank the many participants who took part in the National Impact Study. We also gratefully acknowledge the significant contributions of the following organizations and individuals: the Centers for Disease Control and Prevention's Healthy Aging Research Network (University of Washington; University of California, Berkeley; University of Colorado; University of North Carolina at Chapel Hill; University of Pittsburgh; and University of South Carolina); Wendy Friar and Holy Cross Hospital; Jean O'Leary, Rita Kelliher, and Madison School and Community Recreation; Miranda Strider-Allen, Carol Bessette-Battle, and Resources for Seniors, Inc; Bonita Beattie; Serena Sanker; Binod Suwal and the National Council on Aging; and Karumah Cosey and staff at the Survey Research Laboratory of the University of Illinois at Chicago.
Note. The findings and conclusions in this report are those of the authors and do not necessarily represent the views of the Robert Wood Johnson Foundation.
Human Participant Protection
This study was approved by the institutional review boards of the University of Illinois at Chicago and Holy Cross Hospital.
References
- 1.Physical Activity and Health: A Report of the Surgeon General. Atlanta, GA: Centers for Disease Control and Prevention; 1996 [Google Scholar]
- 2.Surgeon General's report on physical activity and health. JAMA 1996;276:522. [PubMed] [Google Scholar]
- 3.King AC, Rejeski WJ, Buchner DM. Physical activity interventions targeting older adults: a critical review and recommendations. Am J Prev Med 1998;15:316–333 [DOI] [PubMed] [Google Scholar]
- 4.van der Biij AK, Laurant MGH, Wensing M. Effectiveness of physical activity interventions for older adults: a review. Am J Prev Med 2002;22:120–133 [DOI] [PubMed] [Google Scholar]
- 5.Wilcox S, Dowda M, Griffin SF, et al. Results of the first year of Active for Life: translation of 2 evidence-based physical activity programs for older adults into community settings. Am J Public Health 2006;96:1201–1209 [DOI] [PMC free article] [PubMed] [Google Scholar]
- 6.Lorig KR, Chastain RL, Ung E, Shoor S, Holman HR. Development and evaluation of a scale to measure perceived self-efficacy in people with arthritis. Arthritis Rheum 1989;32:37–44 [DOI] [PubMed] [Google Scholar]
- 7.Seymour RB. Scale development for self-efficacy for exercise among older adults. Diss Abstr Int B 2006;66:6560 [Google Scholar]
- 8.McAuley E, Lox C, Duncan TE. Long-term maintenance of exercise, self-efficacy, and physiological change in older adults. J Gerontol B Psychol Sci Soc Sci 1993;48:218–224 [DOI] [PubMed] [Google Scholar]
- 9.Stewart AL, Mills KM, King AC, Haskell WL, Gillis D, Ritter PL. CHAMPS physical activity questionnaire for older adults: outcomes for interventions. Med Sci Sports Exerc 2001;33:1126–1141 [DOI] [PubMed] [Google Scholar]
- 10.Rikli RE, Jones CJ. Senior Fitness Test Manual. Champaign, IL: Human Kinetics; 2001 [Google Scholar]
- 11.Kohout FJ, Berkman LF, Evans DA, Cornoni-Huntley J. Two shorter forms of the CES-D (Center for Epidemiological Studies Depression) depression symptoms index. J Aging Health 1993;5:179–193 [DOI] [PubMed] [Google Scholar]
- 12.Irwin M, Artin KH, Oxman MN. Screening for depression in the older adult: criterion validity of the 10-item Center for Epidemiological Studies Depression Scale (CES-D). Arch Int Med 1999;159:1701–1704 [DOI] [PubMed] [Google Scholar]
- 13.Ware JE, Jr, Sherbourne CD. The MOS 36-item short form health survey (SF-36). I. Conceptual framework and item selection. Med Care 1992;30:473–483 [PubMed] [Google Scholar]
- 14.Messier SP, Royer TD, Craven TE, O'Toole ML, Burns R, Ettinger WH. Long-term exercise and its effect on balance in older, osteoarthritic adults: results from the Fitness, Arthritis, and Seniors Trial (FAST). J Am Geriatr Soc 2000;48:131–138 [DOI] [PubMed] [Google Scholar]
- 15.Toraman NF, Erman A, Agyar E. Effects of multicomponent training on functional fitness in older adults. J Aging Phys Activity 2004;12:538–553 [DOI] [PubMed] [Google Scholar]
- 16.Cress ME, Buchner DM, Prohaska T, et al. Best practices for physical activity programs and behavior counseling in older adult populations. J Aging Phys Act 2005;13:61–74 [DOI] [PubMed] [Google Scholar]
- 17.Hedeker D, Gibbons RD. Longitudinal Data Analysis. New York, NY: Wiley-VCH; 2006 [Google Scholar]
- 18.Cohen J. Statistical Power Analysis for the Behavioral Sciences. New York, NY: Academic Press; 1977 [Google Scholar]
- 19.Jette AM, Branch LG, Berlin J. Musculoskeletal impairments and physical disablement among the aged. J Gerontol B Psychol Sci Soc Sci 1990;45:M203–208 [DOI] [PubMed] [Google Scholar]
- 20.Guralnik JM, Ferrucci L, Simonsick EM, Salive ME, Wallace RB. Lower-extremity function in persons over the age of 70 years as a predictor of subsequent disability. N Engl J Med 1995;332:556–561 [DOI] [PMC free article] [PubMed] [Google Scholar]
- 21.Dunlop D, Hughes SL, Edelman P, Singer R, Chang R. Impact of joint impairment on disability and disability-specific domains at four years. J Clin Epidemiol 1998;51:1253–1261 [DOI] [PubMed] [Google Scholar]