Abstract
Continuous cultures of Pseudomonas aeruginosa (ATCC 9027) maintained at different dissolved oxygen concentrations (DO) were studied for the effects of DO on various culture properties, especially aerobic respiration and denitrification. The DO was varied from 0 mg/liter (completely anoxic conditions) to 1.3 mg/liter and measured with optical sensors that could accurately determine very low DO based on oxygen-quenched luminescence. The strain was found to perform aerobic denitrification; while the specific rate decreased with increasing DO, denitrification persisted at approximately 1/8 of the maximum rate (1.7 mmol/g of cells/h) even at relatively high DO (1 to 1.3 mg/liter). In the presence of nitrate, the culture's Monod half-rate saturation constant for O2 was very small, <0.1 mg/liter. Aerobic denitrification appeared to function as an electron-accepting mechanism supplementary to or competitive with aerobic respiration. The shift of the culture's respiratory mechanism was also clearly detected with a fluorometer targeting intracellular NAD(P)H, i.e., the reduced forms of the NAD(P) coenzymes. Comparatively, the NAD(P)H fluorescence under the anoxic, denitrifying conditions (NFUDN) was highest, that under fully aerobic conditions (NFUOX) was lowest, and that under conditions in which both denitrification and aerobic respiration occurred (NFU) was intermediate. Representing a quantitative measure of the culture's “fractional approach” to the fully denitrifying state, the normalized fraction (NFU − NFUOX)/(NFUDN − NFUOX) was correlated with DO and the calculated fraction of electrons accepted by denitrification. The NFU fraction decreased with increasing DO, following an empirical exponential relationship. The fraction of denitrification-accepted electrons increased with the NFU fraction: the increase was gradual and approximately linear at DO of ≥0.1 mg/liter but much sharper at lower DO. Online NAD(P)H fluorescence was demonstrated as a feasible technique for effective monitoring and quantitative description of the microaerobic state of microorganisms.
Oxygen is only sparingly soluble in water. Consequently, the uneven distributions of water flow, nutrients, and microbial populations create a continuous and dynamic spectrum of aerobic, microaerobic, and anaerobic or anoxic conditions in the often heterogeneous, complex environments. The ecological fate of different organic compounds varies differently with changing dissolved oxygen concentrations (DO) (17). For example, oxygenated compounds are largely biodegradable in all conditions (at different rates) (13), while highly chlorinated hydrocarbons are more susceptible to sequential degradation, a reductive dechlorination under anoxic conditions (e.g., by sulfate-reducing bacteria or methanogens) followed by aerobic mineralization (25). Knowing how microbial metabolisms for different organic materials change with varying DO is essential for the modeling of their ecological fate for risk assessment and management as well as for the development of advanced bioremediation technology.
Microaerobic conditions are, however, ill defined. From the simple point of view of microbial respiration, aerobic conditions correspond to those in which the organism(s) uses O2 as the terminal electron acceptor (aerobic respiration); anaerobic or anoxic conditions correspond to those in which the organism(s) performs fermentation (without external terminal electron acceptors) or uses chemicals other than O2 as terminal electron acceptors (anaerobic respiration) (17). Accordingly, microaerobic conditions may be defined as the transition conditions in which the organism(s) performs simultaneous aerobic and anaerobic respiration or fermentation.
The lack of accurate and stable devices for measuring low DO has been a major obstacle to the fundamental studies on microaerobic metabolism using chemostatic, continuous cultures. Relying on electrochemical reactions, methods using the conventional galvanic or polarographic electrodes involve signal drifting that is intolerable at low DO. Frequent calibration is impractical because the electrode is typically used in direct contact with the culture broth and, thus, needs to be kept sterile. In this study, a special sensor was used to circumvent these problems. Capable of accurate measurement at 0.001 mg/liter, the sensor measures DO on the basis of oxygen-quenched luminescence, which is caused by collision between oxygen and the luminescent dye molecules in the excited state (22). (More details about the sensor are given later in “Analytical methods.”)
In addition, an online fluorometer measuring the fluorescence of intracellular NAD(P)H (i.e., that of NADH plus that of NADPH), the reduced forms of the NAD(P) coenzymes, was used to monitor the shift of microbial electron-accepting mechanisms. Universally present in living cells, the coenzymes NAD(P) are the major intermediate electron and hydrogen carriers, coupling substrate catabolism and respiration and anabolism (10, 24). While NAD(P)H are fluorescent (excitation maximum of ∼340 nm and fluorescence maximum of ∼460 nm), their oxidized counterparts, NAD(P)+, are not. The intensity of NAD(P)H fluorescence thus depends on the kinetic balance of their generation (by catabolism) and consumption (by respiration and anabolism) and is extremely sensitive to the change in cellular electron-accepting mechanisms (11, 24, 26).
Together, the two luminescence-based techniques may facilitate the study of microaerobic metabolism by providing definitive and sensitive measurement of the microaerobic conditions. Being ubiquitous and having versatile metabolic capability, Pseudomonas aeruginosa was studied in this work. P. aeruginosa is among the organisms most commonly isolated from petroleum-contaminated soils and groundwater (18). It is well known to mineralize aliphatic hydrocarbons, and strains degrading aromatic and polyaromatic hydrocarbons have also been isolated (1, 3). Many strains of the bacterium produce effective biosurfactants (rhamnolipids) when growing on hydrophobic substrates (23). The biosurfactants are very beneficial to bioremediation by solubilizing and mobilizing hydrocarbons and other non-aqueous phase liquid contaminants into the aqueous phase for biodegradation or removal by adjective transport (4). P. aeruginosa strains are typically active denitrifiers (5, 7, 10, 16). Among all anaerobic respiration mechanisms, denitrification is favorable energetically and gives out benign nitrogen (N2) as the predominant product (2, 7). In this study, continuous cultures of P. aeruginosa maintained at different DO were examined for the effects of DO on cell metabolism and respiratory mechanisms. The changing ratio of the number of electrons accepted by denitrification to the number of those accepted by aerobic respiration was assessed and correlated with NAD(P)H fluorescence. Compared to DO, the NAD(P)H fluorescence was shown to be a much more sensitive and useful indicator for the microbial activity under the microaerobic conditions.
MATERIALS AND METHODS
Organism and media.
P. aeruginosa ATCC 9027 was used in this study. The stock culture was maintained at 4°C after lyophilization in 10% skim milk. For activation, the culture was incubated at 30°C in a 3% tryptic soy broth medium for 24 h. The activated culture was transferred to 100 ml of a preculture medium with the following composition: glucose, 20 g/liter; NH4Cl, 3 g/liter; K2HPO4, 0.7 g/liter; MgSO4 · 7H2O, 1 g/liter; and FeSO4, 0.45 mg/liter. After growing at room temperature (22 ± 2°C) in a magnetically stirred (500-ml) Erlenmeyer flask for 24 h, the culture was used as the inocula for the continuous culture systems. The fresh medium for continuous culture had the following composition: glucose, 10 g/liter; NaNO3, 10 g/liter; NH4Cl, 6 g/liter; KH2PO4, 0.7 g/liter; NaCl, 0.5 g/liter; MgSO4 · 7H2O, 0.18 g/liter; CaCl2, 0.01 g/liter; MnCl2 · 4H2O, 0.01 g/liter; FeSO4, 0.01 g/liter; and antifoam (non-silicone-based Trans-280; Trans-Chemco, Inc., Bristol, Wis.), 0.5 g/liter. Glucose was the limiting nutrient in the medium. A relatively high concentration of NH4Cl was included so that NaNO3 was consumed only for denitrification, not as an N source for assimilation (14). The antifoam was found to be necessary because of the extreme foaming associated with the rhamnolipids produced by P. aeruginosa. Preliminary study had been carried out with batch fermentation in shake flasks containing the antifoam at concentrations of 0 (control), 0.01, 0.05, 0.1, 0.2, and 0.5 g/liter. The cell growth profiles and the maximum cell concentrations reached were practically the same for all the systems. The antifoam was confirmed to have no detectable effects on cell metabolism at the concentration employed.
Continuous culture.
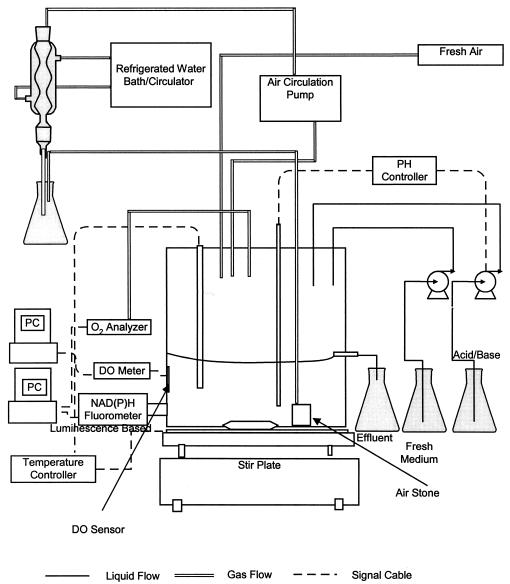
The experimental setup is shown in Fig. 1. The continuous culture was conducted in a 2-liter glass fermentor containing 0.7 liters of medium. The fermentation pH was maintained at 6.5 ± 0.1 by automatic addition of either NaOH or a mixed solution of HNO3 and NaNO3. The pH control was achieved by using a set consisting of a pH probe and a controller (Ingold Mettler Toledo, La Grange, Ill.). Temperature was maintained at 35.0 ± 0.2°C. As described later in more detail, the oxygen uptake rate (OUR) of the culture was determined from the material balance based on the measurements of oxygen concentrations in the influent and effluent airstreams. The OUR results would be less accurate if the airflow rate was high and the determination depended on very small differences between two large concentrations. The flow rate of influent airstream to the headspace of the fermentor was therefore kept low at a constant 60 ml/min. To maintain the continuous culture at different DO, an adjustable air pump was used to circulate the air from the fermentor headspace through (in the given order) a cooling condenser, the circulation pump, a sterile 0.22-μm-pore-size filter, and an air stone placed at the bottom of the fermentor, through which the air was introduced back into the broth as fine bubbles. The filter was used to ensure sterility, and the condenser was used to reduce moisture so that the filter would not be wet and clogged by the water condensed otherwise in the circulation line.
FIG. 1.
Experimental setup for continuous culture study. PC, personal computer.
The dilution rate used in this study was kept the same at 0.026 h−1. After each new air circulation rate was set (as described above), the culture was maintained for at least 5 days (corresponding to the amount of time in which the broth volume was replaced three times) and then the cell concentration was monitored daily for at least three more days to ensure the attainment of a constant steady-state cell concentration. Three 10-ml samples were then taken for triplicate analyses of cell, glucose, nitrate, nitrite, ammonium, and rhamnolipid concentrations. The samples were centrifuged at 14,500 × g for 10 min to separate cells from the supernatants. Cell and nitrite concentrations were analyzed immediately. The remaining supernatants were frozen at −18°C for other, later analyses.
Analytical methods. (i) Glucose and cell concentrations.
The glucose concentrations were determined using the enzymatic glucose assay kit from Sigma Diagnostics (procedure no. 510) and measured with a UV-visible spectrophotometer at 450 nm. For cell concentrations, the optical densities of broth samples, after a known fold dilution to the right linear range (0.1 to 0.6), were measured at 460 nm and converted to cell dry-weight concentrations according to a preestablished calibration curve. The cell dry-weight concentrations were determined by washing the cell pellets (collected by centrifugation) once with deionized water and then drying the washed cells to constant weight in an aluminum weighing dish at 110°C for at least 3 h.
(ii) Ammonium, nitrate, and nitrite.
Analyses of ammonium-N and NOx−-N (including both nitrate-N and nitrite-N) were made using an ammonia electrode (M-44325; Markson Science) (6, 24). The ammonium concentrations could be measured accurately in a wide range (1 to 1,000 mg/liter of NH4+-N), while the NOx− concentrations could be measured accurately only in the range of 1 to 20 mg/liter of NOx−-N. The sample was therefore diluted to the proper range prior to the analysis. The nitrite concentration was measured separately as described below. The difference between the NOx−-N and nitrite-N concentrations was taken as the nitrate-N concentration.
For nitrite analysis (6), 0.1 ml of the sulfanilamide reagent (1%; LabChem Inc.) was added to a 5-ml sample in a test tube, mixed, and kept in the dark for 2 to 8 min. One-tenth (0.1) of a milliliter of the N-1-(naphthyl)-ethylenediamine dihydrochloride reagent (0.1%; LabChem Inc.) was then added, mixed, and left standing for at least 10 min. The absorbance at 543 nm was measured by the spectrophotometer.
(iii) Rhamnolipids.
The supernatant of sample collected by centrifugation was adjusted to pH 2.0 with 1 N HCl and extracted with ethyl acetate of double volume at room temperature. The organic phase was dried at 40°C, and the residue was hydrolyzed in 5 ml of 2 N HCl for 6 h. The acid hydrolyzed rhamnolipids into rhamnose and lipids (i.e., hydroxylalkanoic acids). Ethyl acetate (5 ml) was added to extract the lipids from the aqueous phase, which was then analyzed for the rhamnose concentration by the standard anthrone method (5).
(iv) DO and OUR measurement.
DO was measured by optical microsensors PSt3 and MEF14 (PreSens Precision Sensing GmbH, Regensburg, Germany) according to the quenching of luminescence caused by collision between oxygen and luminescent dye molecules in the excited state (product information, Zero Corp., North Salt Lake, Utah). The oxygen-sensitive dye was immobilized in silicone matrix (125 μm thick) and attached onto a flexible transparent polyester foil. A small piece (5 by 5 mm) of the autoclavable sensing matrix was glued inside the glass wall of the fermentor with silicone glue. The oxygen concentration of the broth in contact with the sensing matrix was then monitored from outside through the fermentor wall by using an optical fiber, and the data were logged and analyzed with computer software. PSt3 had a larger measurement range (0 to 45 mg/liter; i.e., 0 to 500% air saturation) but lower accuracy (0.01 mg/liter). MEF14 had a smaller range (0 to 1.8 mg/liter; i.e., 0 to 20% air saturation) but higher accuracy (0.001 mg/liter). In this study, PSt3 was used at DO above 0.6 mg/liter for its more stable signals while MEF14 was used for more accurate measurements at lower DO.
OUR was calculated from the material balance on oxygen by using the measured oxygen concentrations and gas flow rates of the influent and effluent gas streams (see “Calculations” below). The gas phase oxygen concentrations were measured with an FC-1B oxygen analyzer (Sable Systems, Henderson, Nev.) having an accuracy of 0.0001%. The gas flow rates were measured with a valved acrylic flow meter (Cole-Parmer, Vernon Hills, Ill.) that was controlled by a gas flow controller (mass flow meter and controller electronics; Sable Systems) having an accuracy of 0.2%.
(v) Culture fluorescence measurement.
Culture fluorescence was monitored by an online fluorometer (BioGuide System; BioChem Technology, Inc., King of Prussia, Pa.). The fluorometer was designed for monitoring the fluorescence of intracellular NAD(P)H, with excitation wavelengths of 340 ± 20 nm and emission wavelengths of 400 to 480 nm. After the culture reached the steady state under a specific DO, the fluorescence intensity (represented hereafter by NFU [i.e., normalized fluorescence unit]) was recorded. Both the influent air valve and the circulation air pump were then turned off. Cell respiration quickly depleted the DO in the medium and led to fully anoxic denitrifying conditions, causing a sharp increase in fluorescence to a level observed under the denitrifying conditions (NFUDN). Next, a high airflow rate was introduced to create fully aerobic conditions, and the corresponding fluorescence (NFUOX) was also recorded.
Calculations.
As described above, the following properties were measured or determined experimentally: dilution rate (D) per hour, nitrate-N concentration in the fresh feed ( , in milligrams per liter), nitrate-N and nitrite-N concentrations in the effluent broth (CNA and CNI, respectively, in milligrams per liter), nitrate-N concentration in the acid added for pH control (
 , in milligrams per liter), average rate of the acid addition (QA, in liters per hour), and broth volume (V, in liters). Accordingly, nitrate and nitrite reduction rates (NAR and NIR, respectively, in millimoles per liter per hour) of the continuous culture could be calculated from the material balances as follows:
 |
 |
where 14 is the atomic weight of N.
OUR, in millimoles of O2 per liter per hour, was determined from the oxygen balance:
 |
where G is the gas flow rate (in liters per hour) and Cin and Cout are the gas phase oxygen concentrations (in millimoles per liter) in the influent and effluent gas streams.
Cell yield from glucose (Yx/s) was calculated as follows:
 |
where X (in grams per liter) is the steady-state cell concentration and S0 and S (in grams per liter) are the glucose concentrations in the fresh feed and the broth, respectively.
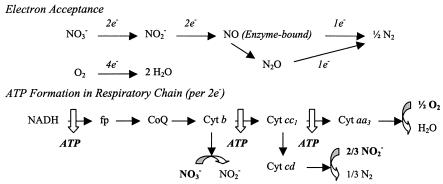
For bioenergetics of P. aeruginosa, the known pathways for electron acceptance and ATP generation (from respiratory chain) are shown in Fig. 2 (21). Accordingly, the ATP formation rate in the respiratory chain (FRATP, in millimoles per liter per hour) and the fraction of electrons accepted by anaerobic respiration could be calculated using the NAR (to nitrite), NIR, and OUR determined above:
 |
 |
 |
The specific rates, per unit of cell concentration, of the above volumetric rates (per unit of culture volume) were calculated by dividing the volumetric rates by the corresponding cell concentration (X).
FIG. 2.
Electron acceptance and ATP formation in respiratory chain of P. aeruginosa. fp, flavoprotein; CoQ, coenzyme Q (ubiquinone); Cyt, cytochrome.
RESULTS AND DISCUSSION
Cell properties in continuous cultures maintained at different DO.
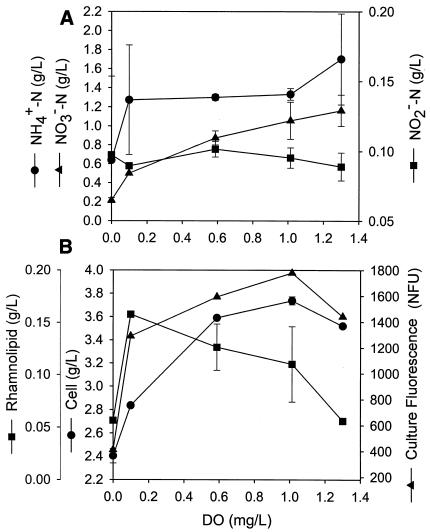
The steady-state culture properties measured in continuous cultures maintained at different DO are summarized in Fig. 3. The dilution rate employed (0.026 h−1) was very low compared to the culture's maximum specific growth rate (μmax = 0.23 h−1), estimated from the exponential growth observed in the batch fermentation (data not shown). At such a low dilution rate, the concentrations of the limiting nutrient, glucose, were practically zero in the broth and were not reported in the figure.
FIG. 3.
Steady-state cell concentrations measured in continuous cultures maintained at different DO.
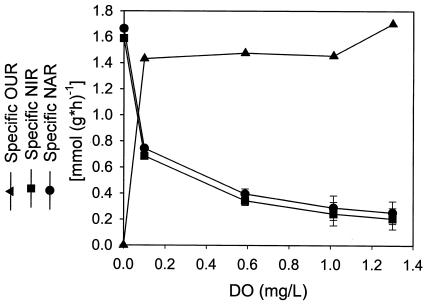
As shown in Fig. 3A, ammonium was present in excess (0.6 to 1.6 g/liter of NH4+-N) to ensure that nitrate was consumed for respiration, because the assimilatory nitrate reductases are repressed by ammonium (14). With increasing DO, the nitrate concentration increased from 0.2 to 1.2 g/liter of NO3−-N, indicating a decrease in the NAR. The trend of decreasing specific NARs is shown in Fig. 4. The decrease with increasing DO is consistent with the well-known repression and inhibition effects of oxygen on nitrate reductases (9). Denitrification, however, persisted (at a specific NAR of 0.2 to 0.3 mmol/g/h) even at relatively high DO (1 to 1.3 mg/liter). Although rare, similar phenomena, termed aerobic denitrification, have been observed in several microbial species and strains (12, 16), including P. aeruginosa (12, 27). The occurrence of aerobic denitrification in the present study was also supported by the observations associated with pH changes: the culture pH was observed to decrease under fully aerobic conditions but increase under fully anoxic denitrifying conditions because of the removal of nitric acid. The acid addition rates required for pH control in the continuous cultures were found to decrease with decreasing DO. For the system maintained at a DO of 0.6 mg/liter, no addition of either base or acid was necessary, indicating that both aerobic respiration and denitrification took place and the two mechanisms reached a balance in their effects on culture pH.
FIG. 4.
Specific OURs, NARs, and NIRs determined for continuous cultures maintained at different DO.
Nitrite concentrations remained relatively constant (0.09 to 0.10 g/liter of NO2−-N) in continuous cultures at different DO (Fig. 3A). The specific NIRs calculated are also shown in Fig. 4. They are only slightly smaller than those for nitrate reduction. Thus, the nitrite formed from nitrate reduction was immediately converted through the subsequent pathway in denitrification (to NO, N2O, and N2), leaving only a relatively constant residual concentration.
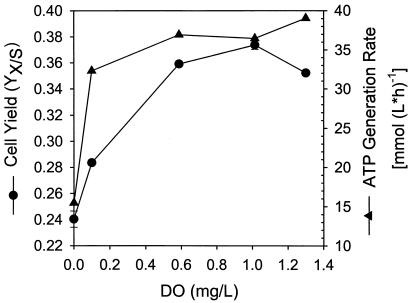
As shown in Fig. 3B, the steady-state cell concentration increased significantly (from 2.4 to 3.6 g/liter) as DO increased from 0 mg/liter (fully denitrifying conditions) to ∼0.6 mg/liter, and then the steady-state cell concentration remained relatively constant at higher DO. The calculated cell yield (from consumed glucose) reflected a similar trend (Fig. 5) and can be attributed to the higher energy (ATP) yield of aerobic respiration than of denitrification. (More discussion is given later.) The culture fluorescence measured by the NAD(P)H fluorometer also exhibited a similar profile. The rhamnolipid concentration, on the other hand, nearly tripled when the culture was shifted from the anoxic conditions (without any aeration) to conditions of a very low DO (0.1 mg/liter) under minimal aeration. However, with a further increase in DO, the biosurfactant concentration decreased. The concentration at the highest DO studied (1.3 mg/liter) was approximately the same as that under fully denitrifying conditions. The positive effect of extremely low DO on rhamnolipid synthesis has never been reported before, and the responsible mechanism(s) remains to be further investigated. The observation is significant not only for enhancing the productivity of rhamnolipids in industrial production but also for addressing the role of rhamnolipid-associated pathogenicity of P. aeruginosa, which resides in anoxic to microaerobic biofilms in airway mucus of cystic fibrosis patients (8).
FIG. 5.
Cell yields and ATP generation rates determined for continuous cultures maintained at different DO.
Respiration mechanism and energy generation at different DO.
The calculated values of specific OURs observed in continuous cultures maintained at different DO are shown in Fig. 4, together with the specific rates of reduction of nitrate and nitrite. The specific OUR approached the maximal level (∼1.4 mmol of O2/g [dry weight] of cells/h) even at the lowest DO (0.1 mg/liter) studied under nonanaerobic conditions. For this P. aeruginosa strain, the Monod half-rate saturation constant for DO (i.e., the critical DO at which the specific OUR is half of the maximum rate) is apparently lower than 0.1 mg/liter. As mentioned earlier, the consumption rates of nitrate and nitrite decreased with increasing DO but remained at a significant residual rate (∼1/8 of the maximal rates) even at high DO (>1.0 mg/liter). Denitrification was therefore not completely repressed or inhibited by oxygen and could function as an electron-accepting and energy-generating mechanism competitive with or supplementary to aerobic respiration.
The profiles of cell yield and ATP generation rate are shown in Fig. 5. The two profiles are relatively parallel, with both cell yield and ATP generation rate increasing with increasing DO. The main deviation in trends occurred at a DO of 0.1 mg/liter, at which the cell yield appeared to be lower than the level expected from the corresponding ATP generation rate. The additional energy (and material resources) might have been diverted to the synthesis of other metabolites. For example, a significantly higher rhamnolipid concentration was obtained under this condition (Fig. 3). More investigations on the low DO metabolism are warranted.
Culture fluorescence.
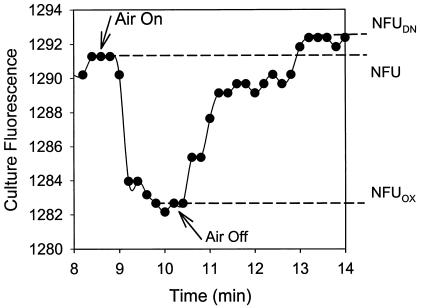
The total intracellular NAD(P)H concentration in a culture depends on both the cell concentration and the specific NAD(P)H concentration (per unit of cell concentration). The latter depends on the fraction of the reduced coenzymes [NAD(P)H] in the overall coenzyme pool [NAD(P)H plus NAD(P)+] (19). NAD(P)H fluorescence signals can therefore be used for monitoring the changing cell concentration (26) and/or cellular activity, especially the electron-accepting mechanism which significantly affects the rate of NAD(P)H oxidation (consumption) (20). As shown in Fig. 6 (for the continuous culture at a DO of 0.1 mg/liter), the steady-state fluorescence (NFU) dropped sharply and instantaneously (to NFUOX) when the aeration rate was increased to make the system fully aerobic. Several minutes later, the aeration was completely shut down. The microbial respiration depleted DO, and the fluorescence increased (eventually to NFUDN) as the culture entered the fully denitrifying condition.
FIG. 6.
An example profile of the response of NAD(P)H fluorescence to brief perturbation from the continuous culture's steady state to aerobic and anoxic conditions. (The continuous culture with results shown here was maintained at a DO of 0.1 mg/liter.)
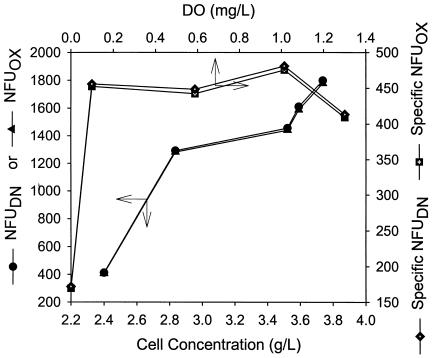
Although clearly identifiable, the fluorescence changes associated with the shift of electron-accepting mechanisms represented very small fractions (<1%) of the total fluorescence intensities. This observation is demonstrated in Fig. 7, where the total and specific culture fluorescence intensities (observed in several continuous cultures maintained at different DO) were plotted against the corresponding steady-state cell concentrations or DO. While there appeared to be a general trend of increasing fluorescence with increasing cell concentration, the specific fluorescence (per unit of cell concentration) was relatively constant only under nonanaerobic conditions (∼410 to 485 NFU/liter/g for DO of ≥0.1 mg/liter) and was significantly lower under the anaerobic conditions (∼170 NFU/liter/g) (Fig. 7). The phenomena clearly reflected the composite and complex nature of the fluorescence signals, partly intrinsic to optical instruments, partly reflecting the optical “dirtiness” and variability of biological broth, and partly caused by the relatively broad excitation and emission bandwidths employed by the fluorometer (15). The observations indicated that the total culture fluorescence measured originated primarily from some interfering fluorophores other than NAD(P)H, and the interferences were much stronger under aerobic conditions than under anaerobic conditions.
FIG. 7.
Total and specific culture fluorescence intensities observed at fully denitrifying (anoxic) and aerobic conditions, plotted against the corresponding cell concentrations or DO to show the effects of background fluorescence from fluorophores other than NAD(P)H.
Examination of the transition of electron-accepting mechanisms by using NAD(P)H fluorescence.
The above-described complexity did not compromise the use of culture fluorescence in this study for detecting the shift of electron-accepting mechanisms. As shown in Fig. 6, the NAD(P)H fluorescence exhibited step changes upon the shift of microbial electron-accepting mechanisms. The fluorescence level was higher under the anaerobic-denitrifying conditions (NFUDN) than under fully aerobic conditions (NFUOX). If NADH was oxidized partly by nitrate and nitrite and partly by oxygen, the fluorescence should be between NFUDN and NFUOX, and the normalized fraction (NFU − NFUOX)/(NFUDN − NFUOX) represents a quantitative measure of the “fractional approach” of the culture to the completely denitrifying state.
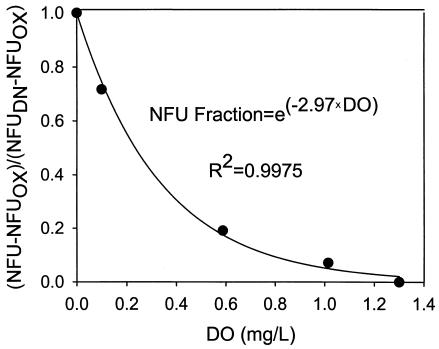
With the well-known repression and inhibition effects on denitrification, DO is expected to have a significantly negative effect on the above NFU fraction. As described earlier, simultaneous aerobic respiration and denitrification were observed to occur in the P. aeruginosa strain used in this study, even under relatively high DO. When plotted in Fig. 8 against DO, the fraction (NFU − NFUOX)/(NFUDN − NFUOX) is shown to decrease with DO following an exponential decay:
 |
Despite the good fit (R2 = 0.998), the equation is completely empirical. With future data for more systems and microbial species and strains, the equation may be modified for clearer biological meaning.
FIG. 8.
Decrease of the NFU fraction with increasing DO, empirically fit with an exponential relationship.
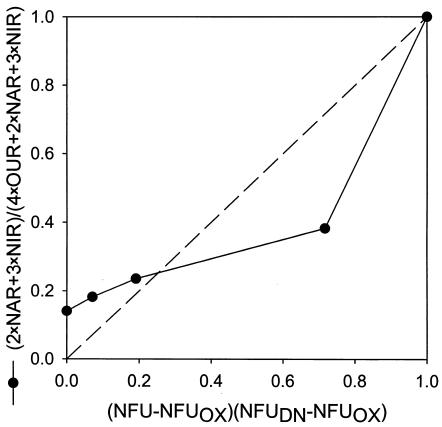
With the measurements made in this study, another quantitative indicator for the culture's extent of denitrification can be calculated, i.e., the fraction of electrons accepted by denitrification (out of the total electrons accepted by both aerobic respiration and denitrification) as described earlier in “Calculations”: (2 × NAR + 3 × NIR)/(4 × OUR + 2 × NAR + 3 × NIR). Both the NFU fraction and the electron acceptance fraction have values between 0 and 1, with 0 corresponding to fully aerobic metabolism and 1 to fully (anaerobic) denitrifying metabolism. The two fractions are plotted in Fig. 9 for potential correlation. The data do not fall on the “ideal” diagonal, which would correspond to a directly proportional relationship. Nonetheless, the fraction of electrons accepted by denitrification increased with an increase in the normalized NFU fraction. The approximately linear increase at DO of ≥0.1 mg/liter was gradual, followed by a much sharper increase at the lower DO range. Future study to gather data at different conditions and with various species and strains is warranted for establishing a clearer relationship between the two fractions. In turn, understanding of the relationship will significantly improve our ability to use the online NAD(P)H fluorescence to monitor and quantitatively describe the microaerobic state of the microorganisms.
FIG. 9.
Correlation between two different indicators of the culture's extent of denitrification: the fraction of electrons accepted by denitrification and the NFU fraction.
Conclusions.
With the glucose-limited continuous culture at a very low dilution rate (0.026 h−1), the strain of P. aeruginosa used in this study was shown to perform aerobic denitrification: while the specific rate decreased with increasing DO, denitrification persisted at approximately 1/8 of the maximum rate (1.7 mmol/g of cells/h) even at relatively high DO (1 to 1.3 mg/liter). In the presence of nitrate, the culture's Monod half-rate saturation constant for O2 was very small, <0.1 mg/liter. Aerobic denitrification appeared to function as a mechanism of electron acceptance that was supplementary to or competitive with aerobic respiration. The steady-state cell concentration increased significantly (from 2.4 to 3.6 g/liter) as DO increased from 0 mg/liter (fully denitrifying conditions) to ∼0.6 mg/liter, and then the steady-state cell concentration remained relatively constant at higher DO, reflecting the higher energy (ATP) yield of aerobic respiration than of denitrification. The rhamnolipid concentration, on the other hand, showed an increase-then-decrease profile that peaked at a very low DO (0.1 mg/liter) under minimal aeration. The observation is especially significant for the rhamnolipid-associated pathogenicity of P. aeruginosa, which resides in anoxic to microaerobic biofilms in airway mucus of cystic fibrosis patients (8). As expected, the culture fluorescence monitored by the NAD(P)H fluorometer responded clearly to the changes in culture condition from anoxic to aerobic conditions and to different low DO. Representing a quantitative measure of the fractional approach of the culture to the completely denitrifying state, the normalized fraction (NFU − NFUOX)/(NFUDN − NFUOX) decreased with increasing DO, following empirically an exponential decay relationship. The fraction of electrons accepted by denitrification, (2 × NAR + 3 × NIR)/(4 × OUR + 2 × NAR + 3 × NIR), increased gradually and approximately linearly with the above fluorescence fraction at DO of ≥0.1 mg/liter. The increase was much sharper at lower DO. With future study on different conditions and species and strains, a clearer relationship between the two fractions may be established to significantly improve the applicability of online NAD(P)H fluorescence to monitoring and quantitatively describing the microaerobic state of the microorganisms.
Acknowledgments
This material is based upon work supported by the National Science Foundation under grant no. 0104122.
REFERENCES
- 1.Arino, S., R. Marchal, and J. P. Vandecasteele. 1998. Involvement of a rhamnolipid-producing strain of Pseudomonas aeruginosa in the degradation of polycyclic aromatic hydrocarbons by a bacterial community. J. Appl. Microbiol. 84:769-776. [DOI] [PubMed] [Google Scholar]
- 2.Boulding, J. R. (ed.). 1996. EPA environmental engineering source book. Ann Arbor Press, Chelsea, Mich.
- 3.Campos de Alaniz, J. D., and A. A. Solari. 1973. Use of hydrocarbons as the only source of carbon in Pseudomonas aeruginosa. Bioquimica Clinica 7:37-45. [Google Scholar]
- 4.Chayabutra, C., and L.-K. Ju. 2000. Degradation of n-hexadecane and its metabolites by Pseudomonas aeruginosa under microaerobic and anaerobic denitrifying conditions. Appl. Environ. Microbiol. 66:493-498. [DOI] [PMC free article] [PubMed] [Google Scholar]
- 5.Chayabutra, C., J. Wu, and L.-K. Ju. 2001. Rhamnolipid production by Pseudomonas aeruginosa under denitrification: effects of limiting nutrients and carbon substrates. Biotechnol. Bioeng. 72:25-33. [DOI] [PubMed] [Google Scholar]
- 6.Clesceri, L. S., A. E. Greenberg, and R. R. Trussel. 1989. Standard methods for the examination of water and wastewater, 17th ed. American Public Health Association, Washington, D.C.
- 7.Fenchel, T., and B. J. Finlay. 1995. Ecology and evolution in anoxic worlds. Oxford University Press, Oxford, United Kingdom.
- 8.Hassett, D. J., J. Cuppoletti, B. Trapnell, S. V. Lymar, J. J. Rowe, S. S. Yoon, G. M. Hilliard, K. Parvatiyar, M. C. Kamani, D. J. Wozniak, S.-H. Hwang, T. R. McDermott, and U. A. Ochsner. 2002. Anaerobic metabolism and quorum sensing by Pseudomonas aeruginosa biofilms in chronically infected cystic fibrosis airways: rethinking antibiotic treatment strategies and drug targets. Adv. Drug Delivery Rev. 54:1425-1443. [DOI] [PubMed] [Google Scholar]
- 9.Hernandez, D., and J. J. Rowe. 1987. Oxygen regulation of nitrate uptake in denitrifying Pseudomonas aeruginosa. Appl. Environ. Microbiol. 53:745-750. [DOI] [PMC free article] [PubMed] [Google Scholar]
- 10.Ju, L.-K., and H. K. Trivedi. 1992. Monitoring of denitrification by Pseudomonas aeruginosa using online fluorescence technique. Biotechnol. Tech. 6:549-554. [Google Scholar]
- 11.Ju, L.-K., X. Yang, J. F. Lee, and W. B. Armiger. 1995. Monitoring of the biological nutrient removal process by an on-line NAD(P)H fluorometer. Biotechnol. Prog. 11:545-551. [Google Scholar]
- 12.Ka, J. O., J. Urbance, R. W. Ye, T. Y. Ahn, and J. M. Tiedje. 1997. Diversity of oxygen and N-oxide regulation of nitrite reductases in denitrifying bacteria. FEMS Microbiol. Lett. 156:55-60. [DOI] [PubMed] [Google Scholar]
- 13.Kincannon, D. F., E. L. Stover, V. Nichols, and D. Medley. 1983. Removal mechanisms for toxic priority pollutants. J. Water Pollut. Control Fed. 55:157-163. [Google Scholar]
- 14.Knowles, R. 1982. Denitrification. Microbiol. Rev. 46:43-70. [DOI] [PMC free article] [PubMed] [Google Scholar]
- 15.Li, J. K., and A. E. Humphery. 1992. Factors affecting culture fluorescence when monitoring bioreactors. J. Ferment. Bioeng. 74:104-111. [Google Scholar]
- 16.Louise, C. B., and J. F. Stuart. 1991. Nitric and nitrous oxide reductases are active under aerobic condition in cells of Thiophaera pantotropha. Biochem. J. 273:423-427. [DOI] [PMC free article] [PubMed] [Google Scholar]
- 17.Madigan, M. T., J. M. Martinko, and J. Parker. 1997. Brock biology of microorganisms. Prentice-Hall, Upper Saddle River, N.J.
- 18.Ridgway, H. F., J. Safarik, D. Phipps, P. Carl, and D. Clark. 1990. Identification and catabolic activity of well-derived gasoline-degrading bacteria from a contaminated aquifer. Appl. Environ. Microbiol. 56:3565-3575. [DOI] [PMC free article] [PubMed] [Google Scholar]
- 19.Scheper, T., A. Gebauer, and K. Schugerl. 1987. Monitoring of NADH-dependent culture fluorescence during the cultivation of Escherichia coli. Chem. Eng. J. 34:B7-B12. [Google Scholar]
- 20.Scott, D. A., L. W. Grotyohann, J. Y. Cheung, and R. C. J. Scaduto. 1994. Ratiometric methodology for NAD(P)H measurement in the perfused rat heart using surface fluorescence. Am. J. Physiol. 267:H636-H644. [DOI] [PubMed] [Google Scholar]
- 21.Stouthamer, A. H., J. Van't Riet, and L. F. Oltmann. 1980. Respiration with nitrate as acceptor, p. 19-48. In C. J. Knowles (ed.), Diversity of bacterial respiratory systems, vol. 2. CRC Press, Boca Raton, Fla.
- 22.Surgi, M. R. 1989. Design and evaluation of a reversible fiber optic sensor for determination of oxygen, p. 249-290. In D. L. Wise (ed.), Applied biosensors. Butterworth Publishers, Stoneham, Mass. [PubMed]
- 23.Tiedje, J. M. 1988. Ecology of denitrification and dissimilatory nitrate reduction to ammonium, p. 179-243. In A. J. B. Zehnder (ed.), Biology of anaerobic microorganisms. Wiley, New York, N.Y.
- 24.Trivedi, H. K., and L.-K. Ju. 1994. Study of nitrate metabolism of Escherichia coli using fluorescence. Biotechnol. Prog. 10:421-427. [Google Scholar]
- 25.Wilson, R. D., and D. M. Mackay. 2002. Diffusive oxygen emitters for enhancement of aerobic in situ treatment. Ground Water Monit. Remediation 22:88-98. [Google Scholar]
- 26.Zabriskie, D. W., and A. E. Humphrey. 1978. Estimation of fermentation biomass concentration by measuring culture fluorescence. Appl. Environ. Microbiol. 35:337-343. [DOI] [PMC free article] [PubMed] [Google Scholar]
- 27.Zhao, H. W., D. S. Mavinic, W. K. Oldham, and F. A. Koch. 1999. Controlling factors for simultaneous nitrification and denitrification in a two-stage intermittent aeration process treating domestic sewage. Water Res. 33:961-970. [Google Scholar]


