

Abstract
Spinal sensory (dorsal root ganglion; DRG) neurons display slowly inactivating, tetrodotoxin-resistant (TTX-R), and rapidly inactivating, TTX-sensitive (TTX-S) Na currents. Attenuation of the TTX-R Na current and enhancement of TTX-S Na current have been demonstrated in cutaneous afferent DRG neurons in the adult rat after axotomy and may underlie abnormal bursting. We show here that steady-state levels of transcripts encoding the α-SNS subunit, which is associated with a slowly inactivating, TTX-R current when expressed in oocytes, are reduced significantly 5 days following axotomy of DRG neurons, and continue to be expressed at reduced levels, even after 210 days. Steady-state levels of α-III transcripts, which are present at low levels in control DRG neurons, show a pattern of transiently increased expression. In situ hybridization using α-SNS- and α-III-specific riboprobes showed a decreased signal for α-SNS, and an increased signal for α-III, in both large and small DRG neurons following axotomy. Reduced levels of α-SNS may explain the selective loss of slowly inactivating, TTX-R current. The abnormal electrophysiological properties of DRG neurons following axonal injury thus appear to reflect a switch in Na channel gene expression.
Keywords: axonal injury, pain
Multiple voltage-gated Na currents with different kinetics and voltage dependence have been observed in spinal sensory (dorsal root ganglion; DRG) neurons, which relay signals from peripheral receptors into the central nervous system. These include rapidly inactivating, TTX-sensitive (TTX-S) currents, and slowly inactivating, TTX-resistant (TTX-R) Na currents (1–4). Interplay of the currents influences the firing properties of DRG neurons (5–8) and may contribute to ectopic generation of action potentials in these cells following injury to their axons within peripheral nerves (9).
Neural Na channels are heterotrimers composed of an α subunit and two β subunits, β1 and β2 (10–12). Nucleotide sequence variation allows identification of α subunits within single neurons by in situ hybridization (ISH) or in a cDNA pool using reverse transcriptase–PCR (RT-PCR) and restriction enzyme polymorphism (REP). ISH and RT-PCR/REP analyses have demonstrated that transcripts of multiple channel α subunits, including α-I, α-II, NaG, Na6, and hNE (PN1), are expressed in single DRG neurons (13). The expression of these transcripts may explain the diversity of Na currents in these cells. Recently, a novel α subunit [α-SNS (14), also termed PN3 (15)] was identified and found to be restricted to peripheral sensory neurons. α-SNS contains a serine at a site within domain I which has been shown, by site-directed mutagenesis, to confer resistance to TTX in the cardiac muscle Na channel (16). Expression of α-SNS cRNA produces a slowly inactivating, TTX-R current in Xenopus oocytes, suggesting that α-SNS is responsible for a TTX-R Na current in DRG neurons (14, 15).
Altered neuronal excitability has been demonstrated following axonal transection (17–19) and may underlie abnormal DRG bursting associated with pain syndromes (9, 20). Abnormal somatodendritic excitability following axotomy is Na dependent (21, 22), and it has been suggested that this is due to a shift, following axotomy, in vectorial transport of Na channels (23, 24). Recent experiments, however, demonstrated an attenuation of slowly inactivating, TTX-R currents and simultaneous enhancement of rapidly inactivating, TTX-S Na currents in large cutaneous afferent neurons following axotomy (25). This suggests an alternative mechanism, which could alter neuronal excitability—i.e., a switch in the types of Na channels that are expressed. Consistent with a switch in Na channel synthesis, transcripts encoding the α-III subunit, which are present at only very low levels in control DRG neurons, are expressed at moderate-to-high levels in axotomized DRG neurons together with elevated levels of α-I and α-II mRNAs (26). However, the effect of axotomy on other Na channel transcripts has not been examined, and a correlate for the reduced TTX-R currents following axonal injury has not been identified.
On the basis of our electrophysiological observations (25), we hypothesized that levels of α-SNS would decrease following axotomy of DRG neurons. To test this hypothesis, we used RT-PCR and ISH to study steady-state levels of α-SNS and α-III at specific time points following axotomy. Here we report a reduction in α-SNS transcripts that appears to explain the loss of the slowly inactivating, TTX-R Na currents in cutaneous afferent DRG neurons following axotomy. Further, we show that α-SNS levels are decreased in small, as well as large, DRG neurons following axotomy, suggesting that a reduction in slow, TTX-R currents may contribute to abnormal excitability of nociceptive neurons following axonal injury.
MATERIALS AND METHODS
Surgical Techniques.
Adult female Sprague–Dawley rats were anesthetized with ketamine/xylazine; sciatic nerves were exposed at mid-thigh level on the lesioned (A) side, ligated with 4-0 silk sutures, transected, and placed in a silicon cuff to prevent regeneration (27). The contralateral sciatic nerve served as control (C). Two rats were prepared for time points 1, 3, 14, 58, and 210 days post axotomy (dpa); four rats were prepared for time points 5, 7, and 21 dpa. Following CO2 narcosis and decapitation, axotomized and control L4 and L5 DRGs were collected in separate Microcentrifuge tubes.
RNA Extraction.
Total cellular RNA was isolated by the single-step guanidinium isothiocyanate/acid phenol procedure (28). Extraction buffer was used at 25 μl/mg of tissue (the two DRG pairs averaged 10 mg of wet weight). RNA concentration was determined by absorbance measurements at 230, 260, and 280 nm. The quality of the RNA was assessed by electrophoresis in a 1% agarose/2.2 M formaldehyde gel. First-strand cDNA was reverse-transcribed in a 50-ml final volume using 2 μg of total RNA, 1 mM random hexamer (Boehringer Mannheim), 500 units of SuperScript II reverse transcriptase (Life Technologies), and 100 units of RNase Inhibitor (Boehringer Mannheim). The buffer consisted of 50 mM Tris·HCl (pH 8.3), 75 mM KCl, 3 mM MgCl2, 10 mM DTT, and 5 mM dNTP. The reaction was allowed to proceed at 37°C for 90 min, then 42°C for 30 min, and finally terminated by heating to 65°C for 10 min.
PCR.
We used primers described by Akopian et al. (14) for amplification of the α-SNS sequence from the total cDNA pool. These primers amplify a 572-bp fragment corresponding to nucleotides 2111–2683 (GenBank accession no. X92184X92184). For subunit α-III, we used primers that amplify a 420-bp fragment in domain 1, including an alternatively spliced exon (29). The forward primer (5′-GACCCATGGAATTGGTTGGA-3′) corresponds to nucleotides 975–994; the reverse primer (5′-GACATAAAAGTGACTGTCATCTGC-3′) corresponds to nucleotides 1371–1394 (accession no. Y00766Y00766).
Rat β-actin sequences were coamplified using commercial primers (CLONTECH) for comparison to α-subunit transcripts. PCR from a cDNA template results in a 764-bp fragment, while a genomic template results in a 1440-bp fragment. A single DNA fragment, comigrating with the 800-bp marker, was detected in all PCR reactions, which indicates the absence of appreciable genomic DNA contamination (see Figs. 1A and 3A).
Figure 1.
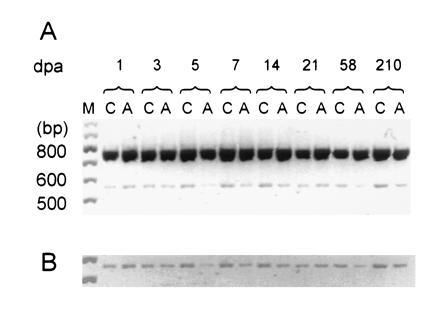
RT-PCR coamplification of α-SNS and β-actin transcripts from DRG following unilateral sciatic axotomy. (A) RT-PCR products from control (C) and axotomized (A) DRG at various dpa. Two products can be observed migrating slightly slower than the 800-bp marker (predicted β-actin product: 764 bp) and the 600-bp marker (predicted α-SNS product: 572 bp), respectively. Lane M contains a 100-bp standard. The gel image was digitized, inverted, and printed in black and white sublimation mode. (B) Computer enhancement for photographic purposes of the section of A containing the α-SNS amplification product.
Figure 3.
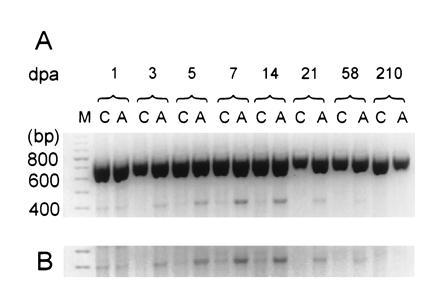
RT-PCR coamplification of α-III and β-actin transcripts. (A) RT-PCR products of transcripts from control (C) and axotomized (A) DRG at various dpa. Two products can be observed, one migrating slower than the 800-bp marker (predicted β-actin product: 764 bp) and another comigrating with the 400-bp marker (predicted α-III product: 412 bp). Lane M, 100-bp standard. (B) Computer enhancement of α-III amplification product.
Amplification was typically performed in a 60-μl volume using 1 μl of first-strand cDNA, 1.85 μM (α-SNS) and 2.25 μM (α-III) primer, and 1.75 units of Expand Long Template (Boehringer Mannheim) DNA polymerase enzyme mixture (30, 31). The reaction mixture contained β-actin primers (0.66 μM). Control PCR with template replaced by water produced no amplification products (data not shown). The PCR buffer consisted of 50 mM Tris·HCl (pH 9.2), 16 mM (NH4)2SO4, 2.25 mM MgCl2, 2% (vol/vol) dimethyl sulfoxide, and 0.1% Tween 20. Amplification was carried out in two stages (32): First, denaturation at 94°C for 4 min, annealing at 58°C for 2 min, and elongation at 72°C for 90 sec. Second, denaturation at 94°C for 1 min, annealing at 58°C for 1 min, and elongation at 72°C for 90 sec. The second stage was repeated 24 times (α-SNS) or 34 times (α-III) with the last elongation step extended to 10 min. Primer concentration and number of amplification cycles were empirically determined to ensure that amplification did not reach the plateau phase. Multiple amplifications were performed for every time point.
Amplification products were separated on a 1.6% agarose gel supplemented with 0.25 μg/ml ethidium bromide. Gel images were digitized using a GelBase 7500 system (Ultraviolet Products, San Gabriel, CA) with the grey scale converted to false colors. Gel tracks were scanned, and peaks corresponding to β-actin and α subunits were quantified in autoanalysis mode. The level of α-subunit cDNAs in the cDNA pool was expressed as a/(a + b), where a and b are the areas under the peaks of α-subunit and β-actin, to minimize the effect of variations in quantity of input RNA, efficiency of reverse transcription, and/or amplification among the samples. The level of the respective α subunit in the axotomized (A) side was expressed as a ratio, comparing it to the level on the contralateral side (A/C ± SE). origin (Microcal, MA) software was used for statistical analyses.
In Situ Hybridization.
Axotomized rats were deeply anesthetized with chloral hydrate and perfused with PBS and then with 4% paraformaldehyde in 0.14 M Sorensen’s phosphate buffer, pH 7.4, at 4°C. Control and axotomized L4 and L5 DRG were collected, placed in fixative at 4°C for 2–4 hr, and immersed in 4% paraformaldehyde/30% sucrose in 0.14 M phosphate buffer, pH 7.4, at 4°C. Sections (15 μm) were placed on poly-(l-lysine)-coated slides and processed for ISH cytochemistry with sense and antisense riboprobes as previously described (26, 33).
RESULTS
RT-PCR.
Comparison of the α-SNS amplification product, which migrates slightly faster than the 600-bp size marker for axotomized (A) and unlesioned contralateral (C) DRG consistent with its predicted length of 572 bp (14), indicates that there is an initial brief (1 dpa) up-regulation of steady-state α-SNS transcripts followed by a more sustained down-regulation that is most pronounced in the first week post axotomy (Fig. 1). A single amplification product was observed for each template, showing that there is no appreciable genomic DNA contamination in the samples. Using identical experimental conditions, we found comparable levels of transcripts for both α-SNS and α-III in control and sham-operated DRG tissues (data not shown).
The down-regulation of α-SNS transcripts was observed using two different primer sets: the α-SNS-specific primer set described by Akopian et al. (14) (Fig. 1) for all time points discussed below and α-SNS-specific primers that amplify sequences of the loop joining domains 1 and 2 (residues 1476–2129) for 7 dpa (data not shown). A similar pattern of α-SNS reduction was observed when templates from a more proximal dorsal root lesion were analyzed at 3, 7, and 21 dpa (data not shown).
Levels of α-SNS transcripts in the axotomized DRG were compared with those of the control contralateral DRG at 1, 3, 5, 7, 14, 21, 58, and 210 dpa. At least three independent amplification reactions were performed for each time point, with α-SNS amplification product normalized to the coamplified β-actin product. α-SNS levels were reduced in axotomized DRG at all postaxotomy times after 3 dpa (Fig. 2). The same pattern of down-regulation of α-SNS transcripts was observed with and without normalization to the β-actin coamplification product at all time points; the 21-dpa result shown in Fig. 1B is an exception and is probably due to more input RNA in the A sample (note that there is more β-actin coamplification product in A for this experiment).
Figure 2.
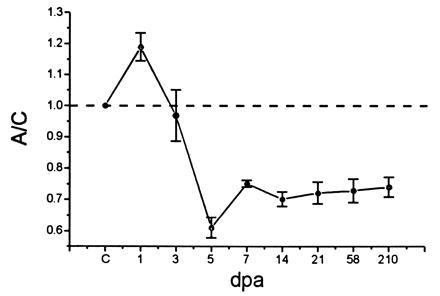
α-SNS transcript levels following axotomy. Levels of α-SNS transcripts in axotomized (A) and control (C) DRG were normalized to the coamplified β-actin transcripts. The A/C ratio is shown at various dpa. The A/C ratio of α-SNS transcripts in uninjured animals (indicated by C on the abscissa) is set at 1 and indicated by the dashed line. Four animals were used in the analysis at 5, 7, and 21 dpa, while two animals were used for each of the remaining time points. Mean ± SE from at least three independent amplifications was used to calculate each point, employing the origin program.
The level of α-SNS transcripts appeared to increase slightly at 1 dpa (A/C: 1.18 ± 0.04). Levels of α-SNS transcripts then significantly decrease and fall below control levels, with an A/C ratio of 0.6 ± 0.03 at 5 dpa (on a single-cell basis, this may represent an underestimate of the reduction in levels of transcript, since the ligation procedure does not result in transection of all axons within the nerve). Analysis of samples at 58 and 210 dpa indicates that α-SNS transcript levels in the axotomized DRG remain reduced compared with their preaxotomy levels even at these long postaxotomy times (Fig. 2).
The α-III subunit is expressed at low steady-state levels in adult DRG (refs. 13 and 26 and this study); therefore, quantification by RT-PCR was not attempted in this study. Qualitative analysis of the effect of axotomy on α-III transcripts was performed using α-III-specific primers (Fig. 3). As for α-SNS, α-III sequences were coamplified with β-actin (Fig. 3A). These experiments show that α-III transcript levels are up-regulated in the axotomized DRG tissue at 3 dpa, peak between 7 and 14 dpa, then decline by 21 dpa (Fig. 3A). The same pattern of up-regulation is observed when the amplification products are not normalized to those of β-actin (Fig. 3B). A similar result was observed using a generic primer set and REP with DraI to detect α-III (data not shown).
In Situ Hybridization.
Sections of DRG hybridized with α-SNS and α-III sense riboprobes showed no specific labeling (not shown). In control DRG hybridized with α-SNS antisense riboprobe, α-SNS signal was present in most small (<30-μm diameter) DRG neurons; in contrast, most large (>30-μm diameter) DRG neurons did not exhibit α-SNS hybridization signal (Fig. 4a). At 5 dpa (Fig. 4b), α-SNS hybridization signal was not detectable, or was detectable at low levels, in most DRG neurons of all sizes.
Figure 4.

Sodium channel mRNA α-SNS and α-III expression in control and axotomized DRG neurons. (a) α-SNS is expressed in most small DRG neurons and in some large neurons in control DRG. (b) At 5 dpa, the α-SNS hybridization signal is attenuated. (c) α-III, control DRG. (d) α-III, 5 dpa. (e) Representative field from control DRG hybridized with α-SNS probe, to show + (1), ++ (2), and +++ (3) signals. (×250; bar = 40 μm.)
In control DRG sections hybridized with α-III antisense riboprobe, most neurons did not display signal above background levels (Fig. 4c). At 5 dpa, however, moderate-to-high levels of α-III hybridization signal were present in DRG neurons of all sizes (Fig. 4d).
To confirm that α-SNS was decreased in both small and large DRG neurons, and that α-III was elevated in both groups of cells, we subdivided neurons into small (<30-μm diameter) and large (>30-μm diameter) subgroups (Table 1). We observed a decrease in the percentage of large (control, 22%; postaxotomy, 16%) and small (control, 84%; postaxotomy, 28%) DRG neurons displaying moderate or high levels of α-SNS hybridization signal following axotomy. We also confirmed the increase in the percentage of large (control, 4%; postaxotomy, 25%) and small (control, 6%; postaxotomy, 33%) DRG neurons expressing moderate or high levels of α-III following axotomy.
Table 1.
Expression of sodium channel α-subunit mRNAs SNS and III in control and axotomized DRG neurons in situ
| mRNA | Tissue | % small neurons (<30-μm
diameter)
|
% large neurons (>30-μm diameter)
|
||||||||
|---|---|---|---|---|---|---|---|---|---|---|---|
| 0 | + | ++ | +++ | (n) | 0 | + | ++ | +++ | (n) | ||
| SNS | Control | 3.1 | 13.2 | 42.2 | 41.5 | (258) | 44.2 | 33.7 | 19.6 | 2.5 | (163) |
| SNS | Axotomized | 40.4 | 31.6 | 23.6 | 4.4 | (225) | 58.3 | 25.9 | 14.4 | 1.4 | (139) |
| III | Control | 44.4 | 50.0 | 5.6 | 0.0 | (144) | 63.3 | 32.5 | 4.2 | 0.0 | (121) |
| III | Axotomized | 29.1 | 38.3 | 23.3 | 9.2 | (120) | 27.5 | 46.1 | 17.6 | 7.8 | (102) |
Numbers are percentage of DRG neurons that express 0, undetectable; +, marginal/low; ++, moderate; and +++, high levels of hybridization signal for each size class. Numbers in parentheses, number of DRG neurons for each size class scored for expression of sodium channel mRNA from at least two separate experiments.
DISCUSSION
The major findings of this study are that: (i) transcript levels for Na channel α-SNS are down-regulated in DRG neurons following axotomy; (ii) there is a concomitant up-regulation of the Na channel α-III transcript following axotomy; and (iii) these changes occur in both large and small DRG neurons.
Following axonal transection, the neuronal cell body displays retrograde changes that reflect disconnection from postsynaptic targets (34, 35), changes in axo–glial interactions (36), or an intrinsic reaction of the neuron to injury (37, 38). These changes include altered excitability of the soma-dendritic compartment and axon initial segment (17, 19), which involves Na-dependent electrogenesis (22, 23). While these early experiments were interpreted as suggesting a shift in vectorial transport of channels in axotomized neurons (21, 24), our results indicate that an altered pattern of gene expression contributes to the electrophysiological changes.
When studied at 18 dpa, large cutaneous afferent DRG neurons display a selective attenuation of slow, TTX-R Na currents and an enhancement of the fast, TTX-S Na currents (25). An ISH study on α-I, -II, and -III mRNAs in axotomized DRG neurons demonstrated an up-regulation of Na channel mRNA α-I and -II, and the expression at moderate-to-high levels of α-III, which is present in embryonic DRG neurons but is barely detectable in adult nonlesioned DRG neurons (26). The present results demonstrate that the up-regulation of α-III mRNA in DRG neurons peaks at 7–14 days following axotomy and then declines. Assuming that α-III corresponds to a fast, TTX-S Na current, these observations suggest that the expression of this Na current in DRG neurons following axotomy should show a similar time course.
In contrast to α-III, our results show a decrease in α-SNS transcripts in axotomized DRG. Comparison of α-SNS and α-III amplification products shows reciprocal changes in the transcripts of these two Na channels, possibly because they are influenced by opposing regulatory mechanisms. It is not clear how axotomy affects the expression of β-actin in DRG. mRNA encoding one form of β-tubulin is significantly increased, while neurofilament NF68 mRNA decreases following sciatic nerve axotomy (39). The fact that steady-state levels of α-SNS transcripts are down-regulated, while α-III transcript levels are up-regulated in axotomized DRG, indicates that these effects do not represent a nonspecific increase in channel expression following axonal injury, and it suggests that normalization with respect to β-actin levels does not introduce a large systematic error. Indeed, while the fast, TTX-S Na current (25) and a delayed tetraethylammonium-sensitive K current (40) increase in DRG neurons following axonal injury, inward rectification decreases (19, 41) together with the slow, TTX-R Na current, consistent with down-regulation of the appropriate transcripts.
Our findings demonstrate a down-regulation of transcripts for α-SNS and an up-regulation of transcripts for α-III in both large and small DRG neurons. On the basis of these results, we are led to predict that, in addition to the attenuation of slow, TTX-R Na current that has been observed in axotomized cutaneous afferent DRG neurons (25), an altered pattern of Na channel gene expression and a loss of slow, TTX-R sodium current should occur in small DRG neurons. Since these include nociceptive cells (42), our observations may be relevant to the pathogenesis of neuropathic pain, which results from abnormal burst activity following axonal injury (43, 44). Na currents in some DRG neurons display weak voltage dependence, with the open probability increasing over a large voltage domain (45). In DRG neurons which express abnormal combinations of Na channels following axonal injury, window currents can overlap, and activation of weakly voltage-dependent Na channels can produce subthreshold voltage excursions that trigger regenerative activity in steeply voltage-dependent channels, generating inappropriate burst activity that is associated with pain and paresthesia (9). On the basis of the present findings, we suggest that abnormal expression of Na channels encoded by α-III and α-SNS mRNA participates in this pathophysiologic process.
Acknowledgments
We thank B. R. Toftness for technical assistance. This work was supported in part by grants from the National Multiple Sclerosis Society and Medical Research Service, Department of Veterans Affairs.
Footnotes
Abbreviations: DRG, dorsal root ganglion; dpa, days post axotomy; ISH, in situ hybridization; RT-PCR, reverse transcriptase–polymerase chain reaction; REP, restriction enzyme polymorphism; TTX, tetrodotoxin; TTX-S and TTX-R, TTX-sensitive and -resistant.
References
- 1.Kostyuk P G, Veselovsky N, Tsyandryenko A. Neuroscience. 1981;6:2423–2430. doi: 10.1016/0306-4522(81)90088-9. [DOI] [PubMed] [Google Scholar]
- 2.Yoshida S, Matsuda Y, Samejima A. J Neurophysiol. 1978;639:125–134. doi: 10.1152/jn.1978.41.5.1096. [DOI] [PubMed] [Google Scholar]
- 3.Roy M L, Narahashi T. J Neurosci. 1992;12:2104–2111. doi: 10.1523/JNEUROSCI.12-06-02104.1992. [DOI] [PMC free article] [PubMed] [Google Scholar]
- 4.Caffrey J M, Eng D L, Black J A, Waxman S G, Kocsis J D. Brain Res. 1992;592:283–297. doi: 10.1016/0006-8993(92)91687-a. [DOI] [PubMed] [Google Scholar]
- 5.Elliott A A, Elliott J R. J Physiol (London) 1993;463:39–56. doi: 10.1113/jphysiol.1993.sp019583. [DOI] [PMC free article] [PubMed] [Google Scholar]
- 6.Honmou O, Utzschneider D A, Rizzo M A, Bowe C M, Waxman S G, Kocsis J D. J Neurophysiol. 1994;71:1627–1638. doi: 10.1152/jn.1994.71.5.1627. [DOI] [PMC free article] [PubMed] [Google Scholar]
- 7.Jeftinija S. Brain Res. 1994;639:125–134. doi: 10.1016/0006-8993(94)91772-8. [DOI] [PubMed] [Google Scholar]
- 8.Schild J H, Clark J W, Hay M, Medelowitz D, Andresen M C, Kunze D L. J Neurophysiol. 1994;71:2338–2358. doi: 10.1152/jn.1994.71.6.2338. [DOI] [PubMed] [Google Scholar]
- 9.Rizzo M A, Kocsis J D, Waxman S G. Eur Neurol. 1996;36:3–12. doi: 10.1159/000117192. [DOI] [PubMed] [Google Scholar]
- 10.Catterall W A. Trends Neurosci. 1993;16:500–506. doi: 10.1016/0166-2236(93)90193-p. [DOI] [PubMed] [Google Scholar]
- 11.Isom L L, De Jongh K S, Catterall W A. Neuron. 1994;12:1183–1194. doi: 10.1016/0896-6273(94)90436-7. [DOI] [PubMed] [Google Scholar]
- 12.Isom L L, Ragsdale D S, De Jongh K S, Westenbroek R E, Reber B F X, Scheuer T, Catterall W A. Cell. 1995;83:433–442. doi: 10.1016/0092-8674(95)90121-3. [DOI] [PubMed] [Google Scholar]
- 13.Black, J. A., Dib-Hajj, S., McNabola, K., Jeste, S., Rizzo, M. A., Kocsis, J. D. & Waxman, S. G. (1996) Mol. Brain Res., in press. [DOI] [PubMed]
- 14.Akopian A N, Sivilotti L, Wood J N. Nature (London) 1996;379:258–262. doi: 10.1038/379257a0. [DOI] [PubMed] [Google Scholar]
- 15.Sangameswaran L, Delgado S G, Fish L M, Koch B D, Jakeman L B, Stewart G R, Sze P, Hunter J C, Eglen R M, Herman R C. J Biol Chem. 1996;271:5953–5956. doi: 10.1074/jbc.271.11.5953. [DOI] [PubMed] [Google Scholar]
- 16.Satin J, Kyle J W, Chen M, Bell P, Cribbs L L, Fozzard H A, Rogart R B. Science. 1992;256:1202–1205. doi: 10.1126/science.256.5060.1202. [DOI] [PubMed] [Google Scholar]
- 17.Eccles J C, Libet B, Young R R. J Physiol (London) 1958;143:11–40. doi: 10.1113/jphysiol.1958.sp006041. [DOI] [PMC free article] [PubMed] [Google Scholar]
- 18.Kuno M, Llinas R. J Physiol (London) 1970;210:807–821. doi: 10.1113/jphysiol.1970.sp009243. [DOI] [PMC free article] [PubMed] [Google Scholar]
- 19.Gallego R, Ivorra I, Morales A. J Physiol (London) 1987;391:39–56. doi: 10.1113/jphysiol.1987.sp016724. [DOI] [PMC free article] [PubMed] [Google Scholar]
- 20.Matzner O, Devor M. Brain Res. 1992;597:92–98. doi: 10.1016/0006-8993(92)91509-d. [DOI] [PubMed] [Google Scholar]
- 21.Dodge F A, Jr, Cooley J. IBM J Res Dev. 1973;17:219–229. [Google Scholar]
- 22.Sernagor E, Yarom Y, Werman R. Proc Natl Acad Sci USA. 1986;83:7966–7970. doi: 10.1073/pnas.83.20.7966. [DOI] [PMC free article] [PubMed] [Google Scholar]
- 23.Titmus M J, Faber D S. J Neurophysiol. 1986;55:1440–1454. doi: 10.1152/jn.1986.55.6.1440. [DOI] [PubMed] [Google Scholar]
- 24.Titmus M J, Faber D S. Prog Neurobiol (Oxford) 1990;35:1–51. doi: 10.1016/0301-0082(90)90039-j. [DOI] [PubMed] [Google Scholar]
- 25.Rizzo M A, Kocsis J D, Waxman S G. Neurobiol Dis. 1995;2:87–96. doi: 10.1006/nbdi.1995.0009. [DOI] [PubMed] [Google Scholar]
- 26.Waxman S G, Kocsis J D, Black J A. J Neurophysiol. 1994;72:466–470. doi: 10.1152/jn.1994.72.1.466. [DOI] [PMC free article] [PubMed] [Google Scholar]
- 27.Fitzgerald M, Wall P D, Geodert M, Emson P C. Brain Res. 1985;332:131–141. doi: 10.1016/0006-8993(85)90396-8. [DOI] [PubMed] [Google Scholar]
- 28.Chomczynski P, Sacchi N. Ann Biochem. 1987;162:156–159. doi: 10.1006/abio.1987.9999. [DOI] [PubMed] [Google Scholar]
- 29.Gustafson T A, Clevinger E C, O’Neill T J, Yarowsky P J, Krueger B K. J Biol Chem. 1993;268:18648–18653. [PubMed] [Google Scholar]
- 30.Barnes W M. Proc Natl Acad Sci USA. 1994;91:2216–2220. doi: 10.1073/pnas.91.6.2216. [DOI] [PMC free article] [PubMed] [Google Scholar]
- 31.Cheng S, Fockler C, Barnes W M, Higuchi R. Proc Natl Acad Sci USA. 1994;91:5695–5699. doi: 10.1073/pnas.91.12.5695. [DOI] [PMC free article] [PubMed] [Google Scholar]
- 32.Dib-Hajj S D, Waxman S G. FEBS Lett. 1995;377:485–488. doi: 10.1016/0014-5793(95)01400-4. [DOI] [PubMed] [Google Scholar]
- 33.Black J A, Yokoyama S, Higashida H, Ransom B R, Waxman S G. Mol Brain Res. 1994;22:275–290. doi: 10.1016/0169-328x(94)90056-6. [DOI] [PubMed] [Google Scholar]
- 34.Foehring R, Sypert G W, Munson J. J Neurophysiol. 1986;55:947–965. doi: 10.1152/jn.1986.55.5.947. [DOI] [PubMed] [Google Scholar]
- 35.Purves D, Nja A. In: Neuronal Plasticity. Cotman C W, editor. New York: Raven; 1978. pp. 27–47. [Google Scholar]
- 36.Bhisitkul R, Kocsis J D, Gordon T, Waxman S G. Exp Neurol. 1990;109:273–278. doi: 10.1016/s0014-4886(05)80017-2. [DOI] [PubMed] [Google Scholar]
- 37.Grafstein B. In: The Retina, Part II. Adler R, Farber D B, editors. New York: Academic; 1986. pp. 275–335. [Google Scholar]
- 38.Waxman S G, Anderson M J. Cell Tissue Res. 1982;223:487–492. doi: 10.1007/BF00218470. [DOI] [PubMed] [Google Scholar]
- 39.Hoffman P N, Cleveland D W. Proc Natl Acad Sci USA. 1988;85:4530–4533. doi: 10.1073/pnas.85.12.4530. [DOI] [PMC free article] [PubMed] [Google Scholar]
- 40.Utzschneider D, Bhisitkul R, Kocsis J D. Muscle Nerve. 1993;16:958–963. doi: 10.1002/mus.880160912. [DOI] [PubMed] [Google Scholar]
- 41.Czeh G, Kudo N, Kuno M. J Physiol (London) 1977;270:165–180. doi: 10.1113/jphysiol.1977.sp011944. [DOI] [PMC free article] [PubMed] [Google Scholar]
- 42.Perl E R. In: Sensory Neurons. Scott S, editor. New York: Oxford Univ. Press; 1992. pp. 3–23. [Google Scholar]
- 43.Wall P D, Devor M. Pain. 1983;17:321–339. doi: 10.1016/0304-3959(83)90164-1. [DOI] [PubMed] [Google Scholar]
- 44.Kajander K C, Wakisaka S, Bennett G J. Neurosci Lett. 1992;138:225–228. doi: 10.1016/0304-3940(92)90920-3. [DOI] [PubMed] [Google Scholar]
- 45.Rizzo M A, Kocsis J D, Waxman S G. J Neurophysiol. 1994;72:2796–2816. doi: 10.1152/jn.1994.72.6.2796. [DOI] [PMC free article] [PubMed] [Google Scholar]