Abstract
We developed methods for measuring inflammatory biomarkers (cytokines, chemokines, and metalloproteinases) in synovial biopsy specimens from patients with rheumatoid arthritis (RA) and osteoarthritis (OA). Soluble extracts of synovial fragments were prepared with mild detergent and analyzed by enzyme-linked immunosorbent assay (ELISA) for interleukin 1β (IL-1β), IL-6, IL-8, tumor necrosis factor alpha (TNF-α), and matrix metalloproteinase 3. The optimal detergent was 0.1% Igepal CA-630, which interfered minimally with ELISA detection but extracted 80% of IL-6 from synovial tissue. Upon spiking, 81 to 107% of added biomarkers could be recovered. To determine within-tissue variability, multiple biopsy specimens from each RA synovial extract were analyzed individually. A resulting coefficient of variation of 35 to 62% indicated that six biopsy specimens per synovial extract would result in a sampling error of ≤25%. Preliminary power analysis suggested that 8 to 15 patients per group would suffice to observe a threefold difference before and after treatment in a serial biopsy clinical study. The previously described significant differences in IL-1β, IL-6, IL-8, and TNF-α levels between RA and OA could be detected, thereby validating the use of synovial extracts for biomarker analysis in arthritis. These methods allow monitoring of biomarker protein levels in synovial tissue and could potentially be applied to early-phase clinical trials to provide a preliminary estimate of drug efficacy.
Rheumatoid arthritis (RA) is a chronic inflammatory disease characterized by synovial membrane hyperplasia with invasion and destruction of cartilage and bone (reviewed in reference 13). While no definitive biological marker exists for the diagnosis and prognosis of RA, the levels of biomarkers such as cytokines, chemokines, and metalloproteinases can potentially reflect the inflammatory state in joints. Several studies have addressed the feasibility of biomarker analysis in serum and synovial fluids in arthritis (reviewed in references 17 and 24). Because the synovial membrane is the main site of inflammation in RA, however, there is a need for direct analysis of cytokines, chemokines, and metalloproteinases in synovial tissue. For instance, synovial biopsy specimens have been analyzed by immunohistochemical methods (for examples, see references 3, 5, 10, 20, and 22). These techniques allow identification of regional differences within the synovial membrane as well as the cellular source. However, the detection system is nonlinear and requires semiquantitative scoring systems or image analysis to estimate the relative level of expression (cf. references 9 and 20). Absolute quantification over a wide concentration range and determination of normalized protein expression levels cannot be achieved with these techniques.
To identify alternative methods that allow more precise and accurate determination of biomarker levels, we developed techniques to extract synovial biopsy specimens for enzyme-linked immunosorbent assay (ELISA) determination of the levels of cytokines (tumor necrosis factor alpha [TNF-α], interleukin 1β [IL-1β], and IL-6), a chemokine (IL-8), and a matrix metalloproteinase (matrix metalloproteinase 3 [MMP-3], also known as stromelysin-1). These techniques were optimized with regard to the choice of detergent. Tissues from RA and osteoarthritis (OA) patients were compared to validate the assays, and they confirmed previously reported findings of differences in biomarker levels. This is the first report in which solid-phase immunoassays have been optimized to quantify biomarkers in extracts of articular samples. These methods could potentially be applied to synovial biopsy specimens obtained in early clinical trials and yield important information about the mechanism of action and efficacy of novel therapeutic agents.
MATERIALS AND METHODS
Synovial tissue.
Hip or knee synovial tissue was collected at the time of joint replacement surgery from patients diagnosed with RA (n = 10) or OA (n = 15) after obtaining informed consent and University of California—San Diego Institutional Review Board approval. The tissue was immediately placed on ice and transported to the laboratory. Synovial membrane fragments (size, 1 to 2 mm2) were excised with a fine scalpel, placed in microcentrifuge tubes, and snap-frozen in liquid nitrogen. Samples were stored at −80°C until the time of extraction with detergent. The size of these fragments is representative of the amount that is obtained by needle or arthroscopic biopsy. For experiments designed to compare extraction efficiency of various detergents, larger portions of joint tissue (up to 1 cm3) were pulverized in a liquid nitrogen-chilled Plattner's mortar (Fisher Scientific, Pittsburgh, Pa.) and stored in powder form at −80°C.
Preparation of synovial extracts.
Frozen synovial fragments or aliquots of pulverized tissue were weighed and immediately placed in chilled Kontes-Duall tissue grinders with a 1-ml capacity (Fisher). Ice-cold extracting buffer, consisting of 0.1% Igepal CA-630 nonionic detergent (Sigma, St. Louis, Mo.) in phosphate-buffered saline (PBS) with added protease inhibitor cocktail (Complete Mini; Roche Applied Science, Indianapolis, Ind.), was then added at a rate of 50 μl per 10 mg of tissue. The mixture was ground by hand on ice until only fibrous white insoluble connective tissue remained. After incubating the mixture for at least 10 min on ice, it was transferred to a microcentrifuge tube and centrifuged for 10 min at 20,000 × g at 4°C. The resulting supernatant was divided into aliquots and stored at −80°C for later analysis. The total protein content in extracts diluted 1:10 in distilled water was determined with DC protein assay reagents (Bio-Rad Laboratories, Hercules, Calif.). In some experiments, alternative extraction buffers containing various concentrations of Igepal CA-630 (0.03 to 1% Igepal) or Triton X-100 (0.075 to 0.25%) were used.
ELISAs.
Colorimetric ELISA kits were used to detect the following biomarkers: human IL-1β, IL-8, and TNF-α (R&D Systems, Minneapolis, Minn.); IL-6 (Pierce Endogen, Rockford, Ill.); and MMP-3 (Amersham-Pharmacia, Piscataway, N.J.). The IL-1β and TNF-α ELISA procedures contain a signal amplification step to enhance sensitivity (Quantikine HS). Except for the MMP-3 kit, none of these kits had previously been validated for use with tissue extracts according to the manufacturers. Before assaying, synovial extracts were always diluted at least 1:10 in the recommended kit diluent, and in some cases, extracts had to be reassayed at a higher dilution (typically 1:30) to allow detection. Standard solutions of various concentrations were also prepared in 10% extracting buffer. Although a sample volume of 200 μl was recommended for some kits, we found that reducing the sample volume to 100 μl did not negatively affect the performance of these assays. Absorbance values were determined with a GENios plate reader (Tecan, Inc., Durham, N.C.), and concentrations in samples were determined by regression line curve fitting on log-log standard results.
Western blotting.
Aliquots of pulverized synovial tissue or insoluble material remaining after extraction with 0.1% Igepal were extracted with radioimmunoprecipitation assay (RIPA) buffer (0.1% sodium dodecyl sulfate, 0.5% deoxycholic acid, 1% Igepal, 150 mM NaCl, and 50 mM Tris-HCl [pH 8]; Sigma). The resulting lysate (150 μg of protein/lane from whole tissue or the corresponding amount of tissue for Igepal-extracted material) was boiled in reducing sample buffer (Bio-Rad), fractionated on Tris-glycine-buffered 15% sodium dodecyl sulfate-polyacrylamide gels, and transferred to nitrocellulose membranes. After blocking with 5% nonfat milk (Bio-Rad) in Tris-buffered saline containing 0.1% Tween 20 (Fisher), membranes were incubated first with primary antibody to goat anti-human IL-6 (1:500; R&D Systems) or goat anti-human β-actin (1:200; Santa Cruz Biotechnology, Santa Cruz, Calif.) and then with horseradish peroxidase-conjugated donkey anti-goat immunoglobulin G (1:5,000; Santa Cruz Biotechnology). Immunoreactive proteins were detected by chemiluminescence (Amersham), and their levels were determined by densitometry on resulting films.
Data analysis.
Results are expressed as means ± standard errors of the means (SEM) of the concentration in undiluted extracts or of the amount per milligram of total extracted protein, unless otherwise indicated. The extraction efficiencies of various detergents were compared by analysis of variance and Tukey's exact post hoc test. The within-tissue coefficient of variation (CV) was calculated as the standard deviation expressed as a percentage of the mean value. Power analysis was used to determine the sampling error and number of biopsy specimens required per tissue as well as to provide a preliminary estimate of the required number of subjects needed per treatment group. Differences between biomarker levels in RA and OA synovial extracts were examined by Student's t test, using log-transformed data to obtain homogeneity of variance. For correlation analysis, Pearson product-moment correlation coefficients were determined, and significance was determined after correction for multiple comparisons.
RESULTS
Effect of detergent concentration.
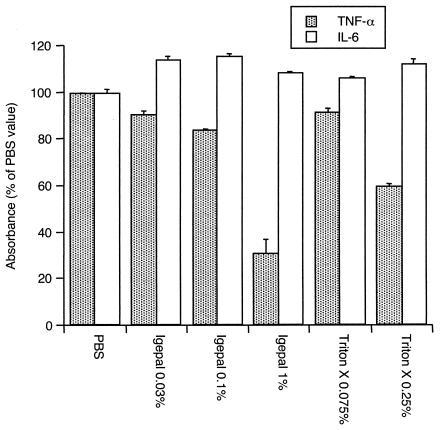
To identify an extraction buffer that would only minimally interfere with ELISA detection of cytokines, assays of IL-6 and TNF-α standards were performed with various buffers containing various detergent concentrations and diluted 1:10 with kit diluent as described in Materials and Methods. IL-6 was readily detectable under all conditions (Fig. 1). On the other hand, detection of TNF-α was inhibited by 1% Igepal and 0.25% Triton X-100. Lower detergent concentrations allowed detection of TNF-α within about 80% of the value observed with the standard diluent plus PBS alone (Fig. 1). Full standard curves for IL-1β, IL-6, IL-8, MMP-3, and TNF-α were then generated in the presence of extraction buffer diluted 1:10 and containing 0.1% Igepal. As the data in Table 1 indicate, all assays tolerated these conditions well. The average signal strength for a range of standard concentrations was approximately 100% for all, except TNF-α, for which some minor interference could again be detected. The linearity of detection was nearly perfect, and the coefficients of determination (r2) were always greater than 0.99 (Table 1). These results demonstrate that the optimized extraction buffer (0.1% Igepal in PBS with protease inhibitors) minimally interferes with the detection of biomarkers in solid-phase immunoassays.
FIG. 1.
Detection of TNF-α or IL-6 by ELISA in extracting buffers containing various nonionic detergents. Solutions of TNF-α (36 or 107 pg/ml) or IL-6 (100 or 300 pg/ml) were diluted 1:10 with kit diluent before assaying. Igepal (1%) and Triton X-100 (0.25%) inhibited the detection of TNF-α, whereas IL-6 detection was similar in all buffers tested. The data are means ± SEM and are expressed as percent absorbance values obtained with PBS (diluted 1:10) in kit diluent.
TABLE 1.
Ability to detect biomarkers by ELISA in extracting buffer containing 0.1% Igepal
| Biomarker | Standard range (amt/ml) | Signal (% of PBS control)a | r2 in diluted extracting bufferb |
|---|---|---|---|
| IL-1β | 0.25-16 pg | 110.0 ± 6.9 | 0.999 |
| IL-6 | 1.6-156.25 pg | 100.2 ± 2.7 | 0.994 |
| IL-8 | 8-512 pg | 106.1 ± 2.9 | 0.998 |
| MMP-3 | 2.5-160 ng | 108.1 ± 2.6 | 0.999 |
| TNF-α | 0.5-32 pg | 70.4 ± 5.5 | 0.995 |
The signal is the absorbance value in Igepal as percentage of the value in PBS. The data are given as means ± SEM for all standard concentrations.
r2, coefficient of determination from regression analysis on log-log Igepal-diluted standard curves.
Ability of 0.1% Igepal to extract cytokines.
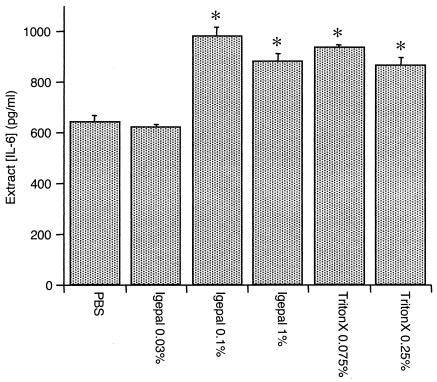
While 0.1% Igepal allowed detection of biomarkers without significant interference, it is possible that the concentration might be too low for efficient tissue extraction. In preliminary studies, IL-6 was always readily detectable in RA extracts. Therefore, buffers containing various detergent concentrations were used to extract aliquots of pulverized RA synovial tissue, and the extract content of IL-6 was determined by ELISA. As shown in Fig. 2, 0.1% Igepal extracted amounts of IL-6 comparable to those extracted by 1% Igepal and 0.25% Triton X-100. A lower concentration of Igepal did not remove significantly more IL-6 than PBS alone.
FIG. 2.
IL-6 concentration in synovial tissue from an RA joint extracted with buffers containing various detergent conditions. Asterisks indicate P values of <0.05 compared to results with PBS alone by analysis of variance and Tukey's exact post hoc test. All detergents except 0.03% Igepal extracted similar amounts of IL-6 and were more efficient than PBS alone. The data are means ± SEM of the results from duplicate determinations.
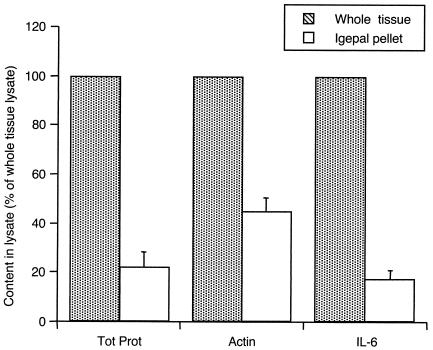
To estimate the percentage of IL-6 that was extracted by 0.1% Igepal, similar amounts of pulverized RA synovial tissue were either extracted with RIPA buffer or first incubated with 0.1% Igepal and then the insoluble pellet was reextracted with RIPA buffer. The resulting lysates were then evaluated by Western blot analysis. Figure 3 shows that only about 20% of IL-6 and total tissue protein remained in the insoluble pellet following extraction with 0.1% Igepal, whereas about half of the more-insoluble β-actin remained. Hence, even though 0.1% Igepal constitutes a very mild detergent condition, it allows extraction of the majority of cytokine from synovial tissue.
FIG. 3.
Efficiency of IL-6 removal from the insoluble fraction of synovial tissue when extracted with 0.1% Igepal. Western blotting was performed on whole tissue or the insoluble pellet remaining after 0.1% Igepal extraction and developed with anti-actin or anti-human IL-6, and protein amounts were quantified by densitometry. For comparison, the total protein (Tot Prot) amounts in tissue and pellet lysate are shown. Less than 20% of IL-6 remained in the insoluble fraction after the extraction procedure. The data are means ± SEM of the results from two RA synovia and are expressed as percentages of the amounts in whole tissue.
Recovery of biomarkers in synovial extracts.
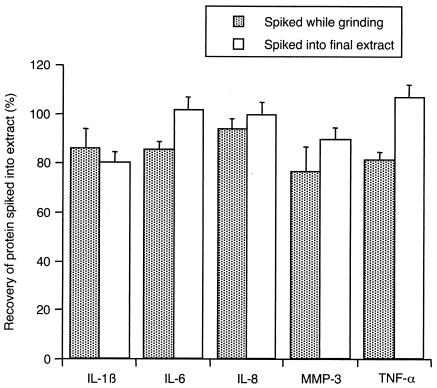
To determine whether synovial tissue extracts contain any constituents that interfere with ELISA detection of biomarkers, known amounts of IL-1β, IL-6, IL-8, MMP-3, and TNF-α (corresponding to the midpoint of the standard curve for each ELISA) were added to either final synovial extracts or to the synovial tissue-buffer mixture in the tissue grinder immediately prior to processing. The resulting mixtures were assayed by ELISA along with solutions of biomarkers at the same concentrations but without synovial extracts. All spiked biomarkers were readily recovered, whether they were added at the beginning of the extraction procedure (82 to 94% recovery) or to the final extracts (81 to 107% recovery) (Fig. 4). No differences were observed between RA and OA extracts in this regard, and the recovery of spiked biomarkers was of equal magnitude whether baseline levels in extracts were high or low (data not shown).
FIG. 4.
Recovery of spiked biomarkers in synovial tissue extracts. Various proteins were spiked into tissue or extracting buffer immediately prior to grinding or into final synovial extracts. At least 80% recovery was observed. The data are means ± SEM of the results from 2 RA tissues and 1 OA tissue (spiked before processing) or from 4 to 6 RA tissue extracts and 3 to 8 OA tissue extracts (spiked into final extract).
Within-tissue variability of biomarker content and power analysis.
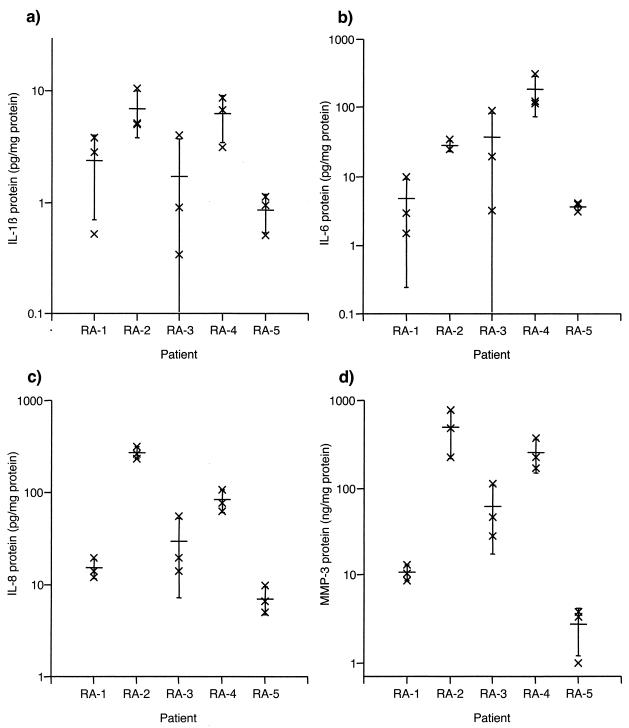
Regional differences in biomarker production have been noted in RA synovial extracts with a variety of techniques. However, the magnitude of intrasynovial variation is not well defined. Therefore, multiple synovial tissue fragments (1 to 2 mm2) from each of five RA patients were individually extracted and subjected to total protein determination and ELISA. IL-1β, IL-6, IL-8, and MMP-3 were readily detectable (Fig. 5a to d, respectively); TNF-α was only detected in 4 of 15 extracts, thereby precluding determination of the intratissue CV for this biomarker. CV analysis for the remaining markers (Table 2) indicated that IL-1β and IL-6 levels varied the most within tissues, whereas IL-8 varied the least. No difference was observed whether data were expressed as the concentration in the extracts (i.e., normalized to wet weight, since a fixed volume of extraction buffer was added per milligram of tissue) or as the biomarker amount normalized to the total protein content in the extracts (Table 2). Power analysis indicated that a CV of 62%, as determined for the most variable markers, IL-1β and IL-6, yielded approximate sampling errors of 25 and 21%, respectively, if six or nine biopsy specimens were pooled and analyzed together. Also, if two joints were biopsied, a CV of 62% (as determined for IL-1β and IL-6, the most variable markers) would allow detection of a threefold difference between joints in extracts from six pooled biopsy specimens or a twofold difference in nine pooled biopsy specimens.
FIG. 5.
Within-tissue variability of levels of IL-1β (a), IL-6 (b), IL-8 (c), and MMP-3 (d) in synovial tissue extracts from 5 RA patients expressed as amounts per milligram of total protein. Three different synovial fragments from each tissue were extracted with 0.1% Igepal and diluted 1:10 before ELISA. Individual data points (×) are shown together with the means ± standard deviations (wide bar and brackets) on a logarithmic scale.
TABLE 2.
Within-tissue variability of biomarker concentrations in RA synovial extractsa
| Biomarker | Average CV (%) (range), normalized by wet wt | Average CV (%) (range), normalized by total extracted protein content |
|---|---|---|
| IL-1β | 66 (39-124) | 62 (37-113) |
| IL-6 | 64 (9-134) | 62 (13-124) |
| IL-8 | 37 (4-89) | 35 (15-76) |
| MMP-3 | 54 (12-88) | 49 (21-72) |
Within-tissue CVs were calculated for extracts of three individual tissue fragments from each of 5 RA synovia.
This data set was also used to yield a preliminary estimate of the patient group size needed to conduct a clinical study of synovial biomarker content following treatment with placebo or drug (two treatment groups). A paired design was assumed wherein a study subject would be biopsied before and immediately following treatment. To detect a threefold difference in change scores between treatment groups at a one-sided α-level of 0.05, a group size of 8 to 15 patients would be required, depending on the biomarker of interest.
Biomarker levels in RA and OA synovial extracts.
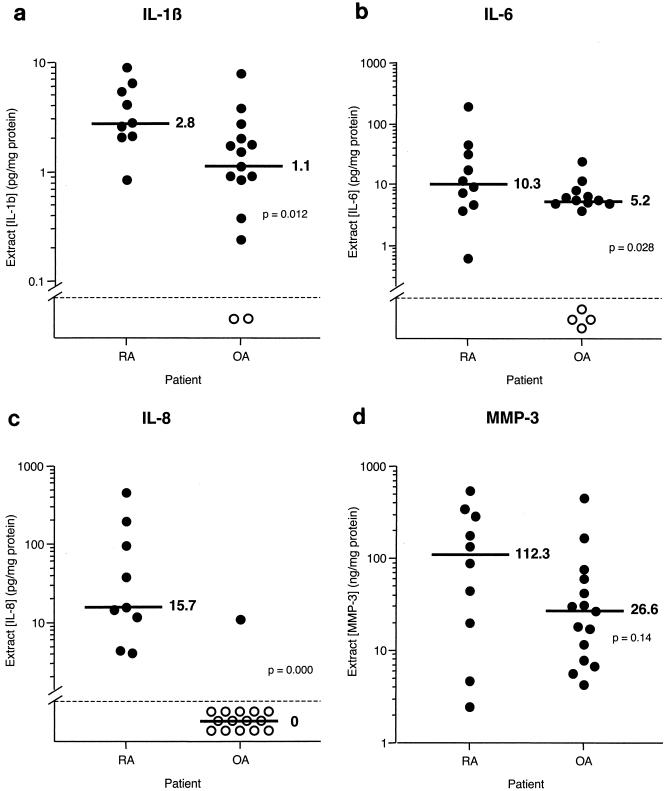
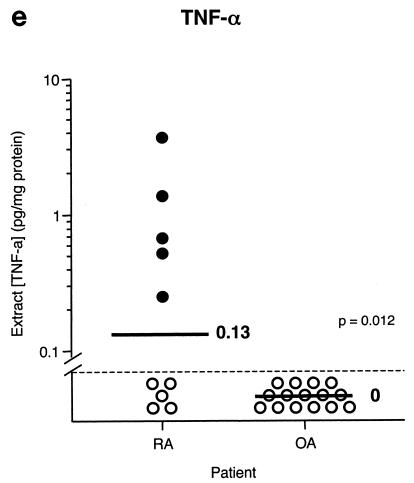
Earlier studies have demonstrated significant differences between RA and OA synovial extracts in terms of biomarker content. To determine whether our techniques would yield similar results (which would serve to validate our approach), synovial tissue fragments from joints of 10 RA and 15 OA patients were extracted and subjected to ELISA. The results are shown in Fig. 6 and are expressed as amounts of biomarker per milligram of total protein. The protein contents in RA and OA synovial extracts were 10.1 ± 1.5 and 7.1 ± 0.9 mg of protein/ml, respectively, and were not significantly different. IL-1β and IL-6 were present in all RA tissues and most OA tissues, and they were significantly elevated in RA compared to OA. IL-8 was found in all RA tissues but only in one OA tissue. All RA and OA tissues contained MMP-3, and there was a trend toward greater amounts in RA tissues, although no significant difference was found. Levels of TNF-α were generally low; only 50% of RA tissues and none of the OA tissues contained detectable levels.
FIG. 6.
Comparison of levels of IL-1β (a), IL-6 (b), IL-8 (c), MMP-3 (d), and TNF-α (e) in extracts from RA and OA synovial tissue fragments. Individual data points (circles) and medians (bars) are shown on a logarithmic scale. Median values are indicated. P values were determined by Student's t test with log-transformed data. Stippled line, limit of detection; closed and open circles, extracts with detectable and undetectable levels, respectively.
To determine whether biomarker levels in RA synovial tissue were related to each other, correlation analysis was performed with data from individually extracted RA synovial fragments (n = 21). Significant correlations were observed for IL-1β versus IL-8 (r = 0.84), IL-1β versus MMP-3 (r = 0.70), and IL-8 versus MMP-3 (r = 0.72). Neither IL-6 nor TNF-α levels correlated to any other of the biomarkers studied.
DISCUSSION
We have evaluated the use of ELISAs to determine the levels of biomarkers such as cytokines, chemokines, and matrix metalloproteinases in soluble extracts of synovial biopsy specimens obtained from patients with RA. Mild extraction conditions, including mechanical disruption in a low detergent concentration, were chosen, since they were expected to expose the antigens and minimize aggregation while preserving capture and detection by sandwich ELISA. Our results demonstrate the feasibility of this approach and indicate that the described methods are applicable to studies of synovial extracts. For instance, the optimized detergent condition (0.1% Igepal, diluted 1:10 before ELISA) did not interfere substantially with the detection of biomarkers but allowed extraction of synovial tissue to the same extent as that obtained under harsher detergent conditions. In addition, the recovery of spiked IL-1β, IL-6, IL-8, TNF-α, and MMP-3 was greater than 80%, indicating the absence of any constituents that hinder detection of biomarkers by ELISA. Finally, studies of within-joint variability of biomarker levels with samples that are the same size as standard biopsy specimens indicate that the evaluation of six to nine individual biopsy specimens per joint would reduce the sampling error to about 20%. Because blind needle and arthroscopy procedures routinely obtain 15 or more biopsy specimens per joint (cf. reference 20), the dedication of 6 to 9 biopsy specimens to biomarker analysis is feasible and offers an adequate reflection of the cytokine-chemokine-matrix metalloproteinase milieu in the intact synovial tissue. Interestingly, a similar number of individual biopsy specimens was deemed appropriate in studies of sampling error in immunohistochemical analysis of cytokine expression in synovial tissue (9).
Five different biomarkers were selected to reflect the inflammatory environment in RA: TNF-α, IL-1β, IL-6, IL-8, and the matrix metalloproteinase MMP-3. TNF-α, IL-1β, and IL-6 are known to be key cytokines that contribute to inflammation in RA, and therapies targeting these cytokines have had considerable clinical success (2, 4, 6). The main source of TNF-α and IL-1β is synovial macrophage-like cells, whereas IL-6 is produced by synovial fibroblasts and, to a lesser extent, macrophages (11). IL-8, also known as CXCL8, was the first chemokine characterized in RA synovial fluid and is produced by synovial macrophages and fibroblasts (1, 15). MMP-3, along with MMP-1, is a synovial lining-derived protease that participates in the destruction of bone and cartilage in RA (reviewed in reference 13). Naturally, the methods described herein could be applied to many other types of biomarkers as well as other tissues, provided that they are present in sufficient amounts and that available ELISA reagents permit the use of the chosen detergent.
To validate this novel approach for biomarker quantification in synovial tissue, we used the optimized methods to determine whether previously described differences in biomarker expression between RA and OA synovial tissue could be replicated. Previous studies demonstrated that synovial fluid from RA patients contains higher levels of IL-1β (23), IL-6 (14), IL-8 (15), and TNF-α (21) than synovial fluid from OA patients. When analyzed by immunohistochemistry, a higher number of cells in RA synovial tissue express IL-1β, IL-6, TNF-α (10), and IL-8 (7) than in OA synovial tissue. Similar results were obtained in the present study, with statistically significant differences observed between RA and OA synovial extracts for IL-1β, IL-6, IL-8, and TNF-α. Of note, TNF-α was only detected in 50% of the RA synovia and in none of the OA tissues. Similar findings were reported for synovial fluid and synovial tissue with a variety of techniques (19, 21, 22). A trend toward higher levels of MMP-3 was also observed in RA. Previous studies indicate that matrix metalloproteinase protein and gene expression are generally higher in RA than OA (3, 12, 18). The observed correlations between IL-1β, MMP-3, and IL-8 levels may reflect the fact that IL-1β induces expression of both MMP-3 (16) and IL-8 (8) in synovial cells.
The techniques described in the present study could potentially be used to evaluate new therapeutic agents for arthritis. Currently, clinical trials with RA generally must enroll large numbers of patients to demonstrate meaningful changes in clinical parameters. Such trials can be very costly, and patient enrollment (often several hundred are required) can be challenging. In addition, many of the novel therapeutics moving into clinical trials have as their target specific immunopathological pathways (such as inhibitors of cytokines, leukocyte accumulation, or destructive proteases). Traditional assessments of therapeutic efficacy for RA do not provide information regarding the influence of new agents on the specific pathway that they were designed to modify. Using biomarker analysis of synovial biopsy specimens, the effect on a specific mediator can be studied more directly. Therefore, a novel paradigm for the clinical testing of novel therapeutic entities can be envisioned in which early-phase clinical trials can provide preliminary efficacy information by using biomarkers to facilitate decisions regarding more extensive studies. Synovial biopsy specimens can be obtained from a relatively small number of patients and used to quantify biomarkers of inflammation, joint destruction, and drug action. To minimize patient-to-patient variability and increase the statistical power of the study, serial synovial biopsy specimens should be evaluated. The number of patients per group required for such studies was estimated to be around 10, depending on the biomarker used. In comparison, recent clinical studies of the efficacy of biological agents inhibiting TNF-α enrolled more than 80 patients in each treatment group (6).
In conclusion, we developed and optimized techniques by which biomarkers of inflammation and joint destruction can easily be quantified in synovial biopsy tissue extracts by using readily available ELISA reagents. Observed differences between RA and OA synovial tissue reflect earlier findings from other approaches. While we do not propose the utilization of these methods for the purpose of diagnosis and prognosis of the course of arthritis, they have the potential to add substantial information to facilitate the evaluation of novel therapeutic agents.
.
REFERENCES
- 1.Brennan, F. M., C. O. Zachariae, D. Chantry, C. G. Larsen, M. Turner, R. N. Maini, K. Matsushima, and M. Feldmann. 1990. Detection of interleukin 8 biological activity in synovial fluids from patients with rheumatoid arthritis and production of interleukin 8 mRNA by isolated synovial cells. Eur. J. Immunol. 20:2141-2144. [DOI] [PubMed] [Google Scholar]
- 2.Calabrese, L. H. 2002. Anakinra treatment of patients with rheumatoid arthritis. Ann. Pharmacother. 36:1204-1209. [DOI] [PubMed] [Google Scholar]
- 3.Case, J. P., R. Lafyatis, E. F. Remmers, G. K. Kumkumian, and R. L. Wilder. 1989. Transin/stromelysin expression in rheumatoid synovium. A transformation-associated metalloproteinase secreted by phenotypically invasive synoviocytes. Am. J. Pathol. 135:1055-1064. [PMC free article] [PubMed] [Google Scholar]
- 4.Choy, E. H. S., D. A. Isenberg, T. Garrood, S. Farrow, Y. Ioannou, H. Bird, N. Cheung, B. Williams, B. Hazleman, R. Price, K. Yoshizaki, N. Nishimoto, T. Kishimoto, and G. S. Panayi. 2002. Therapeutic benefit of blocking interleukin-6 activity with an anti-interleukin-6 receptor monoclonal antibody in rheumatoid arthritis. Arthritis Rheum. 46:3143-3150. [DOI] [PubMed] [Google Scholar]
- 5.Chu, C. Q., M. Field, S. Allard, E. Abney, M. Feldmann, and R. N. Maini. 1992. Detection of cytokines at the cartilage/pannus junction in patients with rheumatoid arthritis: implications for the role of cytokines in cartilage destruction and repair. Br. J. Rheumatol. 31:653-661. [DOI] [PubMed] [Google Scholar]
- 6.Criscione, L. G., and E. W. St. Clair. 2002. Tumor necrosis factor-α antagonists for the treatment of rheumatic disease. Curr. Opin. Rheumatol. 14:204-211. [DOI] [PubMed] [Google Scholar]
- 7.Deleuran, B., P. Lemche, M. Kristensen, C. Q. Chu, M. Field, J. Jensen, K. Matsushima, and K. Stengaard-Pedersen. 1994. Localisation of interleukin 8 in the synovial membrane, cartilage-pannus junction and chondrocytes in rheumatoid arthritis. Scand. J. Rheumatol. 23:2-7. [DOI] [PubMed] [Google Scholar]
- 8.DeMarco, D., S. L. Kunkel, R. M. Strieter, M. Basha, and R. B. Zurier. 1991. Interleukin-1 induced gene expression of neutrophil activating protein (interleukin-8) and monocyte chemotactic peptide in human synovial cells. Biochem. Biophys. Res. Commun. 31:411-416. [DOI] [PubMed] [Google Scholar]
- 9.Dolhain, R. J. E. M., N. T. Ter Haar, R. de Kuiper, I. G. Nieuwenhuis, A. H. Zwinderman, F. C. Breedveld, and A. M. M. Miltenburg. 1998. Distribution of T cells and signs of T-cell activation in the rheumatoid joint: implications for semiquantitative comparative histology. Br. J. Rheumatol. 37:324-330. [DOI] [PubMed] [Google Scholar]
- 10.Farahat, M. N., G. Yanni, R. Poston, and G. S. Panayi. 1993. Cytokine expression in synovial membranes of patients with rheumatoid arthritis and osteoarthritis. Ann. Rheum. Dis. 52:870-875. [DOI] [PMC free article] [PubMed] [Google Scholar]
- 11.Firestein, G. S., J. M. Alvaro-Gracia, and R. Maki. 1990. Quantitative analysis of cytokine gene expression in rheumatoid arthritis. J. Immunol. 144:3347-3353. [PubMed] [Google Scholar]
- 12.Firestein, G. S., M. M. Paine, and B. H. Littman. 1991. Gene expression (collagenase, tissue inhibitor of metalloproteinases, complement, and HLA-DR) in rheumatoid arthritis and osteoarthritis synovium. Arthritis Rheum. 34:1094-1105. [DOI] [PubMed] [Google Scholar]
- 13.Firestein, G. S. 1998. Rheumatoid synovitis and pannus, p. 5.13.1-5.13.24. In J. H. Klippel and P. A. Dieppe (ed.), Rheumatology, 2nd ed. Mosby International, London, United Kingdom.
- 14.Houssiau, F. A., J. P. Devogelaer, J. Van Damme, C. Nagant de Deuxchaisnes, and J. Van Snick. 1988. Interleukin-6 in synovial fluid and serum of patients with rheumatoid arthritis and other inflammatory arthritides. Arthritis Rheum. 31:784-788. [DOI] [PubMed] [Google Scholar]
- 15.Koch, A. E., S. L. Kunkel, J. C. Burrows, H. L. Evanoff, G. K. Haines, R. M. Pope, and R. M. Strieter. 1991. Synovial tissue macrophage as a source for the chemotactic cytokine IL-8. J. Immunol. 147:2187-2195. [PubMed] [Google Scholar]
- 16.MacNaul, K. L., N. Chartrain, M. Lark, M. J. Tocci, and N. I. Hutchinson. 1990. Discoordinate expression of stromelysin, collagenase, and tissue inhibitor of metalloproteinases-1 in rheumatoid human synovial fibroblasts. Synergistic effects of interleukin-1 and tumor necrosis factor-alpha on stromelysin expression. J. Biol. Chem. 265:17238-17245. [PubMed] [Google Scholar]
- 17.Nakamura, R. M. 2000. Progress in the use of biochemical and biological markers for evaluation of rheumatoid arthritis. J. Clin. Lab. Anal. 14:305-313. [DOI] [PMC free article] [PubMed] [Google Scholar]
- 18.Sasaki, S., H. Iwata, N. Ishiguro, K. Obata, and T. Miura. 1994. Detection of stromelysin in synovial fluid and serum from patients with rheumatoid arthritis and osteoarthritis. Clin. Rheumatol. 13:228-233. [DOI] [PubMed] [Google Scholar]
- 19.Saxne, T., M. A. Palladino, D. Heinegard, N. Talal, and F. A. Wollheim. 1988. Detection of tumor necrosis factor alpha but not tumor necrosis factor beta in rheumatoid arthritis synovial fluid and serum. Arthritis Rheum. 31:1041-1055. [DOI] [PubMed] [Google Scholar]
- 20.Tak, P. P., T. J. Smeets, M. R. Daha, P. M. Kluin, K. A. Meijers, R. Brand, A. E. Meinders, and F. C. Breedveld. 1997. Analysis of the synovial cell infiltrate in early rheumatoid synovial tissue in relation to local disease activity. Arthritis Rheum. 40:217-225. [DOI] [PubMed] [Google Scholar]
- 21.Tetta, C., G. Camussi, V. Modena, C. Di Vittorio, and C. Baglioni. 1990. Tumour necrosis factor in serum and synovial fluid of patients with active and severe rheumatoid arthritis. Ann. Rheum. Dis. 49:665-667. [DOI] [PMC free article] [PubMed] [Google Scholar]
- 22.Ulfgren, A. K., L. Gröndal, S. Lindblad, M. Khademi, O. Johnell, L. Klareskog, and U. Andersson. 2000. Interindividual and intra-articular variation of proinflammatory cytokines in patients with rheumatoid arthritis: potential implications for treatment. Ann. Rheum. Dis. 59:439-447. [DOI] [PMC free article] [PubMed] [Google Scholar]
- 23.Westacott, C. I., J. T. Whicher, I. C. Barnes, D. Thompson, A. J. Swan, and P. A. Dieppe. 1990. Synovial fluid concentration of five different cytokines in rheumatic diseases. Ann. Rheum. Dis. 49:676-681. [DOI] [PMC free article] [PubMed] [Google Scholar]
- 24.Wollheim, F. A. 2000. Markers of disease in rheumatoid arthritis. Curr. Opin. Rheumatol. 12:200-204. [DOI] [PubMed] [Google Scholar]


