The findings of this study suggest that data of copy number gains and losses obtained with array CGH might be employed for computational differential diagnosis of B-cell lymphomas.
Keywords: diffuse large B-cell lymphoma, mantle cell lymphoma, array CGH, genome profile, lymphoma classification
Abstract
Background
The differentiation of biologically and clinically different malignant lymphoma diseases or subtypes is crucial because it leads to better prognostication and therapeutic decision-making. Attempts have been made at subtype classification for diagnosing lymphomas on the basis of gene-expression profiling. Although array-based comparative genomic hybridization (array CGH) has identified a characteristic genomic alteration pattern for each disease entity, it has not been clear whether each patient with certain genomic alterations can be classified by array CGH data.
Design and Methods
Data on copy number gains and losses for 46 diffuse large B-cell lymphomas and 29 mantle cell lymphomas were used. The gene expressions of the diffuse large B-cell lymphomas cases were profiled and hierarchical clustering revealed that 28 of them were of the activated B-cell type and 18 were of the germinal center-B-cell type. Using these data, we developed a computer algorithm to classify lymphoma diseases or subtypes on the basis of copy number gains and losses.
Results
The method correctly classified 88% of the diffuse large B-cell lymphomas and mantle cell lymphomas, and 83% of the activated B-cell and germinal center-B-cell subtypes. These results demonstrate that copy number gains and losses detected by array CGH can be used for classifying lymphomas into biologically and clinically distinct diseases or subtypes.
Conclusions
Our computer algorithm based on array CGH data successfully classified diffuse large B-cell lymphomas and mantle cell lymphomas and activated B-cell and germinal center-B-cell subtypes with high accuracy. An important finding is that the regions automatically identified by the computer algorithm were located in the critical regions that are likely to be involved in the development of lymphoma.
Introduction
Malignant lymphomas comprise various disease entities
Malignant lymphomas are usually diagnosed on the basis of results of pathological and immunochemical investigations. The presence of disease-specific translocations and clinical features are also important for the diagnosis of lymphomas.1 We have identified genomic copy number alterations for several malignant lymphomas including diffuse large B-cell lymphoma (DLBCL),2,3 mantle cell lymphoma (MCL),4 and T/NK cell leukemia/lymphoma5 by means of array-based comparative genomic hybridization (array CGH). We also discovered subtype-specific genomic alterations in DLBCL6 and adult T-cell leukemia/lymphoma.7
Several recent studies have shown the power of gene-expression analysis for the classification of malignant lymphoma diseases and subtypes.8–12 In these studies, computer algorithms were developed to select differentially expressed genes and use them to construct the classifier. In the study presented here, we examined whether genomic copy number gains and losses detected by array CGH could also be used for the classification of malignant lymphomas and developed a computer algorithm for this purpose. This algorithm is similar to the ones used in gene expression-based classification,11 but slightly modified to deal with array CGH data. We applied the algorithm to the classification of 75 cases of malignant lymphoma into 46 cases of DLBCL and 29 of MCL, as well as to further classify the 46 DLBCL cases into 28 of the activated-B-cell (ABC) subtype and 18 of the germinal center-B-cell (GCB) subtype.4,6
MCL is a single disease entity characterized by the translocation of (11;14)(q13;q32) accompanied by over-expression of CCND1.1 DLBCL is known to be the most common tumor and accounts for 40% of all malignant lymphomas.1 Gene expression analysis of DLBCL has demonstrated that these lymphomas comprise distinct tumor subtypes such as the ABC and GCB subtypes.8 ABC DLBCL is an aggressive lymphoma and the overall survival rate of patients with this subtype is inferior to that of patients with the GCB subtype.8,9 We recently demonstrated that ABC and GCB DLBCL have distinct patterns of genomic alterations.6 However, although we demonstrated that each disease entity has a characteristic pattern of genomic alterations, it was not clear whether the array CGH data could be used for classification because patients with the same disease entity vary from case to case. In the current study, we investigated whether genomic copy number gains and losses detected by array CGH could reliably distinguish different lymphoma diseases (DLBCL and MCL) as well as different subtypes (ABC and GCB). We hypothesized that an analysis of genomic copy number gains and losses would provide useful information for accurate and reproducible diagnosis of malignant lymphomas.
Design and Methods
Array comparative genomic hybridization and gene expression profiling
The array consisted of 2304 BAC and PAC clones (ACC versions 3.0 and 4.0), covering the whole human genome with a resolution of roughly 1.3 Mb.2–7 The array CGH data on 46 DLBCL and 29 MCL cases used for the present bioinformatics study were published previously (Online Supplementary Appendix).4,6 All of the samples showed at least some genome copy number changes, indicating that the tumor percentage of the sample was over 20%, as previously described.13 Expression profiles of all the DLBCL cases had been previously examined using the microarray glass slide of an Agilent oligonucleotide array custom-made for the Cancer Institute of the Japanese Foundation for Cancer Research (Tokyo, Japan), on which a total of 21,619 genes were spotted (Agilent Technologies, Palo Alto, CA, USA).6 The DLBCL cases were classified into 28 ABC DLBCL and 18 GCB DLBCL cases by means of a hierarchical clustering algorithm, as described previously (raw data: Online Supplementary Data 3).6 This subtype classification was also confirmed using the method described by Wright et al.11 (Online Supplementary Figure S1). In order to identify the normal variations for the log2-ratio signals, we performed 16 normal versus normal hybridizations in the same array. Clones in the sex chromosome and those with average log2-ratios deviated from 0 by ±3.0 standard deviations (SD) were excluded. Clones that were not shared by array glass versions 3 and 4 were also excluded. This procedure resulted in the exclusion of 270 clones; the remaining 2035 clones were used for the analysis. The threshold of the log2-ratio for copy number gains and losses was determined to yield a false discovery rate of 10%. The log2-ratio signals with a difference between the duplicated log2-ratios deviating from 0 by ±3.0 SD were defined as no-copy-number alterations These preprocessing procedures are described in detail in Online Supplementary Appendix. All the data used in the present analysis can be obtained from the supplementary information page http://www-nkn.ics.nitech.ac.jp/~takeuchi/ACGH with username: guest and password: acghclassifier.
Array comparative genomic hybridization-based classifier
We developed a fully automatic computer algorithm for the array CGH-based classification of lymphoma subtypes. This algorithm is similar to those employed in the classification of malignant lymphomas using gene expression profiles.11 Linear predictor scores were computed for each case on the basis of copy number gains and losses detected by the array CGH. The scaling factors (coefficients) of the linear predictor scores were selected as the (signed) negative log of the p values obtained with Fisher’s exact test. Only those clones with the most significant differences determined with Fisher’s exact test were used to produce the linear predictor scores, with the optimal number of clones determined empirically (see below). The distribution of the linear predictor scores for each of the two disease entities (DLBCL and MCL) was approximated by using the normal distribution. The means and variances of these normal distributions were estimated from the linear predictor score calculated for the cases with each disease entity. For a new case, we estimated the likelihood of it belonging to one of the disease entities and then classified it by applying Bayes’ rule. The formal description of the array CGH-based linear compound Bayes’ classifier is provided in Online Supplementary Appendix.
Validation
Leave-one-out cross-validation (LOOCV) was used to estimate the performance of the classifier. As discussed in recent publications,14–16 LOOCV can produce a more reliable measure of classification accuracy than validating the performance with an independent validation set. We also used LOOCV to determine the optimal number of clones used to form linear predictor scores. For this purpose, we used nested-LOOCV with the outer loop to estimate the classification accuracy and the inner loop to determine the optimal number of clones. We also performed classification analyses by dividing the cases into training (60%) and validation (40%) sets. The classifier was then constructed with the training set and tested with the validation set. Results of the classification performances were not significantly different (p=0.05) from those of the LOOCV analyses for both the DLBCL-MCL and the ABC-GCB classifications.
Each clone’s significance of the differences in copy number alterations was evaluated using Fisher’s exact test, the false discovery rate and the family-wise error rate. The last two measures take into account multiple comparisons. We performed 10,000 label permutations to compute the false discovery rate and the family-wise error rate. The validation strategy and the computations for the significance measures are explained in detail in Online Supplementary Appendix.
Results
Classification of diffuse large B-cell lymphomas and mantle cell lymphomas
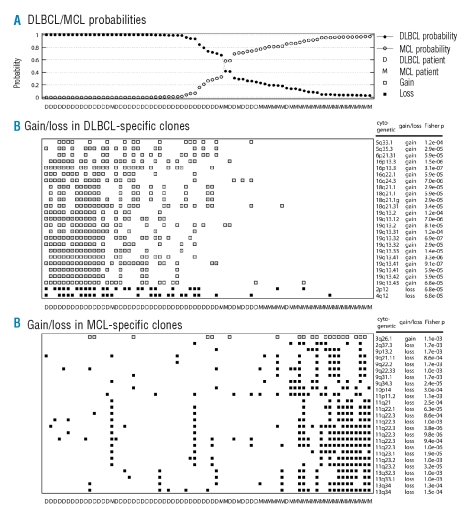
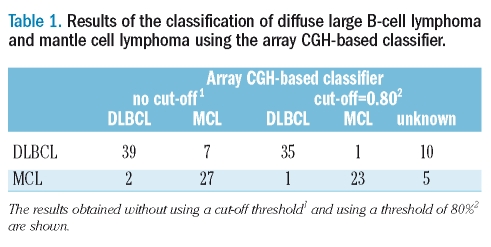
The classification accuracy estimated by LOOCV was 88% (95%CI: 0.822–0.938). The probabilities of DLBCL and MCL assignment obtained from the classifier are plotted in Figure 1A, and the classification results are summarized in Table 1. Without the cut-off threshold, eight DLBCL cases were mis-classified as MCL and three MCL cases were mis-classified as DLBCL. With the 80% cut-off level, only three cases were mis-diagnosed. For each of the LOOCV analyses, copy number gains and losses of an average of 49.7 clones (SD=13.5) were used for the classifier. We further tested the classifier’s performance by dividing the cases into training and validation sets. As detailed in the Validation section, the classification accuracy was not significantly different (p=0.05) from that achieved using the LOOCV analyses.
Figure 1.
Performance of the array-CGH based classifier for the classification of diffuse large B-cell lymphomas and mantle cell lymphomas. (A) Probability of the 75 malignant lymphoma cases being diagnosed as diffuse large B-cell lymphoma or mantle cell lymphoma using the array CGH-based classifier. (B) Top 25 clones that showed gains or losses more frequently in diffuse large B-cell lymphoma than in mantle cell lymphoma. (C) Top 25 clones that showed gains or losses more frequently in mantle cell lymphoma than in diffuse large B-cell lymphoma.
Table 1.
Results of the classification of diffuse large B-cell lymphoma and mantle cell lymphoma using the array CGH-based classifier.
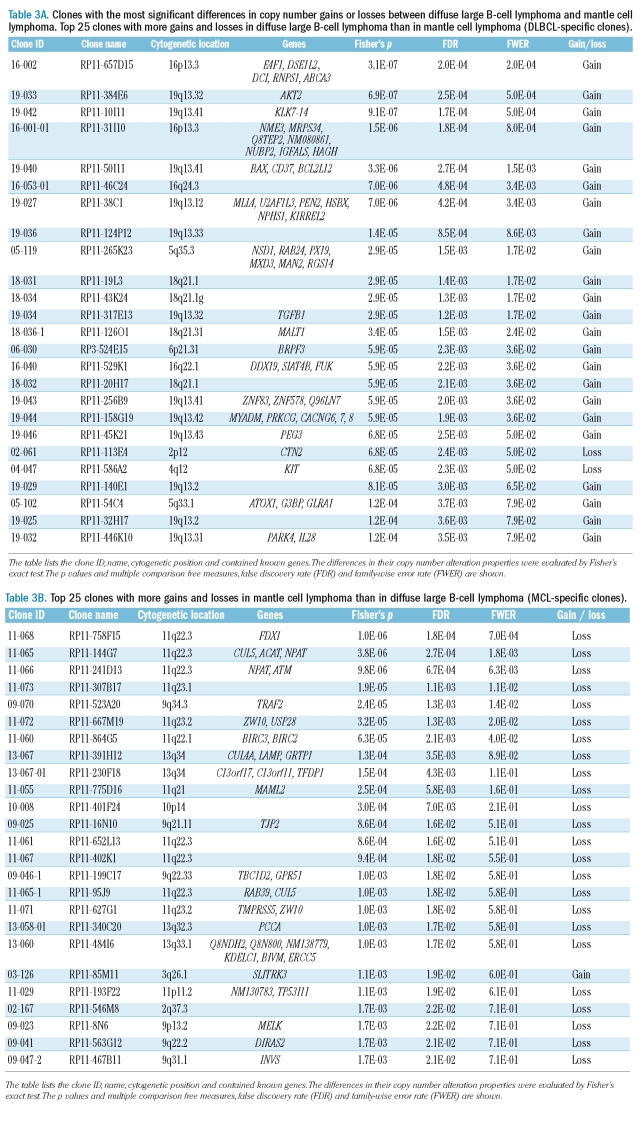
Figure 1B shows the top 25 clones which showed gains and losses more frequently in DLBCL than in MCL, while Figure 1C shows the top 25 clones with the reverse difference in frequency. These differences in frequency were determined using the one-sided Fisher’s exact test. Figures 1B and 1C also show gains and losses observed in 25×2 clones for all 75 patients. As can be seen from the detailed information on these 50 clones listed in Table 3p values (from the one-sided Fisher’s exact test) were below 1.7×10⁻³, the false discovery rate was below 2.1×10⁻², and the family-wise error rate was below 7.1×10⁻¹. In the entire LOOCV analysis, only these 50 clones were selected for the classifications.
Table 3A.
Clones with the most significant differences in copy number gains or losses between diffuse large B-cell lymphoma and mantle cell lymphoma. Top 25 clones with more gains and losses in diffuse large B-cell lymphoma than in mantle cell lymphoma (DLBCL-specific clones).
Activated-B-cell and germinal center-B-cell classification
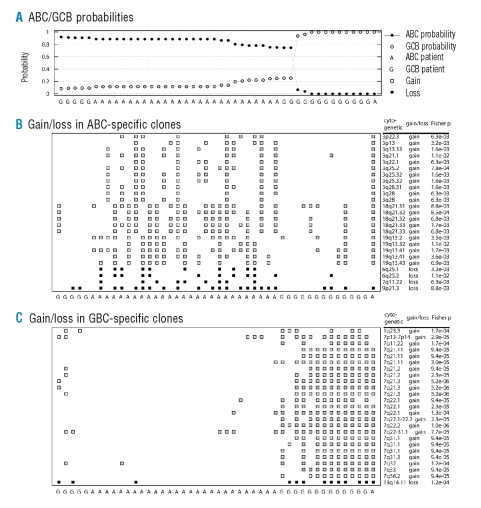
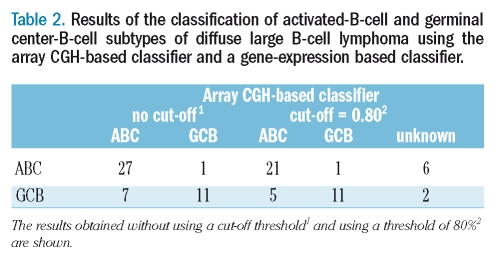
The classification accuracy estimated by LOOCV was 82.6% (95%CI: 0.717–0.936). The probabilities of ABC and GCB assignment obtained from the classifier are plotted in Figure 2A, and the classification results are summarized in Table 2. One ABC case was mis-classified as GCB and seven GCB cases were mis-classified as ABC, and even with the 80% cut-off level, six cases were still mis-diagnosed. For each LOOCV analysis, copy number gains and losses of an average of 9.0 clones (SD=12.8) were used for the classifier. We further tested the classifier’s performance by dividing the cases into training and validation sets as detailed previously in the section on Validation. The classification accuracy was slightly worse than that for the LOOCV analysis because of the small size of the sample used for constructing the classifier.
Figure 2.
Performance of the array-CGH based classifier for the classification of activated-B-cell and germinal center-B-cell subtypes of diffuse large B-cell lymphoma. (A) Probability of the 46 malignant diffuse large B-cell lymphoma cases being diagnosed as activated-B-cell or germinal center-B-cell subtype using the array CGH-based classifier. (B) Top 25 clones which showed gains or losses more frequently in the activated-B-cell subtype than in the germinal center-B-cell subtype. (C) Top 25 clones which showed gains or losses more frequently in the germinal center-B-cell subtype than in the activated-B-cell subtype. Note that the subtypes activated-B-cell (represented as ‘A’) and germinal center-B-cell (represented as ‘G’) were defined using clustering analysis based on gene expression profiles.6
Table 2.
Results of the classification of activated-B-cell and germinal center-B-cell subtypes of diffuse large B-cell lymphoma using the array CGH-based classifier and a gene-expression based classifier.
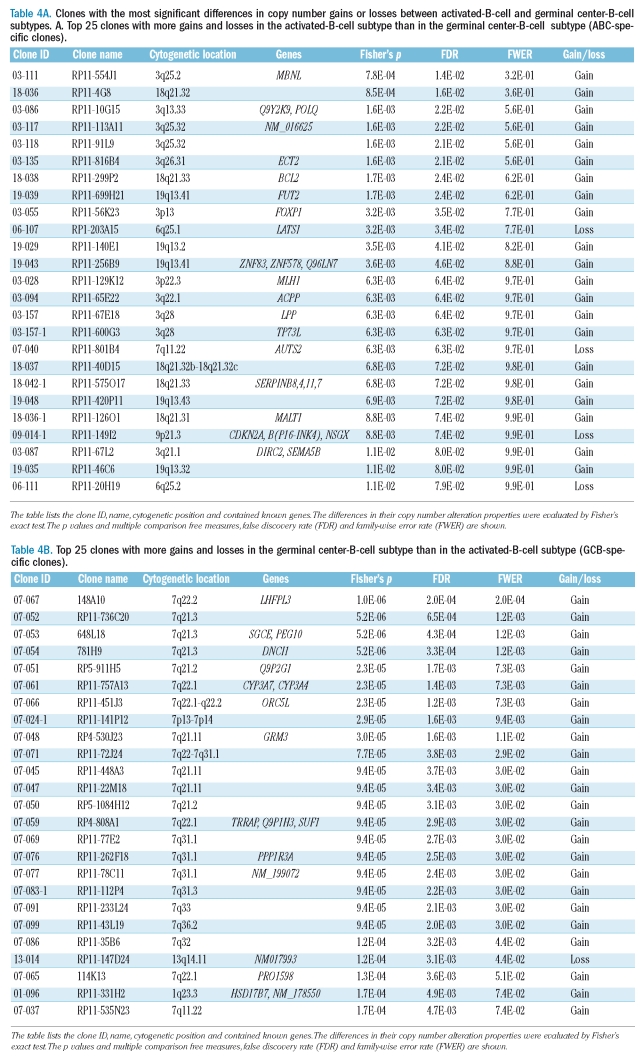
Figure 2B shows the top 25 clones which showed gains and losses more frequently in ABC than in GCB, while Figure 2C shows the top 25 clones with the reverse difference in frequency.
These differences in the frequency were determined using the one-sided Fisher’s exact test. Figures 1B and 1C also show gains and losses observed in 25×2 clones for all 46 patients. As can be seen from the detailed information on these 50 clones listed in Table 4p values (from the one-sided Fisher’s exact test) were below 1.1×10⁻², and the false discovery rate was below 7.9×10⁻². In the entire LOOCV analysis, these 50 clones accounted for 92.5% of the clones used for the classifications.
Table 4A.
Clones with the most significant differences in copy number gains or losses between activated-B-cell and germinal center-B-cell subtypes. A. Top 25 clones with more gains and losses in the activated-B-cell subtype than in the germinal center-B-cell subtype (ABC-specific clones).
Discussion
Genomic alterations including translocations and genomic copy number alterations are important events in lymphomagenesis. We previously showed that MCL, GCB DLBCL, and ABC DLBCL have characteristic genomic alteration patterns.4,6 These findings led us to hypothesize that it might be possible to use array CGH data for the systematic diagnosis and classification of malignant lymphomas. Although each lymphoma entity has a characteristic genomic alteration pattern, patients with the same disease entity have heterogeneous genomic alteration patterns. It was, therefore, important to combine data on genomic alterations at several regions for accurate diagnosis. In this context, heterogeneity in DLBCL was speculated to be a problem, but we were able to develop a computer algorithm for the classification of lymphoma diseases and subtypes on the basis of copy number gains and losses detected by array CGH with high accuracy. Our array CGH-based classification algorithm is similar to one used in a previous study.11 We slightly modified this algorithm to deal with array CGH data as shown in the Online Supplementary Appendix. Many other classification algorithms have been used for cancer classifications on the basis of gene-expression profiling.17–19
Several studies8–12 have succeeded in demonstrating the power of gene expression profiling for the classification of lymphoma diseases and subtypes. In addition, genomic analysis has also been shown to be suitable for diagnostic purposes.15,16 As demonstrated in our previous studies, smaller amounts of DNA can be used for analysis without amplification procedures.2–7 Furthermore, greater stability and easier availability of DNA in comparison with RNA could be expected to make array CGH more reliable for diagnostic purposes. When we applied our method to the classification of different lymphoma entities (DLBCL and MCL) as well as different subtypes (ABC and GCB), the results showed that copy number gains and losses at a few dozen clones were effective for differentiating between disease entities as well as DLBCL subtypes. This study demonstrates that only a small subset of clones is required for a highly accurate classification.
Table 3B.
Top 25 clones with more gains and losses in mantle cell lymphoma than in diffuse large B-cell lymphoma (MCL-specific clones).
The concordance between the ABC and GCB classification made by means of the hierarchical clustering method and classifier method described by Wright et al. was 91.3% (Online Supplementary Figure S1). The 83% accuracy achieved using array CGH data can, therefore, be assumed to be high. It remains to be determined which method of expression profiling classification is suitable for array CGH data classification.
The list of clones used for the classification of DLBCL and MCL diseases is provided in Table 3. The first 25 clones showed more frequent gains and losses in DLBCL than in MCL, and we designated them as DLBCL-specific clones. The other 25 clones showed more frequent gains and losses in MCL than in DLBCL, and are designated as MCL-specific clones. Among the top 25 MCL-specific clones, seven were in the 11q22 region, one of which was BAC RP11-241D13, which contains the ATM gene. It is known that the ATM gene is a tumor suppressor and that the inactivation of this gene does not activate DNA repair mechanisms properly.20,21 Gene mutations and loss of heterogeneity have been identified in 56% of MCL.21 However, neither loss of heterogeneity nor deletion of 11q22 was observed in DLBCL, according to a previous report.6 The loss of 11q22 may, therefore, be strongly associated with the pathogenesis of MCL, while the presence or absence of this gene is also important for discriminating DLBCL and MCL.
The list of clones used for the classification of ABC and GCB subtypes is supplied in Table 4. The first 25 clones showed more frequent gains and losses in the ABC subtype than in the GCB subtype, and we designated them as ABC-specific clones. The other 25 clones showed more frequent gains and losses in the GCB subtype than in the ABC one, and we designated them as GCB-specific clones. The BCL2 and MALT1 genes were selected as ABC-specific clones. MALT1 gene gain was previously suggested to play an important role in DLBCL.22 Dierlamm et al. recently reported that the gain of 18q/MALT1 is associated with the ABC subtype of DLBCL.23 The fact that there are two ABC cases in the present study showing MALT1 gains without any BCL2 gain could indicate that MALT1 may be the gene implicated in this region in the ABC subtype of DLBCL. Several clones at 3q25-qter were selected as ABC-specific in the present study. This is in accordance with the report by Bea et al., who revealed that 65% of cases with 3q27 had 18q21–q22 gains among ABC subtype DLBCL.24 These findings demonstrated that DLBCL subtyping by means of expression profiling is based on genomic alterations. The differential diagnosis of DLBCL and MCL by means of array CGH is less important because immunohistological markers for MCL, such as cyclin D1, already exist, although some cases of MCL can be misdiagnosed if the cyclin D1 does not stain clearly. More importantly, the clones selected with the algorithm used in our study are clearly associated with regions that are known to be characteristic to disease entities.
These include the 11q22 and 9q34.3 regions for MCL21,25,26 and 18q21 and 19q13 for DLBCL.6 Deletion of 9q34 has been reported to be a predictor of poor survival in patients with MCL.25,26 This seems to suggest that selected markers may play an important role in the pathogenesis and/or clinicopathological features of the various lymphoma entities. As some of the genetically altered areas have not yet been fully characterized at the molecular level, it is important to recognize that critical genes involved in disease development and progression still remain to be discovered.
Table 4B.
Top 25 clones with more gains and losses in the germinal center-B-cell subtype than in the activated-B-cell subtype (GCB-specific clones).
Although it is important to identify such responsible genes, the identification of characteristic regions by means of a computer algorithm may be much more important than successful differential diagnosis based on array CGH data.
In summary, the results of our study show that genomic copy number gains and losses, detected by array CGH, can be used for the accurate diagnosis of different malignant lymphoma diseases and their subtypes. It was further demonstrated that copy number imbalances in only a few dozen clones differentiate different diseases and subtypes. Some clones used for the classification contained genes known to be strongly associated with tumor pathogenesis. This indicates that new target genes may be identified by using the classification procedure presented here.
Supplementary Material
Footnotes
The online version of this article contains a supplementary appendix.
Authorship and Disclosures:
IT: designed and performed the data analysis and wrote the paper; HT: performed experiments on array CGH and wrote the paper; AT: contributed to application of the software for data analysis; MK-S: performed the gene-expression profiling experiments; YG: contributed to the pathological review and wrote the paper. MS: organized the research and wrote the paper. The authors reported no potential conflicts of interest.
References
- 1.Jaffe ES, Harris NL, Stein H, Vardiman JW. World Health Organization classification of tumors: pathology and genetics of tumors of hematopoietic and lymphoid tissues. IARC Press; Lyon, France: 2001. [Google Scholar]
- 2.Ota A, Tagawa H, Karnan S, Tsuzuki S, Karpas A, Kira S, et al. I dentification and characterization of a novel gene, C13orf25, as a target for 13q31–q32 amplification in malignant lymphoma. Cancer Res. 2004;64:3087–95. doi: 10.1158/0008-5472.can-03-3773. [DOI] [PubMed] [Google Scholar]
- 3.Tagawa H, Tsuzuki S, Suzuki R, Karnan S, Ota A, Kameoka Y, et al. Genome-wide array-based comparative genomic hybridization of diffuse large-B-cell lymphoma: comparison between CD5-positive and CD5-negative cases. Cancer Res. 2004;64:5948–55. doi: 10.1158/0008-5472.CAN-03-4056. [DOI] [PubMed] [Google Scholar]
- 4.Tagawa H, Karnan S, Suzuki R, Matsuo K, Zhang X, Ota A, et al. Genome-wide array-based CGH for mantle cell lymphoma: identification of homozygous deletions of the proapoptotic gene BIM. Oncogene. 2005;24:1348–58. doi: 10.1038/sj.onc.1208300. [DOI] [PubMed] [Google Scholar]
- 5.Nakashima Y, Tagawa H, Suzuki R, Karnan S, Karube K, Ohshima K, et al. Genome-wide array-based comparative genomic hybridization of natural killer cell lymphoma/leukemia: different genomic alteration patterns of aggressive NK-cell leukemia and extranodal NK/T-cell lymphoma, nasal type. Genes Chromosomes Cancer. 2005;44:247–55. doi: 10.1002/gcc.20245. [DOI] [PubMed] [Google Scholar]
- 6.Tagawa H, Suguro M, Tsuzuki S, Matsuo K, Karnan S, Ohshima K, et al. Comparison of genome profiles for identification of distinct subgroups of diffuse large B-cell lymphoma. Blood. 2005;106:1770–7. doi: 10.1182/blood-2005-02-0542. [DOI] [PubMed] [Google Scholar]
- 7.Oshiro A, Tagawa H, Ohshima K, Karube K, Uike N, Tashiro Y, et al. Identification of subtype-specific genomic alterations in aggressive adult T-cell leukemia/lymphoma. Blood. 2006;107:4500–7. doi: 10.1182/blood-2005-09-3801. [DOI] [PubMed] [Google Scholar]
- 8.Alizadeh AA, Eisen MB, Davis RE, Ma C, Lossos IS, Rosenwald A, et al. Distinct types of diffuse large B-cell lymphoma identified by gene expression profiling. Nature. 2000;403:503–11. doi: 10.1038/35000501. [DOI] [PubMed] [Google Scholar]
- 9.Rosenwald A, Wright G, Chan WC, Connors JM, Campo E, Fisher RI, et al. The use of molecular profiling to predict survival after chemotherapy for diffuse large-B-cell lymphoma. N Engl J Med. 2002;346:1937–47. doi: 10.1056/NEJMoa012914. [DOI] [PubMed] [Google Scholar]
- 10.Rosenwald A, Wright G, Wiestner A, Chan WC, Connors JM, Campo E, et al. The proliferation gene expression signature is a quantitative integrator of oncogenic events that predics survival in mantle cell lymphoma. Cancer Cell. 2003;3:185–97. doi: 10.1016/s1535-6108(03)00028-x. [DOI] [PubMed] [Google Scholar]
- 11.Wright G, Tan B, Rosenwald A, Hurt EH, Wiestner A, Staudt LM. A gene expression-based method to diagnose clinically distinct subgroups of diffuse large B-cell lymphoma. Proc Natl Acad Sci USA. 2003;100:9991–6. doi: 10.1073/pnas.1732008100. [DOI] [PMC free article] [PubMed] [Google Scholar]
- 12.Dave SS, Fu K, Wright GW, Lam LT, Kluin P, Boerma EJ, et al. Molecular diagnosis of Burkitt’s lymphoma. N Engl J Med. 2006;354:2431–42. doi: 10.1056/NEJMoa055759. [DOI] [PubMed] [Google Scholar]
- 13.Fukuhara N, Nakamura T, Nakagawa M, Tagawa H, Takeuchi I, Yatabe Y, et al. Chromosomal imbalances are associated with outcome of Helicobacter pylori eradication in t(11;18)(q21;q21) negative gastric mucosa-associated lymphoid tissue lymphomas. Genes Chromosomes Cancer. 2007;46:784–90. doi: 10.1002/gcc.20464. [DOI] [PubMed] [Google Scholar]
- 14.Ransohoff DF. Rules of evidence for cancer molecular-marker discovery and validation. Nat Rev Cancer. 2004;4:309–14. doi: 10.1038/nrc1322. [DOI] [PubMed] [Google Scholar]
- 15.Wilhelm M, Veltman JA, Olshen AB, Jain AN, Moore DH, Presti JC, Jr, et al. Array-based comparative genomic hybridization for the differential diagnosis of renal cell cancer. Cancer Res. 2002;62:957–60. [PubMed] [Google Scholar]
- 16.Veltman JA, Fridlyand J, Pejavar S, Olshen AB, Korkola JE, DeVries S, et al. Array-based comparative genomic hybridization for genome-wide screening of DNA copy number in bladder tumors. Cancer Res. 2003;63:2872–80. [PubMed] [Google Scholar]
- 17.Golub TR, Slonim DK, Tamayo P, Huard C, Gaasenbeek M, Mesirov JP, et al. Molecular classification of cancer: class discovery and class prediction by gene expression monitoring. Science. 1999;286:531–7. doi: 10.1126/science.286.5439.531. [DOI] [PubMed] [Google Scholar]
- 18.Ramaswamy S, Tamayo P, Rifkin R, Mukherjee S, Yeang CH, Angelo M, et al. Multiclass cancer diagnosis using tumor gene expression signatures. Proc Natl Acad Sci USA. 2001;98:15149–54. doi: 10.1073/pnas.211566398. [DOI] [PMC free article] [PubMed] [Google Scholar]
- 19.Dudoint S, Fridlyand J, Speed TP. Comparison of discrimination methods for the classification of tumors using gene expression data. J Am Stat Assoc. 2002;97:77–87. [Google Scholar]
- 20.Jares P, Colomer D, Campo E. Genetic and molecular pathogenesis of mantle cell lymphoma: perspectives for new targeted therapeutics. Nat Rev Cancer. 2007;7:750–62. doi: 10.1038/nrc2230. [DOI] [PubMed] [Google Scholar]
- 21.Greiner TC, Dasgupta C, Ho VV, Weisenburger DD, Smith LM, Lynch JC, et al. Mutation and genomic deletion status of ataxia telangiectasia mutated (ATM) and p53 confer specific gene expression profiles in mantle cell lymphoma. Proc Natl Acad Sci USA. 2006;103:2352–7. doi: 10.1073/pnas.0510441103. [DOI] [PMC free article] [PubMed] [Google Scholar]
- 22.Sanchez-Izquierdo D, Buchonnet G, Siebert R, Gascoyne RD, Climent J, Karran L, et al. MALT1 is deregulated by both chromosomal translocation and amplification in B-cell non-Hodgkin lymphoma. Blood. 2003;101:4539–46. doi: 10.1182/blood-2002-10-3236. [DOI] [PubMed] [Google Scholar]
- 23.Dierlamm J, Murga Penas EM, Bentink S, Wessendorf S, Berger H, Hummel M, et al. Gain of chromosome region 18q21 including the MALT1 gene is associated with the activated B-cell-like gene expression subtype and increased BCL2 gene dosage and protein expression in diffuse large B-cell lymphoma. Haematologica. 2008;93:688–96. doi: 10.3324/haematol.12057. [DOI] [PubMed] [Google Scholar]
- 24.Bea S, Zettl A, Wright G, Salaverria I, Jehn P, Moreno V, et al. Diffuse large B-cell lymphoma subgroups have distinct genetic profiles that influence tumor biology and improve gene-expression-based survival prediction. Blood. 2005;106:3183–90. doi: 10.1182/blood-2005-04-1399. [DOI] [PMC free article] [PubMed] [Google Scholar]
- 25.Salaverria I, Zettl A, Beà S, Moreno V, Valls J, Hartmann E, et al. Specific secondary genetic alterations in mantle cell lymphoma provide prognostic information independent of the gene expression–based proliferation signature. J Clin Oncol. 2007;25:1216–22. doi: 10.1200/JCO.2006.08.4251. [DOI] [PMC free article] [PubMed] [Google Scholar]
- 26.Rubio-Moscardo F, Climent J, Siebert R, Piris MA, Martín-Subero JI, Nieländer I, et al. Mantle-cell lymphoma genotypes identified with CGH to BAC microarrays define a leukemic subgroup of disease and predict patient outcome. Blood. 2005;105:4445–54. doi: 10.1182/blood-2004-10-3907. [DOI] [PubMed] [Google Scholar]
Associated Data
This section collects any data citations, data availability statements, or supplementary materials included in this article.


