

Abstract
High malignancy and early metastasis are hallmarks of melanoma. Here, we report that the transcription factor Snail1 inhibits expression of the tumor suppressor CYLD in melanoma. As a direct consequence of CYLD repression, the protooncogene BCL-3 translocates into the nucleus and activates Cyclin D1 and N-cadherin promoters, resulting in proliferation and invasion of melanoma cells. Rescue of CYLD expression in melanoma cells reduced proliferation and invasion in vitro and tumor growth and metastasis in vivo. Analysis of a tissue microarray with primary melanomas from patients revealed an inverse correlation of Snail1 induction and loss of CYLD expression. Importantly, tumor thickness and progression-free and overall survival inversely correlated with CYLD expression. Our data suggest that Snail1-mediated suppression of CYLD plays a key role in melanoma malignancy.
Melanoma is the most aggressive form of skin cancer. Invasion of melanoma cells into the dermis and subsequent metastatic dissemination are hallmarks of melanoma progression (1). One of the earliest steps in melanoma development includes disruption of E-cadherin–mediated adhesive interactions between melanocytes and keratinocytes (2). This disruption is accompanied by increased expression of N-cadherin, which facilitates cluster formation and invasion of melanoma into the dermis (3–5).
The Snail1 transcription factors trigger epithelial-mesenchymal transition (EMT) and have been shown to be important markers for tumor progression and invasion (6–8). Although EMT was originally defined as the formation of mesenchymal cells with migratory and invasive properties from epithelia during development, there is also evidence that EMT plays a crucial role in tumor progression and metastasis (9). Snail1-induced EMT has been mainly attributed to the direct repression of E-cadherin transcription (for review see references [10, 11]). We have previously shown that Snail1 is highly up-regulated in melanoma cells (12). The signals responsible for Snail1 up-regulation in melanoma are unclear, although several mechanisms for the regulation of Snail1 expression in other cell types have been put forward. For example, in epithelial cells, Snail1 expression can be induced by TGF-β, oncogenic Ras, or integrin-linked kinase (13–15).
CYLD was originally identified as a tumor suppressor that is mutated in familial cylindromatosis (Brooke-Spiegler syndrome), an autosomal-dominant predisposition to multiple tumors of skin appendages (16). CYLD contains a C-terminal ubiquitin C-terminal hydrolase domain, which enables it to act as a deubiquitination enzyme (17–19). CYLD was shown to remove ubiquitin chains from target proteins such as BCL-3, resulting in inhibition of nuclear translocation of BCL-3, association with NF-κB p50 and p52, and cell proliferation (20).
In this study, we identified a signaling pathway that promotes mitogenic and metastatic properties of melanoma by down-regulation of CYLD through the action of Snail1, whose expression is induced by BRAF-mediated activation of extracellular signal–regulated kinase (ERK). Snail1-dependent inhibition of CYLD transcription results in stimulation of Cyclin D1 and N-cadherin expression in melanoma cells, leading to enhanced proliferation, migration, and invasiveness of melanoma cells in vitro, as well as tumor growth and metastasis in vivo. Importantly, in melanoma tissue, Snail1 induction correlated with the loss of CYLD expression, and both were linked to Clark level (tumor invasiveness) and tumor thickness. Increased Snail1 expression and reduced CLYD levels inversely correlated with progression-free and overall survival of patients. Together, these data suggest that Snail1-mediated suppression of CYLD plays a key role in melanoma malignancy and that CLYD represents a prognostic marker and potential therapeutic target of this highly aggressive tumor.
RESULTS
CYLD expression is down-regulated in melanoma
To get a first insight into the role of CYLD in malignant melanoma, we evaluated-CYLD expression in six different human melanoma cell lines, as well as in freshly isolated human melanoma cells. We found strong reduction of CYLD mRNA (Fig. 1 A) and protein (Fig. 1 B) levels when compared with normal human epidermal melanocytes (NHEMs). Also, in situ, primary melanomas and melanoma metastases displayed strongly down-regulated or absent CYLD mRNA (Fig. 1 C) and protein (Fig. 1 D). In contrast, melanocytes in normal epidermis displayed high CYLD expression, as confirmed by costaining for tyrosinase and CYLD and quantification of costaining (Fig. 1, E and F). Because mutations and promoter methylation of the CYLD gene could be excluded (unpublished data), we concluded that down-regulation of CYLD likely occurs at the transcriptional level.
Figure 1.

Reduced CYLD expression in malignant melanoma. Quantitative RT-PCR (A) and immunoblot analysis (B) showing CYLD expression in six human melanoma cell lines (Mel Im, Mel Juso, Mel Ei, Mel Ju, Mel Ho, and Mel Wei) and freshly isolated primary melanoma cells from two donors (MM1 and MM2) compared with NHEMs. (C) CYLD mRNA expression in NHEMs, primary melanomas (PT), and metastases of lymph nodes (LN), sentinel lymph nodes (SLN), and two distant metastases of malignant melanomas (M). Experiments in A–C were repeated at least three times. Data are the mean ± SEM. (D) Immunohistochemistry showing strong down-regulation or loss of CYLD (red staining) in primary malignant melanoma (indicated by arrows; I) and in melanoma metastasis (II). In III, CYLD staining in normal skin is presented. Strong CYLD staining is shown in keratinocytes in normal epidermis (I, III), which is indicated by *. For counterstaining, hematoxylin was used. Experiments were performed four times independently. (E) CYLD immunoreactivity of normal skin showing CYLD staining (green) and tyrosinase-marked melanocytes (red; Ia and Ib). Higher magnification images (II) indicate a melanocyte displaying expression of both proteins. Experiments were performed three times independently. (F) Quantification of CYLD and tyrosinase costaining in epidermal melanocytes. Fraction of tyrosinase-expressing cells (melanocytes) that are expressing CYLD at low, moderate, or high levels (Tyrosinase/CYLD). Bars: (D) 100 μm; (E, Ia and Ib) 100 μm; (E, II) 5 μm.
Snail1 affects transcriptional expression of CYLD in melanoma cells
Analysis of the CYLD promoter revealed three potential binding sites for the transcriptional repressor Snail1 (Fig. S1, available at http://www.jem.org/cgi/content/full/jem.20082044/DC1). We found that Snail1 messenger RNA (mRNA) was highly increased in melanoma cell lines compared with NHEM, an expression pattern that correlated inversely with CYLD (Fig. S2 A vs. Fig. 1 A). In contrast, expression of Snail2 (Snai2), a Snail1 homologue that has been shown to affect expression of several genes important for melanoma progression (21), in melanoma was similar or lower than in NHEM (Fig. S2 A).
Chromatin immunoprecipitation (ChIP) assays demonstrated Snail1 binding to the CYLD promoter in primary melanoma cells and the melanoma cell lines Mel Im and Mel Juso, but not in NHEM (Fig. 2 A). Furthermore, neither Snail2 nor Twist (another E-box binding factor associated with poor prognosis in melanoma [22]) bound to the CYLD promoter in ChIP assays (Fig. 2 A). Snail1 recruitment to the CYLD promoter was observed to the first E-box at position −19 to −14, which resembles the consensus Snail1 binding sequence (CAGGTG; Fig. S1), but not to E-box II (-382 to -377) or III (−429 to −424; unpublished data).
Figure 2.

Snail1 inhibits transcriptional expression of CYLD in melanocytic cells. (A) Lysates from NHEMs, primary melanoma cells (MM1 and MM2), and melanoma cell lines (Mel Im, Mel Juso) were examined by ChIP assay using an anti-Snail1, anti-Twist, and anti-Snail2–specific antibody, respectively, as well as a PCR primer pair corresponding to the promoter of the CYLD gene. Recruitment to the CYLD promoter was only shown for Snail1. Snail1, Twist, Snail2, immunoprecipitation (IP) using specific antibodies; IgG, IP using negative control rabbit immunoglobulin; Input, 10% of the cell lysate used for the IP is shown. (B) Reporter assays revealing inducible CYLD promoter (−550 to −1 bp) activity in Mel Im cells after transient transfection with asSnail (asSnail), whereas transfection with Snail1 expression plasmid (Snail1) completely abrogated CYLD promoter activity compared with the control (pGL3). Mutation of the consensus Snail1 binding site (CYLD mut-19) led to strong promoter activity that was not affected by transfection with asSnail or Snail1. Data are given as mean ± SEM. *, P < 0.05 compared with CYLD control. (C) Immunoblot analysis showing that CYLD protein is up-regulated in Mel Im cells after stable transfection with asSnail expression plasmids (clone 1 and clone 2; top) and after transient transduction with Snail1 siRNA nucleotides (siRNA Snail1) or scrambled siRNA control (siRNA control; bottom). Nontransduced Mel Im cells were used as control. (D) Quantitative RT-PCR analysis showing increased CYLD mRNA expression in three different melanoma cell lines (Mel Im, Mel Ei, and Mel Juso) and melanoma cells (MM1 and MM2) transiently transfected with asSnail expression plasmids compared with mock-transfected (pcDNA3) cells. Data are given as mean ± SEM. *, P < 0.05. (E) Western blot analysis showing decreased CYLD protein expression in NHEM cells transiently transfected with Snail1 expression plasmids compared with mock-transfected (pcDNA3) or nontransfected (NHEM) cells. (F) ERK inhibition by treatment with MEK inhibitors PD98059 and UO126 significantly affects Snail1 and CYLD mRNA expression in Mel Im cells. JNK inhibition (SP600125) exhibits no effect compared with vehicle (DMSO) control. Data are given as mean ± SEM. *, P < 0.05. ns, not significant, both compared with Control. (G) Quantitative RT-PCR revealing that inhibition of ERK by PD98059 or UO126 further induced CYLD expression in melanocytes. JNK inhibition (SP600125) exhibits no effect compared with vehicle (DMSO) control. Data are given as mean ± SEM. *, P < 0.05. Experiments in A–G were repeated at least three times. (H) Detection of CYLD expression by Western blot analysis. Transfection of NHEMs with mutated BRAF (V600E) induced Snail1 protein expression and, consequently, CYLD protein suppression, whereas no changes were found after transfection of wild-type BRAF (wtBRAF). Experiments were repeated three times with cells from two different donors.
Reporter gene assays using the CYLD promoter (−550 to −1) revealed inducible activity in melanoma cells after transient transfection with an antisense Snail1 construct (as-Snail). Conversely, transient transfection of a Snail1 expression construct completely repressed CYLD promoter activity (Fig. 2 B). Mutation of the first E-box of the CYLD promoter at position −19 resulted in strong promoter activity in Mel Im cells, which was not affected by transient transfection with asSnail or Snail1 (Fig. 2 B). In contrast, mutations in E-box II or III of the CYLD promoter did not change the reporter activity (unpublished data).
These data indicate that recruitment of Snail1 to the first E-box binding site located in the CYLD promoter suppresses CYLD promoter activity in malignant melanoma.
To further assess the effect of Snail1 on CYLD expression in melanoma cells, we either stably transfected Mel Im cells with asSnail expression plasmids or depleted Snail1 with specific siRNAs, and found a strong up-regulation of CYLD protein (Fig. 2 C). Furthermore, transient expression of as-Snail expression plasmids was sufficient to induce CYLD expression in melanoma cell lines and primary human melanoma cells (Fig. 2 D and Fig. S2 B). Accordingly, transient transfection of NHEM with a Snail1 expression plasmid strongly inhibited CYLD expression (Fig. 2 E).
BRAF-mediated ERK activation induced Snail1 and down-regulated CYLD in melanoma cells
Snail1 transcription depends on ERK signaling in squamous cell carcinoma and epithelial cells (15, 23), and melanoma cells exhibit high ERK activity compared with NHEMs (24). Interestingly, we found that pharmacological inhibition of the ERK/mitogen-activated protein kinase (MAPK) cascade induced an almost complete loss of Snail1 mRNA expression and significantly increased CYLD mRNA levels in melanoma cells (Fig. 2 F). In accordance, treatment of NHEM with ERK inhibitors to further reduce basal levels of ERK activity also increased expression of CYLD (Fig. 2 G).
As BRAF activity acts upstream of ERK, and V600E mutations of BRAF are common in melanoma development (in accordance to our finding that BRAF mutations are present in all melanoma cell lines used in this study [unpublished data]), we tested whether mutated BRAF can modulate CYLD regulation in NHEM. Transfection of NHEM with V600E BRAF resulted in up-regulation of Snail1 and down-regulation of CYLD expression levels (Fig. 2 H).
Collectively, these data indicate that high Snail1 expression modulated by BRAF-mediated ERK activity is involved in the transcriptional down-regulation of CYLD in melanoma.
Snail1 regulates tumorigenicity in melanoma via CYLD repression
Snail1 has been shown to play an important role in progression of melanoma. To study whether Snail1 facilitates tumorigenicity of melanoma cells via repression of CYLD, the two melanoma asSnail clones (Fig. 2 D) were stably transduced with viral vectors encoding siRNA against CYLD, resulting in complete suppression of CYLD (Fig. 3 A).
Figure 3.

Snail1 regulates tumorigenicity via CYLD repression. (A) Western blot analysis of two Mel Im asSnail clones (clone 1 and clone 2) applying CYLD, Cyclin D1, and N-cadherin antibodies. Stable transduction with viral vectors encoding siRNA against CYLD (siRNA CYLD) results in the complete depletion of CYLD, but induction of Cyclin D1 and N-cadherin in both clones. Transduction with control siRNA (siRNA control) exhibits no effect. Proliferation (B) and migration (C; in monolayer scratch assays) of Mel Im control cells (Control) and Mel Im asSnail clone 1 either stably transduced with viral vectors encoding siRNA against CYLD (siRNA CYLD), control siRNA (siRNA control), or without transduction (asSnail). Data represent proliferation after 72 h, and areas between scratch fronts (after 2 d in monolayer scratch assays) and are given as mean ± SEM. *, P < 0.05. Experiments in A–C were repeated at least three times. (D) Growth of Mel Im asSnail clone 1 (asSnail) transduced with siRNA against CYLD (siRNA CYLD) or control siRNA (siRNA control) and Mel Im control cells (Control) after s.c. implantation into nude mice (106 cells/mouse). Bars represent mean tumor size (± SEM) 3 wk after implantation. *, P < 0.05. (E) Histological analysis of the growths of Mel Im asSnail clone 1 without transduction (I) or stably transduced with siRNA against CYLD (II) 3 wk after s.c. implantation into nude mice. Pictures are representative and arrows indicate diffuse infiltration in II, whereas nodular growth (*) appears in I. Bar, 200 μm. Experiments and analysis in D and E, respectively, have been performed with 10 mice/group.
Suppression of Snail1 in Mel Im cells resulted in significantly impaired proliferation (Fig. 3 B, clone 1; Fig. S3 A, clone 2, available at http://www.jem.org/cgi/content/full/jem.20082044/DC1) and migration rates (Fig. 3 C, clone 1; Fig. S3 B, clone 2) compared with control cells. siRNA-mediated depletion of CYLD almost completely rescued the proliferative and migratory potential of Snail1-depleted melanoma cells (Fig. 3, B and C, and Fig. S3, A and B).
To assess the relevance of Snail1-mediated tumor progression in vivo, we used a xenograft tumor model. Mel Im asSnail clones formed significantly smaller tumors than Mel Im control cells when injected subcutaneously into nude mice. In contrast, CYLD siRNA reconstituted the diminished growth of Mel Im antisense Snail1 clones (Fig. 3 D). Histological analysis of tumors formed by Mel Im asSnail clones in nude mice revealed nodular growth (Fig. 3, E, I). In contrast, Mel Im asSnail clones transduced with siRNA against CYLD showed more diffuse infiltration of the surrounding tissue (Fig. 3, E, II).
These findings indicate that CYLD plays an important role in Snail1-mediated progression of melanoma.
CYLD regulates N-cadherin and Cyclin D1 expression via BCL-3 in melanoma
We have shown in a previous study that BCL-3 associates with the NF-κB p50 or p52 subunits to enhance cell proliferation by activating the Cyclin D1 promoter in mouse keratinocytes (17). CYLD prevents nuclear accumulation of BCL-3 and hence reduces Cyclin D1 expression and proliferation of keratinocytes.
Next, we examined whether a similar mechanism operates in human melanoma cells. In contrast to NHEM, BCL-3 was primarily found in the nucleus of the melanoma cell lines (Fig. S4 A, available at http://www.jem.org/cgi/content/full/jem.20082044/DC1). Transduction with lentiviral vectors expressing CYLD prevented nuclear translocation of BCL-3 (Figs. S4, B and C), whereas a catalytically inactive mutant of CYLD (CYLD C/S) still binding to BCL-3 was unable to prevent nuclear translocation (Fig. S4, C and D).
To analyze whether CYLD is also regulating Cyclin D1 expression in melanoma cell lines, Mel Im and Mel Juso cells were transduced with viral vectors carrying CYLD. Clones expressing CYLD at similar levels as NHEMs were used as demonstrated by Western blot analysis (Fig. 4 A). In agreement with the mechanism in keratinocytes (17), CYLD markedly reduced expression of Cyclin D1 (Fig. 4 B), cyclin D1 promoter activity (Fig. 4 C), and BCL-3 recruitment to the cyclin D1 promoter in a complex with p50 or p52 (Fig. 4 D, left) as compared with cells transduced with viral vectors carrying a catalytically inactive mutant of CYLD (C/S-CYLD), a GFP expression cassette or noninfected cells.
Figure 4.

CYLD regulates N-cadherin and Cyclin D1 expression via BCL-3 in melanoma. (A) Western blot analysis revealing CYLD expression in NHEMs and Mel Im and Mel Juso cells stably transduced with CYLD, but not in melanoma cells stably transduced with GFP. Actin labeling is used as loading control. (B) Western blot detecting Cyclin D1 expression in Mel Im cells stably transduced with CYLD, but not in nontransduced control cells or cells stably transduced with GFP. Tubulin labeling is used as loading control. (C) Effect of transfection of a CYLD expression vector carrying wild-type (CYLD) or mutated CYLD (CYLD C/S) on Cyclin D1 promoter activity in Mel Im cells. Data are given as mean ± SEM. *, P < 0.05 versus pcDNA3 empty vector used as control. (D) Lysates from Mel Im cells (Control) and CYLD, mutant CYLD (CYLD C/S), or GFP stably expressing Mel Im cells were examined by ChIP assay using specific polyclonal antibodies against BCL-3, p50, or p52, and PCR primer pairs corresponding to the promoter of the CyclinD1 or N-cadherin gene to analyze recruitment of BCL-3 to the Cyclin D1 and N-cadherin promoter. BCL-3, p50, and p52 immunoprecipitation (IP) using polyclonal antibodies as indicated. IgG, negative control rabbit IgG (DAKO); Input, 10% of the cell lysate used for the IP is shown. (E) Effect of transduction of a CYLD expression vector carrying wild-type (CYLD) or a catalytic inactive mutant of CYLD (CYLD C/S) on N-cadherin promoter activity in Mel Im cells. Data are given as mean ± SEM. *, P < 0.05 versus pcDNA3 empty vector used as control. (F) Western blot analysis of CYLD, Snail1, Snail2, Twist, E-cadherin, N-cadherin, and Actin expression in nontransduced Mel Im cells (Control) or Mel Im cells transduced with GFP or CYLD. (G) Western blot analysis of BCL-3, Cyclin D1, N-cadherin, Snail1, and Actin expression in nontransduced Mel Im and Mel Juso cells (Control), cells transduced with the BCL-3 siRNA nucleotides (siRNA BCL-3), or scrambled siRNA control (siRNA control). (H) Western blot analysis of Snail1, CYLD, (nuclear) BCL-3, and Actin expression in nontransduced Mel Im cells (Control), and cells transduced with Snail1 siRNA nucleotides (siRNA Snail1) or scrambled siRNA control (siRNA control). Experiments in A–H were repeated at least three times.
Because melanoma cells with BRAF V600E mutation exhibit an increased production of the immunosuppressive IL-10 (25), and the production of IL-10 is reduced in BCL-3–null cells (26), we further analyzed BCL-3 binding to the IL-10 promoter. CYLD, but not C/S-CYLD, abrogated BCL-3 binding of IL-10 promoter, confirming the important role of CYLD in the regulation of BCL-3 (Fig. S4 E).
In addition to uncontrolled proliferation, malignant melanoma is characterized by early invasiveness and metastasis. One of the hallmarks of the increased migratory and invasive potential of malignant melanoma cells is the expression of N-cadherin (2–4). Interestingly, the N-cadherin gene contains NF-κB binding sites in its promoter region (27). ChIP analysis revealed DNA-bound BCL-3 in a complex with p50 or p52 in control cells, and CYLD C/S– or GFP-expressing cells, whereas CYLD-expressing cells showed no BCL-3 recruitment to the NF-κB binding sites of the N-cadherin promoter (Fig. 4 D, right).
In line with these findings, expression of CYLD in melanoma cells strongly reduced N-cadherin promoter activity (Fig. 4 E) and protein levels (Fig. 4 F), whereas no effects on Snail1, Snail2, Twist, or E-cadherin expression (Fig. 4 F) were found compared with GFP- or CYLD C/S–transduced controls, respectively. In agreement, down-regulation of CYLD in asSnail clones 1 and 2 resulted in up-regulation of Cyclin D1 and N-cadherin (Fig. 3 A).
Depletion of BCL-3 expression in melanoma cells using siRNA resulted in reduced expression of both N-cadherin and Cyclin D1 without changes in Snail1 expression levels (Fig. 4 G). Furthermore, siRNA against Snail1, which up-regulated CYLD expression (Fig. 4 H), reduced nuclear BCL-3 levels, confirming that reexpression of CYLD blocks nuclear translocation of BCL-3 in melanoma (Fig. 4 H).
These results suggest that BCL-3–induced cyclin D1 and N-cadherin expression is blocked by the expression of CYLD.
CYLD regulates proliferation and N-cadherin–mediated migration and invasion in melanoma
To investigate the functional role of the suppressive effect of CYLD on Cyclin D1 and N-cadherin, we used the two different melanoma cell lines (Mel Im and Mel Juso) stably expressing CYLD (Fig. 4 A). CYLD expression caused diminished proliferation in Mel Im cells (Fig. 5 A) and Mel Juso cells (Fig. S5 A, available at http://www.jem.org/cgi/content/full/jem.20082044/DC1), as well as a decrease in colony growth in soft agar in both cell lines (Fig. 5 B and Fig. S5 B) compared with control, GFP, or CYLD C/S–infected cells.
Figure 5.

CYLD regulates proliferation and N-cadherin–mediated migration and invasion. (A) Proliferation of Mel Im cells expressing CYLD, CYLD C/S, or GFP versus the parental Mel Im cell line (Control) after 72 h. Data are given as mean ± SEM. *, P < 0.05. (B) Colony formation in soft agar 3 wk after plating 104 Mel Im cells expressing CYLD, CYLD C/S, or GFP versus the parental (Control) cell line. (C) Migration of melanoma cells in monolayer scratch assays. Mel Im cells transduced with lentiviral vectors carrying CYLD, CYLD C/S, or GFP and noninfected control cells (Control) were used. Representative pictures (at day 0–2) and calculation (mean ± SEM; *, P < 0.05) of the areas between scratch fronts (after 2 d). (D) Migration of Mel Im cells (Control) compared with CYLD, CYLD C/S, or GFP stably transduced cells in spheroid migration assays. Data are given as mean ± SEM. *, P < 0.05. (E) Invasion of Mel Im (Control) cells compared with CYLD, CYLD C/S, or GFP stably transduced cells (after 24 h) in Boyden chamber assays. Data are given as mean ± SEM. *, P < 0.05 compared with Control and GFP. (F) Migration of melanoma cells in Boyden chamber assays. Comparison of Mel Im cells stably transduced with CYLD, CYLD C/S or GFP, and transiently cotransfected with an N-cadherin expression vector (+N-cadherin) or control vector (+pCMX). Data are given as mean ± SEM. *, P < 0.05. (G) Migration of melanoma cells in monolayer scratch assays. Comparison of nontransduced Mel Im cells (Control), cells transfected with BCL-3 siRNA nucleotides (siRNA BCL-3), or scrambled siRNA control (siRNA Control). Data are given as mean ± SEM. *, P < 0.05 compared with Control or siRNA control. Experiments in A–G were repeated at least three times.
Analysis of the motile and invasive phenotype of CYLD-expressing melanoma cells revealed that CYLD expression resulted in diminished migration and invasion rates as assessed in time-lapse scratch assays (Fig. 5 C and Fig. S5 C), spheroid migration assays (Fig. 5 D and Fig. S5 D), and Boyden chamber assays (Fig. 5 E and Fig. S5 E).
In contrast, forced expression of N-cadherin reversed the CYLD-mediated reduction in melanoma cell migration (Fig. 5 F and Fig. S5 F), and depletion of BCL-3 expression resulted in diminished migration rates (Fig. 5 G and Fig. S5 G).
These data indicate that CYLD regulates proliferation, as well as migration and invasion, of melanoma by controlling N-cadherin expression.
CYLD inhibits proliferation and metastasis of melanoma cells in vivo
To test the effect of CYLD on tumor growth in vivo, we used a murine xenograft model. Mel Im cells stably expressing CYLD were injected subcutaneously into nude mice, revealing significantly impaired growth compared with cells stably expressing GFP or noninfected cells (Fig. 6 A). Similar results were obtained with Mel Juso cells (Fig. S6 A, available at http://www.jem.org/cgi/content/full/jem.20082044/DC1). 14 d after injection, none of the mice from the CYLD group, but 6 out of 10 animals from the GFP and noninfected control groups, developed tumors. After 4 wk, 4 mice from the CYLD group also developed tumors; however, these tumors were significantly smaller (4.3 ± 2.8 vs. 28.6 ± 14.7 mm3 [GFP] and 28.5 ± 10.7 mm3 [noninfected]; Fig. 6 A).
Figure 6.
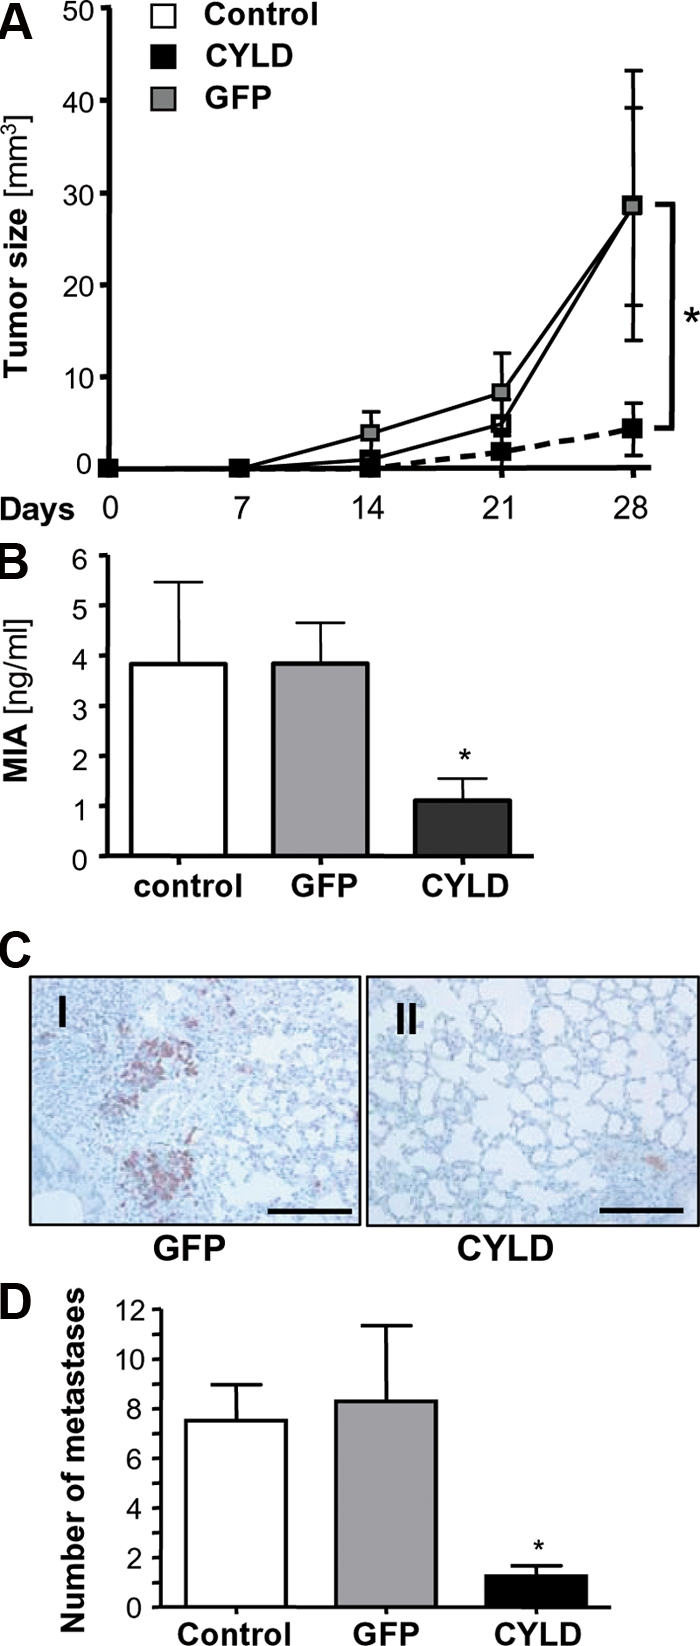
CYLD inhibits proliferation and metastasis of melanoma cells in vivo. (A) Growth kinetic of tumors formed by Mel Im control cells (Control) or cells transduced with viral vectors carrying CYLD or GFP after subcutaneous implantation into nude mice (106 cells/mouse). Data represent mean tumor size (± SEM) at different time points. *, P < 0.05 versus both GFP and Control. (B) MIA serum levels in nude mice after i.v. injection of Mel Im control cells (Control) or cells transduced with viral vectors carrying CYLD or GFP (106 cells/mouse; 8–10 mice/group). Data represent mean MIA level (± SEM) 4 wk after injection. (*, P < 0.05 versus both GFP and Control). (C) Immunohistochemical MART1 staining of pulmonary tissue 4 wk after inoculation. Photomicrographs showing representative sections of the lung of mice receiving Mel Im cells transduced with CYLD or GFP. Bar, 200 μm. (D) Number of micrometastatic lesions per one representative cross section of the lungs from each mouse. Data are given as mean ± SEM. *, P < 0.05 compared with control and GFP. Experiments and analysis in A–D have been performed with 8–10 mice/group.
In addition, melanoma cells were injected i.v. into nude mice to assess in vivo metastasis. MIA serum levels are an established marker to monitor melanoma metastasis (28), and therefore, an ELISA selectively detecting human MIA was applied to monitor the serum content of MIA in this xenograft model. 4 wk after injection, animals receiving CYLD-expressing melanoma cells had significantly lower MIA serum levels (1.1 ± 0.4 ng/ml) than animals injected with GFP-transduced (3.8 ± 0.8 ng/ml) or nontransduced (3.8 ± 1.6 ng/ml) cells (Fig. 6 B and Fig. S6 B).
We performed immunohistochemical analysis sections using MART 1 and MIA, two tumor-associated antigens, to detect lung metastasis. Mice receiving Mel Im cells stably transduced with CYLD showed almost no MART 1 (Fig. 6 C) or MIA (not depicted) staining compared with mice injected with control cells, indicating that they had significantly less metastatic deposits (Fig. 6 D and Fig. S6 C).
In summary, these data show that reduced CYLD expression induces tumorigenicity of melanoma, and that reexpression of CYLD reduces their tumor growth and metastasis in vivo.
Clinical relevance of Snail1-induced CYLD repression
To analyze the clinical relevance of reduced CYLD expression in melanoma, we performed immunohistochemical analysis of a tissue microarray consisting of 88 primary human melanomas (Fig. 7 E) and found a significant correlation between loss of CYLD expression and Clark level/tumor invasiveness and tumor thickness (Table I). Moreover, loss of CYLD expression inversely correlated with overall (Fig. 7 A) and progression-free survival (Fig. 7 B). In contrast, patients with primary tumors expressing CYLD developed no tractable metastasis in the time period analyzed.
Figure 7.

CYLD expression in melanoma has prognostic implication. Kaplan-Meier curves for overall survival (A) and progression-free survival (B) in melanoma patients with a positive immunosignal for CYLD (CYLD positive) or without detectable CYLD protein expression (CYLD negative). CYLD immunohistochemical staining of primary malignant melanoma tissue was performed using a tissue microarray consisting of 88 cases. Investigation of CYLD protein expression was informative in all specimens. Kaplan-Meier curves for overall survival (C) and progression-free survival (D) in melanoma patients with a positive immunosignal for Snail1 (Snail1 positive) or without detectable Snail1 protein expression (Snail1 negative). Snail1 immunohistochemical staining of primary malignant melanoma tissue was performed using a tissue microarray consisting of 88 cases. Immunohistochemical analysis of Snail1 was informative in 78 samples. (E) Examples of tissues with positive and negative CYLD and Snail1 staining, respectively. Bar, 100 μm. (F) Comparison of CYLD and Snail1 immunoreactivity. An inverse correlation of CYLD and Snail1 staining was observed.
Table I.
CYLD and Snail1 immunoreactivity in relation to clinico-pathological characteristics
| CYLD IHC
|
Snail1 IHC
|
|||||||||
|---|---|---|---|---|---|---|---|---|---|---|
| Variable | Categorization | n analyz. | neg. | weak pos. (score 1+) |
strong pos. (score 2+) |
Pa | n analyz. | neg. | pos. | Pa |
| Primary malignant melanomasb | ||||||||||
| Age at diagnosis | >60 yr | 48 | 25 | 16 | 7 | 0.647 | 43 | 16 | 26 | 1 |
| <60 yr | 40 | 23 | 14 | 3 | 36 | 13 | 23 | |||
| Gender | female | 39 | 20 | 15 | 4 | 0.745 | 34 | 16 | 18 | 0.157 |
| male | 49 | 28 | 15 | 6 | 44 | 13 | 31 | |||
| Clark level | II-III | 20 | 8 | 6 | 6 | 0.018 | 16 | 9 | 7 | 0.145 |
| IV-V | 67 | 39 | 24 | 4 | 61 | 20 | 41 | |||
| Tumor thickness | <1.75 mm | 22 | 11 | 5 | 6 | 0.027 | 17 | 10 | 7 | 0.049 |
| >1.75 mm | 66 | 37 | 25 | 4 | 61 | 19 | 42 | |||
| Growth pattern | NOS | 11 | 5 | 4 | 2 | 0.854 | 8 | 3 | 5 | 0.505 |
| SSM | 38 | 20 | 12 | 6 | 36 | 14 | 22 | |||
| ALM | 6 | 5 | 1 | 0 | 5 | 0 | 5 | |||
| NMM | 30 | 16 | 12 | 2 | 27 | 11 | 16 | |||
| LMM | 3 | 2 | 1 | 0 | 2 | 1 | 1 | |||
CYLD and Snail1 immunohistochemical staining of primary malignant melanoma tissue was performed using a tissue microarray consisting of 88 cases. Investigation of CYLD protein expression was informative in all specimens, and immunohistochemical analysis of Snail1 was informative in 78 samples. NOS, not otherwise specified; SSM, superficial spreading melanoma; ALM, acral lentiginous melanoma; NMM, nodular malignant melanoma; LMM, lentigo malignant melanoma.
Fisher's exact test (two-sided). Significant data are shown is bold.
Only initial and unifocal malignant melanomas were included.
Notably, and in accordance with the Snail1-CYLD connection described here, expression of Snail1 was inversely correlated to CYLD expression in primary tumors (P < 0.001; Fig. 7, E and F). In compliance, Snail1 expression also correlated with tumor thickness (Table I) and overall (Fig. 7 C) and progression-free survival (Fig. 7 D).
These clinical findings support a link between the known tumor promoter Snail1 and its transcriptional target CYLD, indicating an important role for Snail1 to suppress CYLD during progression of melanoma and for CYLD to suppress melanoma cell proliferation and invasion.
DISCUSSION
The currently available adjuvant therapies for human melanoma have only limited effects on overall survival and can have severe side effects (for review see reference [29]). This highlights the strong need for rational, mechanism-based therapies. One approach with great potential for achieving this goal is the identification and targeting of tumor-activated signaling cascades.
Our study uncovers a new key signaling pathway that is responsible for progression of malignant melanoma and is related to poor prognosis in melanoma patients. This novel molecular mechanism is based on the suppression of CYLD expression by the transcriptional regulator, Snail1, driving melanoma cells to an aggressive phenotype (depicted as a model in Fig. 8).
Figure 8.

Model of the regulation of Snail and how Snail affects proliferation, as well as migration and invasion, via suppression of CYLD. In melanoma cells, constitutively high ERK-activity (potentially caused by B-Raf mutations) leads to high Snail1 expression, which in turn causes strong suppression of CYLD. The repression of CYLD allows nuclear translocation of Bcl-3 and recruitment to the NF-κB binding sites of the Cyclin D1 and N-cadherin promoter. Activation of Cyclin D1 and N-cadherin leads to an increased proliferation rate of melanoma cells and contributes to progression and metastasis of tumors.
Notably, our findings reveal a thus far unknown link between Snail1, which plays an important role in EMT and favors tumor progression (9, 11), and CYLD. CYLD was originally identified as a tumor suppressor that is mutated in familial cylindromatosis (16). In melanoma, we did not find mutations of the CYLD gene (unpublished data), but we identified direct recruitment of the transcriptional repressor Snail1 to the CYLD promoter as a molecular mechanism leading to strongly reduced or even absent CYLD expression in all melanoma tissues and cell lines tested. In accordance, melanoma cells in which Snail1 expression was abrogated showed a strong up-regulation of CYLD and reduced growth in vitro and in vivo.
Interestingly, we found that ERK activation is the major upstream signaling mechanism responsible for high constitutive Snail1 expression in malignant melanoma cells, as well as for induced Snail1 expression in normal melanocytes. In melanoma cells, the Ras–Raf–MEK–ERK (MAPK) signaling pathway is constitutively active and exerts key functions in melanoma development and progression (30). Activating mutations in BRAF or N-ras have been identified in most cutaneous melanomas (31), corresponding to our finding that BRAF mutations were present in all melanoma cell lines tested, but not in primary human melanocytes.
In contrast to melanoma cells, melanocytes express CYLD at a high level, exhibit low ERK activity, and lack Snail1 expression. Introducing mutated BRAF into primary melanocytes resulted in increased Snail1 expression and reduced CYLD expression. Our findings indicate that after malignant transformation, constitutively high ERK activity and Snail1 expression allow melanoma cells to permanently exploit transcriptional repression of CYLD and activation of BCL-3 to acquire a more aggressive phenotype.
BRAF V600E mutation has been shown to induce NF-κB activity in human melanoma cell lines via regulation of β-Trcp expression (32), and high NF-κB activity resulting in increased tumorigenesis has been reported in malignant melanoma (32–34). Here, we provide a new mechanism for how mutational activation of B-RAF contributes to both constitutive NF-κB and BCL-3 activity via repression of CYLD.
Loss of CYLD promoted BCL-3 recruitment to the Cyclin D1 promoter. This mechanism plays an important role for the growth of melanoma cells because stable expression of CYLD in melanoma cells reduced tumor growth and metastasis in vivo in a xenograft model. More importantly, we showed for the first time that BCL-3 is recruited to the N-cadherin promoter to activate transcription. Thereby, our study provides a novel paradigm of how CYLD affects N-cadherin expression, which has been shown to correlate with tumor cell motility and invasiveness in several malignancies including melanoma (2, 12, 33). Re-expression of CYLD in melanoma cells with constitutively high Snail1 levels inhibited N-cadherin expression, leading to a reduced migratory and invasive potential in vitro and less pulmonary metastasis in a murine in vivo model. Conversely, depletion of CYLD in Snail1-deficient melanoma cells resulted in highly aggressive melanoma cells with strong proliferative and invasive potential. In summary, these findings clearly demonstrate that suppression of CYLD is a central mechanism in how Snail1 facilitates both growth and metastasis in malignant melanoma. Whether this mechanism operates in other types of cancer has to be tested.
Importantly, the clinical findings further support an important role of the Snail1 CYLD pathway in tumor progression and survival in melanoma patients. Snail1 expression shows significant correlation with loss of CYLD and signs of tumor progression like tumor thickness. Even more important, both Snail1 and CYLD expression in primary tumors directly correlate with progression-free survival and overall survival of the patients.
Hence, elevated expression of Snail1 and reduced expression of CYLD in primary melanoma hint to a high metastatic potential in vivo. Although CYLD levels in primary tumor and melanoma might vary, our findings indicate the intriguing possibility that analysis of CYLD and Snail1 protein expression in the primary tumor may be used as a predictive marker for survival of melanoma patients. Such prognostic risk assessment would have major clinical implications for the appropriate selection of treatment modalities and follow up protocols, or as stratification factor for adjuvant therapy.
Finally, our data also suggest a rationale for strategies to rescue CYLD expression in malignant melanoma as therapeutic approaches for this highly aggressive tumor.
MATERIALS AND METHODS
Cells, cell culture, and mouse models.
The melanoma cell lines Mel Ei, Mel Wei, Mel Ho, and Mel Juso were derived from a primary cutaneous melanoma. Mel Im and Mel Ju were derived from metastases of malignant melanomas (J. Johnson, Ludwig Maximilian University of Munich, Munich, Germany) (35). Furthermore, melanoma cells were freshly isolated from primary human melanomas and used at low passage to confirm key findings obtained with melanoma cell lines. All primary melanoma cells and cell lines used carried the V600E mutation in BRAF. Isolation and culture of primary NHEMs (35) and 5-azacytosine (10 mM) treatment for analysis of promoter methylation were performed as previously described (36).
Melanoma cells and NHEMs were treated with the chemical MAPK inhibitors SP600125 (specific for JNK1, JNK2, and JNK3), PD98059, and UO126 (specific for MEK1 and MEK2; all from Calbiochem) at a concentration of 20 μM for 19 h. The vehicle DMSO alone served as control.
Tumor cell inoculation and measurement of tumor growth in NMRI (nu/nu) mice was performed as previously described (37). For analysis of in vivo metastasis melanoma, cells were injected i.v. (106 cells/mouse). 4 wk after inoculation, lungs were processed for (immuno-)histology, and intrapulmonary metastases were counted for one representative section per mouse using MART 1 (1:100; Novus Biologicals) and MIA (38) staining to determine metastasis. In addition, MIA serum levels were determined using a MIA-ELISA (Roche). Experiments were approved by the Department of Veterinary Affairs of the local Government of Bavaria, District of Oberpfalz Area.
Isolation of tumorous and nontumorous human tissues.
Tissue samples from primary human melanoma, and melanoma metastasis obtained from patients undergoing surgical treatment, were immediately snap frozen and stored at −80°C. Melanoma cells were selectively retrieved from tumor samples with PALM microlaser technology (PALM) under microscopic control.
The tissue microarray was constructed as previously described (39) and contained primary unifocal malignant melanomas. Clinical follow up data from the Central Tumor Registry were available for all patients. The median follow up for all patients was 54 mo (range 1–135 mo). The University of Regensburg Institutional Review Board granted approval for the project.
Expression analysis.
Isolation of total cellular RNA from cultured cells and tissues and reverse transcription were performed as previously described (36). To ensure expression of the full-length CYLD mRNA, RT-PCR analysis was performed using two specific primer combinations (Table S1, available at http://www.jem.org/cgi/content/full/jem.20082044/DC1) and the PCR products were resolved on 1.5% agarose gels. Sequences were examined by automated sequencing. Quantitative real time-PCR was performed with specific primers for CYLD, Cyclin D1, N-cadherin, and Snail1 (Table S2) applying LightCycler technology (Roche), as previously described (36).
Protein analysis.
Protein extraction, analysis, and Western blotting were performed as previously described (36), applying the following primary antibodies: polyclonal anti-CYLD (1:1,000 [17]), anti–Cyclin D1 (1:500; Santa Cruz Biotechnology, Inc.), anti–BCL-3 (1:250; Santa Cruz Biotechnology, Inc.), anti–N-cadherin (1:2,000; BD), anti-ERK1/2 (1:1,000), anti–Laminin A/C (1:1,000) or anti-phospho-ERK1/2 (1:1,000; Cell Signaling Technology), anti-Snail1 (1:500; Abcam), anti-Snail2 (1:500; Abcam), anti-Twist (1:500; Abcam), anti-tubulin (1:1,000; Millipore), or anti–β-actin (1:5,000; Sigma-Aldrich).
Immunohistochemical and immunofluorescence analysis of paraffin-embedded tissues applying anti-CYLD antibody (1:1,500), anti-Snail1 antibody (1:50), or anti-tyrosinase antibody was performed as previously described (17, 36). For negative control, the primary antibody was omitted and IgG isotype control antibodies did not reveal any detectable staining. Immunohistochemical stainings were counterstained with hematoxylin. For analysis of the tissue, microarray positivity for Snail1 was therefore defined as any detectable nuclear staining, and CYLD staining intensity was specified applying a semiquantitative three-step scoring system (score 0, negative; score 1+, weak; and score 2+, strong cytoplasmic staining). Examples for positive and negative CYLD and Snail1 stainings are given in Fig. 7 E. Intracellular BCL-3 localization was visualized by immunofluorescence analysis using an anti–BCL-3-antibody (1:200; Santa Cruz Biotechnology, Inc.).
Proliferation, colony formation in soft agar, migration, and invasion assays.
Cell proliferation was determined by means of BrdU incorporation into cellular DNA using an ELISA-based colorimetric assay (Roche). Colony formation in soft agar, monolayer scratch assays, spheroid migration assays, and migration and invasion assays in Boyden chambers were performed as previously described (40, 41).
ChIP.
ChIP was performed according to the manufacturer's (IMGENEX Corporation) instructions using polyclonal antibodies against Snail1 (clone E-18; Santa Cruz Biotechnology, Inc.), p50, p52, Snail2, Twist (Abcam), or BCL-3 (Santa Cruz Biotechnology, Inc.), and negative control rabbit immunoglobulin (DAKO) as control. The extracted DNA was used for semiquantitative PCR to amplify the Cyclin D1, N-cadherin, IL-10, or CYLD promoter region (Table S3, available at http://www.jem.org/cgi/content/full/jem.20082044/DC1).
Transfection of carcinoma cell lines.
Expression plasmids of CYLD, N-cadherin, or BCL-3 were used for transient transfection applying the Lipofectamine plus method (Invitrogen) (35, 36). BRAF plasmids (C. Wellbrook, University of Manchester, Manchester, England, UK) and Snail expression constructs (A. Garcia de Herreros, Institute Municipal, Barcelona, Spain) were also used. Stable expression of CYLD, C/S-CYLD, CYLD siRNA, and GFP was achieved by retro- or lentiviral gene transfer (42). In brief, CYLD and GFP were cloned into a retroviral vector (pclMFG). CMV promoter-driven lentiviral constructs were obtained by cloning wt-HA-CYLD, C/S-HA-CYLD, and GFP into a HIV-1–derived lentiviral vector (42).
Transfection with CYLD siRNA (43) or BCL-3 siRNA (17) was performed as previously described using HiPerfect according to the manufacturer's recommendations (Invitrogen), and the transfection efficiency was ∼40%. siRNA oligos were purchased from TAG Copenhagen A/S with the following RNA sequences: Scramble (5′-AGACCCACUCGGAUGUGAAGAGAUA-3′) and Snail1 697 (5′-GUGAAGAGAUACCAGUGUCAGGCCU-3′).
Reporter gene assays.
The reporter gene assays with CYLD, Cyclin D1, or N-cadherin promoter-luciferase plasmids were performed as previously described (17, 27, 36).
Statistical analysis.
Values are presented as means ± SEM. Statistical differences were determined using Student's t test. Contingency table analysis and two-sided Fisher's exact tests were used to study the statistical association between categorical clinicopathologic and immunohistochemical variables. Retrospective overall survival and progression-free survival curves comparing patients with and without any of the variables were calculated using the Kaplan-Meier method, with significance evaluated using log-rank statistics. For the progression-free survival analysis, patients were censored at the time of their last tumor-free clinical follow-up appointment. For the overall survival analysis, patients were censored at the time of their last clinical follow-up appointment. Median overall survival time for censored patients was 63.5 mo (range, 3–135 mo). P < 0.05 was considered significant. Statistical analyses were performed using SPSS version 10.0 (SPSS, Inc.).
Online supplemental material.
Fig. S1 shows the CYLD promoter sequence. Fig. S2 shows mRNA and protein expression of Snail and Slug in malignant melanoma cell lines. Fig. S3 includes data on the effect of CYLD analyzed in Mel Im as Snail clone 2. Fig. S4 shows the effect of CYLD on subcellular localization of Bcl-3. In Fig. S5, the effects of CYLD on proliferation and migration of Mel Juso melanoma cells in vitro are presented, and in Fig. S6 the effects of CYLD on in vivo proliferation and migration of Mel Juso melanoma are presented. Table S1 lists the primer used for amplification of the CYLD gene, Table S2 lists primer used for mRNA amplification by RT-PCR, and in Table S3 primer used in ChIP are listed. Online supplemental material is available at http://www.jem.org/cgi/content/full/jem.20082044/DC1.
Supplementary Material
Acknowledgments
We thank Susanne Wallner and Elisabeth Bumes for excellent technical assistance and Drs. J. Johnson (Ludwig Maximilians University of Munich, Germany) for melanoma cell lines, David Goltzman (McGill University, Montreal) for the N-cadherin promoter luciferase vector, Claudia Wellbrock (University of Manchester) for the BRAF constructs, and Antonio Garcia de Herreros (Institute Municipal, Barcelona) for the antisense Snail1 construct.
The work was supported by the German Research Association (to A.K. Bosserhoff, A. Pfeifer, and R. Fassler), the Dr. Mildred Scheel Foundation for Cancer Research, Melanoma Network (to A.K. Bosserhoff), the Swedish Society for Medical Research, Swedish Cancer Foundation, Swedish Medical Research Council, Royal Physiographic Society in Lund, U-MAS Research Foundations (to R. Massoumi), and the Max Planck Society (to R. Fassler).
The authors have no conflicting financial interests.
Abbreviations used: asSnail, antisense Snail1; ChIP, chromatin immunoprecipitation; EMT, epithelial-mesenchymal transition; ERK, extracellular signal–regulated kinase; MAPK, mitogen-activated protein kinase; mRNA, messenger RNA; NHEM, normal human epidermal melanocyte.
References
- 1.Chin, L., L.A. Garraway, and D.E. Fisher. 2006. Malignant melanoma: genetics and therapeutics in the genomic era. Genes Dev. 20:2149–2182. [DOI] [PubMed] [Google Scholar]
- 2.Haass, N.K., K.S. Smalley, L. Li, and M. Herlyn. 2005. Adhesion, migration and communication in melanocytes and melanoma. Pigment Cell Res. 18:150–159. [DOI] [PubMed] [Google Scholar]
- 3.Attis, M.G., J.L. Burchette, M.A. Selim, T. Pham, and A.P. Soler. 2006. Differential expression of N-cadherin distinguishes a subset of metastasizing desmoplastic melanomas. Hum. Pathol. 37:899–905. [DOI] [PubMed] [Google Scholar]
- 4.Qi, J., N. Chen, J. Wang, and C.H. Siu. 2005. Transendothelial migration of melanoma cells involves N-cadherin-mediated adhesion and activation of the beta-catenin signaling pathway. Mol. Biol. Cell. 16:4386–4397. [DOI] [PMC free article] [PubMed] [Google Scholar]
- 5.Smalley, K.S., P. Brafford, N.K. Haass, J.M. Brandner, E. Brown, and M. Herlyn. 2005. Up-regulated expression of zonula occludens protein-1 in human melanoma associates with N-cadherin and contributes to invasion and adhesion. Am. J. Pathol. 166:1541–1554. [DOI] [PMC free article] [PubMed] [Google Scholar]
- 6.Batlle, E., E. Sancho, C. Franci, D. Dominguez, M. Monfar, J. Baulida, and D.H. Garcia. 2000. The transcription factor snail is a repressor of E-cadherin gene expression in epithelial tumour cells. Nat. Cell Biol. 2:84–89. [DOI] [PubMed] [Google Scholar]
- 7.Cano, A., M.A. Perez-Moreno, I. Rodrigo, A. Locascio, M.J. Blanco, M.G. del Barrio, F. Portillo, and M.A. Nieto. 2000. The transcription factor snail controls epithelial-mesenchymal transitions by repressing E-cadherin expression. Nat. Cell Biol. 2:76–83. [DOI] [PubMed] [Google Scholar]
- 8.Bolos, V., H. Peinado, M.A. Perez-Moreno, M.F. Fraga, M. Esteller, and A. Cano. 2003. The transcription factor Slug represses E-cadherin expression and induces epithelial to mesenchymal transitions: a comparison with Snail and E47 repressors. J. Cell Sci. 116:499–511. [DOI] [PubMed] [Google Scholar]
- 9.Thiery, J.P. 2002. Epithelial-mesenchymal transitions in tumour progression. Nat. Rev. Cancer. 2:442–454. [DOI] [PubMed] [Google Scholar]
- 10.Nieto, M.A. 2002. The snail superfamily of zinc-finger transcription factors. Nat. Rev. Mol. Cell Biol. 3:155–166. [DOI] [PubMed] [Google Scholar]
- 11.Barrallo-Gimeno, A., and M.A. Nieto. 2005. The Snail genes as inducers of cell movement and survival: implications in development and cancer. Development. 132:3151–3161. [DOI] [PubMed] [Google Scholar]
- 12.Poser, I., D. Dominguez, A. G.de Herreros, A. Varnai, R. Buettner, and A.K. Bosserhoff. 2001. Loss of E-cadherin expression in melanoma cells involves up-regulation of the transcriptional repressor Snail. J. Biol. Chem. 276:24661–24666. [DOI] [PubMed] [Google Scholar]
- 13.Tan, C., P. Costello, J. Sanghera, D. Dominguez, J. Baulida, A. G.de Herreros, and S. Dedhar. 2001. Inhibition of integrin linked kinase (ILK) suppresses beta-catenin-Lef/Tcf-dependent transcription and expression of the E-cadherin repressor, snail, in APC−/− human colon carcinoma cells. Oncogene. 20:133–140. [DOI] [PubMed] [Google Scholar]
- 14.Gotzmann, J., H. Huber, C. Thallinger, M. Wolschek, B. Jansen, R. Schulte-Hermann, H. Beug, and W. Mikulits. 2002. Hepatocytes convert to a fibroblastoid phenotype through the cooperation of TGF-beta1 and Ha-Ras: steps towards invasiveness. J. Cell Sci. 115:1189–1202. [DOI] [PubMed] [Google Scholar]
- 15.Peinado, H., M. Quintanilla, and A. Cano. 2003. Transforming growth factor beta-1 induces snail transcription factor in epithelial cell lines: mechanisms for epithelial mesenchymal transitions. J. Biol. Chem. 278:21113–21123. [DOI] [PubMed] [Google Scholar]
- 16.Bignell, G.R., W. Warren, S. Seal, M. Takahashi, E. Rapley, R. Barfoot, H. Green, C. Brown, P.J. Biggs, S.R. Lakhani, et al. 2000. Identification of the familial cylindromatosis tumour-suppressor gene. Nat. Genet. 25:160–165. [DOI] [PubMed] [Google Scholar]
- 17.Massoumi, R., K. Chmielarska, K. Hennecke, A. Pfeifer, and R. Fassler. 2006. Cyld inhibits tumor cell proliferation by blocking Bcl-3-dependent NF-kappaB signaling. Cell. 125:665–677. [DOI] [PubMed] [Google Scholar]
- 18.Brummelkamp, T.R., S.M. Nijman, A.M. Dirac, and R. Bernards. 2003. Loss of the cylindromatosis tumour suppressor inhibits apoptosis by activating NF-kappaB. Nature. 424:797–801. [DOI] [PubMed] [Google Scholar]
- 19.Kovalenko, A., C. Chable-Bessia, G. Cantarella, A. Israel, D. Wallach, and G. Courtois. 2003. The tumour suppressor CYLD negatively regulates NF-kappaB signalling by deubiquitination. Nature. 424:801–805. [DOI] [PubMed] [Google Scholar]
- 20.Massoumi, R., M. Podda, R. Fassler, and R. Paus. 2006. Cylindroma as tumor of hair follicle origin. J. Invest. Dermatol. 126:1182–1184. [DOI] [PubMed] [Google Scholar]
- 21.Gupta, P.B., C. Kuperwasser, J.P. Brunet, S. Ramaswamy, W.L. Kuo, J.W. Gray, S.P. Naber, and R.A. Weinberg. 2005. The melanocyte differentiation program predisposes to metastasis after neoplastic transformation. Nat. Genet. 37:1047–1054. [DOI] [PMC free article] [PubMed] [Google Scholar]
- 22.Hoek, K., D.L. Rimm, K.R. Williams, H. Zhao, S. Ariyan, A. Lin, H.M. Kluger, A.J. Berger, E. Cheng, E.S. Trombetta, et al. 2004. Expression profiling reveals novel pathways in the transformation of melanocytes to melanomas. Cancer Res. 64:5270–5282. [DOI] [PubMed] [Google Scholar]
- 23.Barbera, M.J., I. Puig, D. Dominguez, S. Julien-Grille, S. Guaita-Esteruelas, S. Peiro, J. Baulida, C. Franci, S. Dedhar, L. Larue, and D.H. Garcia. 2004. Regulation of Snail transcription during epithelial to mesenchymal transition of tumor cells. Oncogene. 23:7345–7354. [DOI] [PubMed] [Google Scholar]
- 24.Satyamoorthy, K., G. Li, M.R. Gerrero, M.S. Brose, P. Volpe, B.L. Weber, P. Van Belle, D.E. Elder, and M. Herlyn. 2003. Constitutive mitogen-activated protein kinase activation in melanoma is mediated by both BRAF mutations and autocrine growth factor stimulation. Cancer Res. 63:756–759. [PubMed] [Google Scholar]
- 25.Sumimoto, H., F. Imabayashi, T. Iwata, and Y. Kawakami. 2006. The BRAF-MAPK signaling pathway is essential for cancer-immune evasion in human melanoma cells. J. Exp. Med. 203:1651–1656. [DOI] [PMC free article] [PubMed] [Google Scholar]
- 26.Wessells, J., M. Baer, H.A. Young, E. Claudio, K. Brown, U. Siebenlist, and P.F. Johnson. 2004. BCL-3 and NF-kappaB p50 attenuate lipopolysaccharide-induced inflammatory responses in macrophages. J. Biol. Chem. 279:49995–50003. [DOI] [PubMed] [Google Scholar]
- 27.Kuphal, S., and A.K. Bosserhoff. 2006. Influence of the cytoplasmic domain of E-cadherin on endogenous N-cadherin expression in malignant melanoma. Oncogene. 25:248–259. [DOI] [PubMed] [Google Scholar]
- 28.Bosserhoff, A.K., M. Kaufmann, B. Kaluza, I. Bartke, H. Zirngibl, R. Hein, W. Stolz, and R. Buettner. 1997. Melanoma-inhibiting activity, a novel serum marker for progression of malignant melanoma. Cancer Res. 57:3149–3153. [PubMed] [Google Scholar]
- 29.Chudnovsky, Y., P.A. Khavari, and A.E. Adams. 2005. Melanoma genetics and the development of rational therapeutics. J. Clin. Invest. 115:813–824. [DOI] [PMC free article] [PubMed] [Google Scholar]
- 30.Smalley, K.S. 2003. A pivotal role for ERK in the oncogenic behaviour of malignant melanoma? Int. J. Cancer. 104:527–532. [DOI] [PubMed] [Google Scholar]
- 31.Curtin, J.A., J. Fridlyand, T. Kageshita, H.N. Patel, K.J. Busam, H. Kutzner, K.H. Cho, S. Aiba, E.B. Brocker, P.E. LeBoit, et al. 2005. Distinct sets of genetic alterations in melanoma. N. Engl. J. Med. 353:2135–2147. [DOI] [PubMed] [Google Scholar]
- 32.Liu, J., K.G. Suresh Kumar, D. Yu, S.A. Molton, M. McMahon, M. Herlyn, A. Thomas-Tikhonenko, and S.Y. Fuchs. 2007. Oncogenic BRAF regulates beta-Trcp expression and NF-kappaB activity in human melanoma cells. Oncogene. 26:1954–1958. [DOI] [PMC free article] [PubMed] [Google Scholar]
- 33.Kuphal, S., I. Poser, C. Jobin, C. Hellerbrand, and A.K. Bosserhoff. 2004. Loss of E-cadherin leads to upregulation of NFkappaB activity in malignant melanoma. Oncogene. 23:8509–8519. [DOI] [PubMed] [Google Scholar]
- 34.Ueda, Y., and A. Richmond. 2006. NF-kappaB activation in melanoma. Pigment Cell Res. 19:112–124. [DOI] [PMC free article] [PubMed] [Google Scholar]
- 35.Rothhammer, T., I. Poser, F. Soncin, F. Bataille, M. Moser, and A.K. Bosserhoff. 2005. Bone morphogenic proteins are overexpressed in malignant melanoma and promote cell invasion and migration. Cancer Res. 65:448–456. [PubMed] [Google Scholar]
- 36.Hellerbrand, C., E. Bumes, F. Bataille, W. Dietmaier, R. Massoumi, and A.K. Bosserhoff. 2007. Reduced expression of CYLD in human colon and hepatocellular carcinomas. Carcinogenesis. 28:21–27. [DOI] [PubMed] [Google Scholar]
- 37.Rothhammer, T., F. Bataille, T. Spruss, G. Eissner, and A.K. Bosserhoff. 2007. Functional implication of BMP4 expression on angiogenesis in malignant melanoma. Oncogene. 26:4158–4170. [DOI] [PubMed] [Google Scholar]
- 38.Bosserhoff, A.K., M. Moser, R. Hein, M. Landthaler, and R. Buettner. 1999. In situ expression patterns of melanoma-inhibiting activity (MIA) in melanomas and breast cancers. J. Pathol. 187:446–454. [DOI] [PubMed] [Google Scholar]
- 39.Simon, R., M. Mirlacher, and G. Sauter. 2003. Tissue microarrays in cancer diagnosis. Expert Rev. Mol. Diagn. 3:421–430. [DOI] [PubMed] [Google Scholar]
- 40.Kuphal, S., S. Wallner, C.C. Schimanski, F. Bataille, P. Hofer, S. Strand, D. Strand, and A.K. Bosserhoff. 2006. Expression of Hugl-1 is strongly reduced in malignant melanoma. Oncogene. 25:103–110. [DOI] [PubMed] [Google Scholar]
- 41.Arslan, F., A.K. Bosserhoff, T. Nickl-Jockschat, A. Doerfelt, U. Bogdahn, and P. Hau. 2007. The role of versican isoforms V0/V1 in glioma migration mediated by transforming growth factor-beta2. Br. J. Cancer. 96:1560–1568. [DOI] [PMC free article] [PubMed] [Google Scholar]
- 42.Pfeifer, A., T. Kessler, S. Silletti, D.A. Cheresh, and I.M. Verma. 2000. Suppression of angiogenesis by lentiviral delivery of PEX, a noncatalytic fragment of matrix metalloproteinase 2. Proc. Natl. Acad. Sci. USA. 97:12227–12232. [DOI] [PMC free article] [PubMed] [Google Scholar]
- 43.Reiley, W., M. Zhang, X. Wu, E. Granger, and S.C. Sun. 2005. Regulation of the deubiquitinating enzyme CYLD by IkappaB kinase gamma-dependent phosphorylation. Mol. Cell. Biol. 25:3886–3895. [DOI] [PMC free article] [PubMed] [Google Scholar]
Associated Data
This section collects any data citations, data availability statements, or supplementary materials included in this article.