Abstract
Although the tail of the pancreas is the second most common site of an accessory spleen, intrapancreatic accessory spleen (IPAS) has rarely been noted radiologically. However, as the imaging techniques have recently advanced, IPAS will be more frequently detected as an incidental pancreatic nodule on CT or MRI. Because accessory spleens usually pose no clinical problems, it is important to characterize accessory spleens as noninvasively as possible. An IPAS has similar characteristics to those of the spleen on the precontrast and contrast-enhanced images of all the imaging modalities. In particular, inhomogeneous enhancement of an IPAS in its early phases may be a diagnostic clue. Superparamagnetic iron oxide (SPIO)-enhanced MRI and Levovist-enhanced US, and the mechanisms of which are theoretically similar to that of Tc-99m scintigraphy, can be used as alternative tools to confirm the diagnosis of IPAS. An IPAS shows a significant signal drop similar to the spleen on the SPIO-enhanced T2 or T2*-weighted imaging and prolonged enhancement on the delayed hepatosplenic phase of contrast-enhanced US. We review and illustrate the differential points between IPAS and hypervascular pancreatic tumors in this manuscript.
Keywords: Pancreas, Spleen, Ultrasound (US), Computed tomography (CT), Magnetic resonance (MR)
Ectopic splenic tissue can be categorized as two entities: splenosis that is due to autotransplantation of splenic tissue, and this usually happens after splenectomy (1); and accessory spleens that are congenital foci of healthy splenic tissue that are separate from the main body of the spleen (1).
Accessory spleens are structurally identical to the spleen and they arise from the failure of fusion of the splenic anlage located in the dorsal mesogastrium during the fifth week of fetal life (1). The presence of an accessory spleen has been reported in 10% to 30% of cases in postmortem studies (2) and in 45% to 65% of patients after splenectomy (3). The locations of accessory spleens vary, i.e., the splenic hilum, the tail of the pancreas, the greater omentum, the splenic ligament, the small and large intestinal mesentery, the wall of the small intestine, the female adnexa and the scrotum in descending order of prevalence. Although intrapancreatic accessory spleen (IPAS) has rarely been noted radiologically because the spatial resolution of conventional images was too low to detect them, it is not uncommon. Indeed, in an autopsy study of 3,000 patients, 61 (16.8%) of 364 accessory spleens were found in the pancreatic tail (2).
It is important to characterize accessory spleens as noninvasively as possible as they usually pose no clinical problems and no treatment is necessary except in the following three circumstances: first, an accessory spleen may mimic lymphadenopathy or tumors in other abdominal organs, including the pancreas. Second, accessory spleen occasionally may become symptomatic because of torsion, spontaneous rupture, hemorrhage and cyst formation. Third, all functional splenic tissue should be removed for the treatment of hematologic disorders such as idiopathic thrombocytopenic purpura (ITP). However, most of the previously reported IPASs had been diagnosed correctly after invasive surgery because they were mistaken for pancreatic tumors such as islet cell tumor, solid pseudopapillary tumor, hypervascular metastasis and even ductal adenocarcinoma (4, 5). Therefore, an accurate preoperative diagnosis helps to obviate unnecessary surgery or biopsy and it eventually lessens the overall patient morbidity.
Based on our experience with more than 15 patients with IPAS, this article describes the full spectrum of findings for IPAS on US, CT and MRI, along with the findings of Tc-99m heat-damaged red blood cell (HDRBC) scintigraphy or the histopathology. In addition, the points to differentiate between IPAS and hypervascular pancreatic tumors will also be provided.
Histologic Features of Intrapancreatic Accessory Spleen
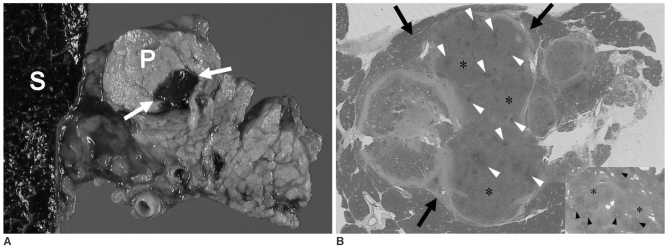
On gross examination, accessory spleens are usually surrounded by a fibrotic capsule that separates it from the adjacent pancreatic parenchyma (Fig. 1A). On histologic analysis, IPAS is composed of red and white pulp that is similar to that of the normal spleen (Fig. 1B). The red pulp is made up of numerous vascular sinuses. Between these sinuses lie the lymphoid follicles and the cells of the reticuloendothelial system (RES), which together constitute the white pulp. The white-to-red pulp ratio increases with a patient's age and progressive antigenic stimulation (6). This unique anatomy of the spleen leads to normal variations in appearance that can be fully appreciated on CT and MRI. Red pulp contributes to the low signal intensity (SI) of the spleen on T2-weighted images because this pulp consists of the sinusoids of non-thrombotic blood, whereas the white pulp contributes to high SI on T2-weighted images because of the higher water content of the lymphoid tissue (6).
Fig. 1.
Gross pathologic and histologic findings of intrapancreatic accessory spleen.
A. Cross section of resected specimen of intrapancreatic accessory spleen shows reddish nodule (arrows) surrounded by yellowish pancreatic parenchyma (P). S = main spleen
B. Photomicrographs (original magnification, Hematoxylin & Eosin staining, ×100) show splenic tissue surrounded by fibrous capsule (arrows). Note higher white (arrowheads)-to-red (*) pulp ratio in intrapancreatic accessory spleen than that in normal spleen (right lower corner).
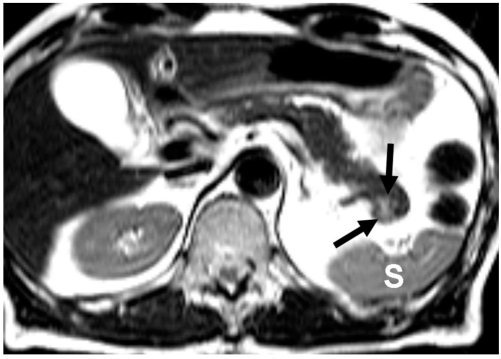
As was the case in our study population, IPAS can have a different white-to-red pulp ratio compared to normal spleen even though the reason for the difference in its ratio is unclear (Fig. 1B). This means that the SI of IPAS on T2-weighted imaging can be different from that of the normal spleen (7) (Fig. 2). Such higher T2 SI may be responsible for observing a higher white-to-red pulp ratio compared to normal spleen (7); consequently, this may lead radiologists to make an incorrect diagnosis. Familiarity with this histologic-radiologic correlation minimizes the chance that the IPAS will be mistaken for pancreatic neoplasm.
Fig. 2.
70-year-old man with intrapancreatic accessory spleen. On T2-weighted turbo spin-echo image, intrapancreatic accessory spleen (arrows) shows high signal intensity compared to pancreas. Lesion also has slightly higher signal intensity than spleen (S). Intrapancreatic accessory spleen was confirmed by Tc-99m SPECT.
Imaging Findings of Intrapancreatic Accessory Spleen
Ultrasonography
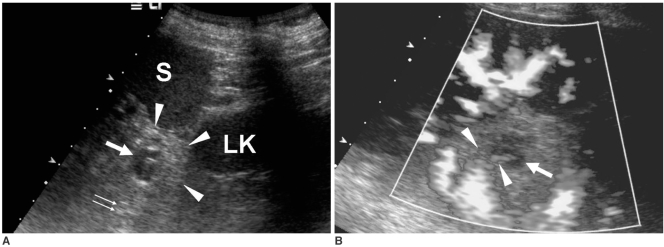
On gray-scale baseline US, an accessory spleen is usually seen as a round or oval mass with a mildly echogenic and homogeneous texture and shows posterior enhancement behind the lesion (8) (Fig. 3). Accessory spleens are usually surrounded by a high-amplitude interface (8) that is observed to be a fibrotic capsule on histologic examination. On color or power Doppler US, a characteristic blood supply, that is, the presence of a vascular hilum entering the lesion, has been reported to be a sensitive (90% of sensitivity) diagnostic feature of accessory spleen (8) (Fig. 3). In a previous study, such a vascular hilum was observed in three (50%) of six patients who underwent color (or power) Doppler US imaging (9).
Fig. 3.
US appearance of intrapancreatic accessory spleen.
A. Oblique coronal gray-scale US scan shows 2.4-cm size lobulated intrapancreatic accessory spleen (arrow) that is slightly hypoechoic relative to surrounding pancreas tissue (arrowheads) and it has thin echogenic rim. Note posterior acoustic enhancement (double arrow) behind lesion. S = spleen, LK = left kidney
B. Power Doppler US image demonstrates two vascular pedicles (arrowheads) entering into intrapancreatic accessory spleen (arrow).
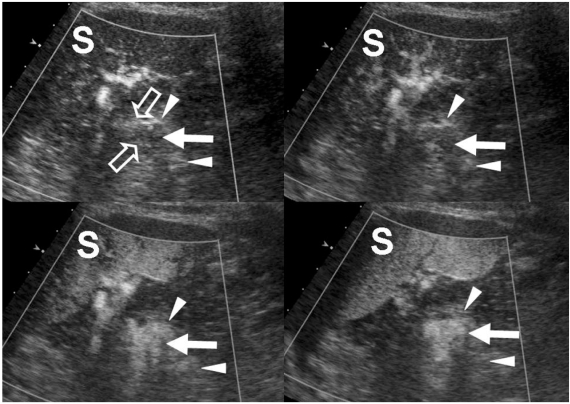
In a previous study, contrast-enhanced US using Levovist (Schering, Berlin, Germany) showed characteristic enhancement features that allow the diagnosis of IPAS (9) (Fig. 4). On the early vascular phase, one or more vascular pedicles entering the IPAS can be more clearly visualized than on color or power Doppler US. During other phases of contrast enhanced-US, the IPASs showed enhancement patterns identical to those of the spleen. On the arterial phase, inhomogeneous enhancement related to the different flow rate through the cords of the red and white pulp can serve as another diagnostic feature. Most IPASs become homogeneous on the portal venous phase, showing dense persistent enhancement for as long as 3 to 5 minutes (Fig. 4). Such persistent enhancement of IPAS on the hepatosplenic parenchymal phase is thought to occur due to prolonged entrapment of Levovist by the RES cells in the splenic tissue (9). The mechanism of Levovist-enhanced US on the hepatosplenic phase is theoretically similar to those of Tc-99m HDRBC scintigraphy and superparamagnetic iron oxide (SPIO)-enhanced MRI (7), and these modalities are used as a confirmatory tool to diagnose IPAS. On all dynamic US phases, the echoenhancement of IPAS is usually greater than that of the pancreas (Fig. 4).
Fig. 4.
Levovist-enhanced US appearance of intrapancreatic accessory spleen. On serial contrast-enhanced US images obtained 22 sec (upper left), 40 sec (upper right), 88 sec (lower left) and 4 minutes (lower right) after contrast injection, enhancement patterns of intrapancreatic accessory spleen (arrow) that are similar to that of spleen are demonstrated on all four dynamic phases. Note clearly visualized vascular pedicles (open arrows) within intrapancreatic accessory spleen on early vascular phase image (upper left) and early heterogeneous enhancement of lesion (arrow) on late arterial phase image (upper right). Prolonged and homogeneous enhancement of intrapancreatic accessory spleen on delayed hepatosplenic parenchymal phase is one of characteristic US features of intrapancreatic accessory spleen (lower right). Intrapancreatic accessory spleen (arrow) and main spleen (S) show higher echogenicity than that of pancreas (arrowheads) on all contrast-enhanced US phases.
Multidetector-row CT Findings
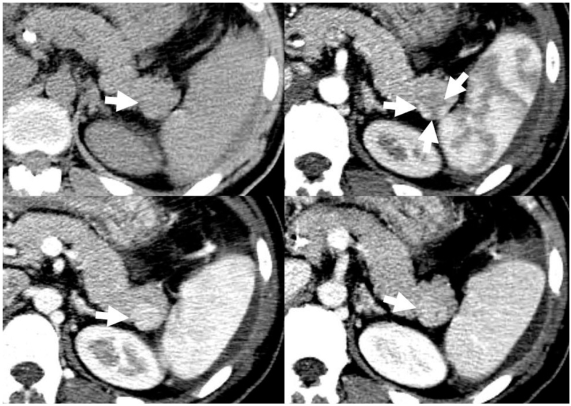
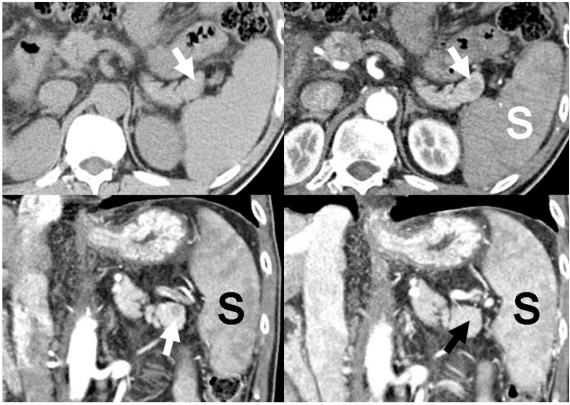
The multidetector-row CT (MDCT) appearance of IPAS largely depends on the CT phases that are used. In our hospital, if a hypervascular nodule is detected in the pancreas on single phase CT images, we usually recommend performing triple-phase (arterial, pancreatic and portal phases) CT for further characterization of that nodule. The same as in normal spleen, IPAS may demonstrate heterogeneous enhancement on the early CT phase (usually within 70 seconds after contrast administration) because of the different rates of flow through the cords of the red and white pulp (10). With the introduction of MDCT scanners and the recent advances of techniques to deliver contrast agent, this inhomogeneous enhancement pattern might be more frequently observed even in small IPASs and it can be a helpful feature to differentiate them from other hypervascular pancreatic tumors (Fig. 5). The attenuation of IPAS on all the dynamic CT phases is usually similar to that of the spleen (Figs. 5, 6). In general, because attenuation of the spleen is higher than that of the pancreas on the arterial, pancreatic and portal venous phases, we can easily presume that IPAS will be brighter than the pancreas on all three dynamic CT phases. Indeed, according to a previous study that examined seven IPASs, the mean HU value of the IPASs was higher than that of the pancreas on all three enhanced CT phases (7). However, the attenuation of IPAS can, on rare occasions, be lower than that of the pancreas on the arterial and pancreatic phases (Fig. 6). It can occur under a condition when splenic enhancement is retarded, such as liver cirrhosis (11). Indeed, one of our patients (Fig. 6) was followed-up due to advanced liver cirrhosis. Nonetheless, the attenuation of IPAS is equal to that of the spleen (Fig. 6).
Fig. 5.
Typical multidetector CT appearance of intrapancreatic accessory spleen. On precontrast CT image (left upper), lesion shows isoattenuation compared to pancreas and spleen. On contrast-enhanced axial CT images obtained during arterial phase (right upper), pancreatic phase (left lower), and portal venous (right lower) phase, intrapancreatic accessory spleen (arrows) is located in tail of pancreas and it shows high attenuation compared to pancreas on all phases and it is isoattenuating compared to spleen. Note inhomogeneous enhancement within lesion, which is identical to zebra-striped enhancement of spleen on arterial phase (right upper).
Fig. 6.
Atypical CT appearance of small intrapancreatic accessory spleen in 52-year-old man with advanced liver cirrhosis. On precontrast axial CT scan (left upper), lesion (arrow) shows iso-attenuation compared to pancreas. Axial CT image obtained during arterial phase (right upper) depicts round, well-demarcated and low-attenuating nodule (arrow) in pancreas tail. However, lesion shows attenuation that's identical to spleen (S). On oblique coronal multiplanar reconstruction images obtained during pancreatic (left lower) and portal (right lower) phases, intrapancreatic accessory spleen (arrows) shows low attenuation compared to pancreas on pancreatic phase (left lower), iso-attenuation compared to pancreas on portal phase (right lower) and iso-attenuation compared to spleen (S) on both phases. Even though main spleen still shows slight heterogeneity on portal phase (right lower), intrapancreatic accessory spleen can not be distinguished from adjacent pancreas on portal phase due to its small size. Retarded splenic perfusion due to liver cirrhosis is regarded as possible cause for such low attenuation of both spleen and intrapancreatic accessory spleen on early CT phases.
On the contrary, other hypervascular pancreatic tumors, including islet cell tumor, were hyperattenuating on the arterial phase and iso- or low-attenuating to the adjacent pancreas on the venous phase (12, 13). Therefore, the prolonged enhancement of IPAS relative to the pancreas on the portal venous phase would provide another clue for the diagnosis (Fig. 5).
MRI
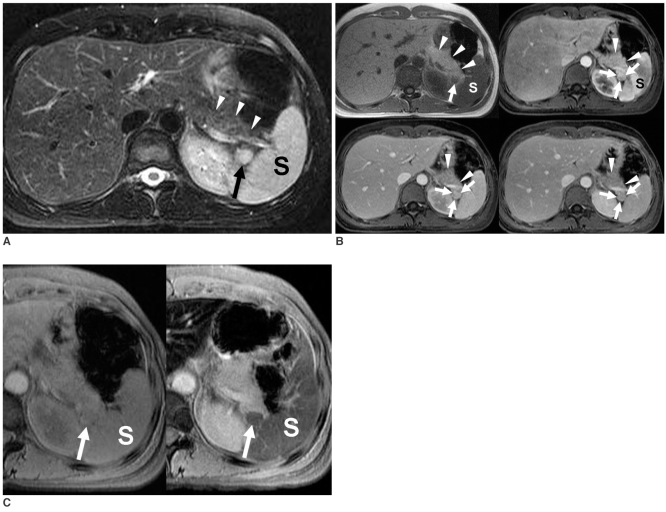
The MR findings of IPAS have rarely been reported (4, 7, 14). Pancreatic tumors share signal characteristics with that of the spleen on MRI and so this accounts for the difficulty in differentiating IPAS from pancreatic tumors. In a previous report (7) in which we analyzed the MR findings of seven IPASs, the SI of IPAS was darker than that of the surrounding pancreatic parenchyma on the T1-weighted images and it was brighter than that of the pancreas on the T2-weighted images (Fig. 7). The key for diagnosing IPAS is that SIs of the IPAS are identical to those of the spleen on multiple MR pulse sequences (Fig. 7). However, we found that the SI of one IPAS was slightly brighter than that of the spleen on the T2-weighted images and this finding, such as the bright T2 SI, was due to the higher white-to-red pulp ratio of the IPAS, as was determined by pathologic examination (7) (Figs. 1, 2).
Fig. 7.
MRI features of intrapancreatic accessory spleen.
A. Intrapancreatic accessory spleen (arrow) shows high signal intensity compared to pancreas (arrowheads) on axial, fat-saturated, T2-weighted turbo spin-echo image.
B. Lesion (arrow) shows low signal intensity compared to pancreas (arrowheads) on axial, 2D T1-weighted gradient echo image (left upper). Signal intensity of intrapancreatic accessory spleen is similar to that of spleen (S). On gadolinium-enhanced MR images obtained during arterial phase (right upper), lesion (arrows) shows intense heterogeneous lesion enhancement. Heterogeneous enhancement, which is characteristic of splenic tissue during early phase (within 70 secs), is identical to that of spleen (S). This is due to different flow rates through cords of red and white pulp. On portal (left lower) and delayed (right lower) phases, lesion (arrows) has become homogenously high and iso-intense relative to surrounding pancreas parenchyma (arrowheads), respectively. Signal intensity of lesion is exactly identical to that of spleen.
C. Precontrast (left) and SPIO-enhanced (right) T2*-weighted images show signal drop in intrapancreatic accessory spleen (arrows) to similar degree compared to that of main spleen (S) when compared to precontrast image (left).
Even though dynamic gadolinium (Gd)-enhanced MRI has gained an important role for characterizing intrapancreatic lesions, any reports on dynamic MR findings of IPAS are very rare (4, 14). As might be expected, the enhancement of IPAS on MRI is similar to that of the adjacent normal spleen (Fig. 7). The same as on US or CT, the characteristic inhomogeneous enhancement of IPAS may be seen on the arterial phase Gd-enhanced MRI (Fig. 7). However, unlike hepatic tumors, those lesions located in the pancreas may be less conspicuous on the Gd-enhanced MR images because of the high SI of the pancreas on the unenhanced T1-weighted images.
Superparamagnetic iron oxide-enhanced MRI, which theoretically uses the identical principle to that of Tc-99m HDRBC scintigraphy, has recently been proposed as an alternative diagnostic tool for IPAS because of its higher spatial resolution than scintigraphy (7). As the SPIO-based contrast medium is targeted in the RES cells, it can be used to demonstrate the presence and function of RES cells within the lesions. The RES cells show uptake of ferucarbotran and therefore lower SI of the IPASs as well as that of the main spleen on the T2- or T2*-weighted images (Fig. 7). In addition, the degree of the signal drop in the IPASs is also similar to that of the spleen.
Tc-99m Heat-damaged Red Blood Cell Scintigraphy
Technetium-99m HDRBC scintigraphy is a highly specific method for detecting splenic tissue as up to 90% of the injected HDRBCs are trapped by splenic tissue (15). The diagnostic criterion used to detect accessory spleen, including IPAS, was the presence of a marked increase in uptake that exceeds that of the cardiac blood pool and the major vessels at the site of suspected accessory spleen (Fig. 8). Autologous HDRBCs are converted into rigid spherocysts; when these are intravenously injected, they are sequestered by the spleen in the same way that senescent and damaged cells are handled by the system. Although Tc-99m HDRBC scintigraphy allows selective splenic visualization with an excellent spleen-to-liver ratio, splenic visualization is still difficult under conditions in which minimal functioning splenic tissue is present, as happens in cases of accessory spleens. In addition, Tc-99m HDRBC scintigraphy even with SPECT offers inferior spatial resolution compared to other cross-sectional imaging modalities. These problems are more accentuated on planar imaging than on SPECT. In our study population, a 1.1-cm lesion was missed on Tc-99m SPECT scintigraphy, but it was detected on CT and MRI. Therefore, SPECT is frequently used in conjunction with other cross-sectional imaging modalities to diagnose and precisely localize an accessory spleen (Fig. 8).
Fig. 8.
Technetium-99m heat-damaged red blood cell SPECT of intrapancreatic accessory spleen.
A. Coronal Tc-99m SPECT image of upper abdomen shows hot uptake foci (arrow) near splenic hilum. S = spleen, L = liver
B. Co-registered and fused image (middle) between coronal Tc-99m SPECT (right) and T2-weighted coronal MR (left) images, confirms that SPECT hot uptake (arrows) matched corresponding high-signal intensity intrapancreatic lesion (arrowhead) seen on MRI.
Differentiation from Hypervascular Pancreatic Neoplasms
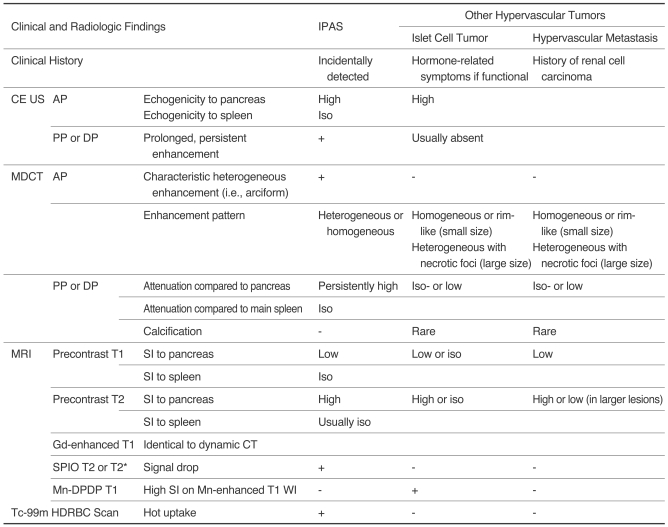
Because the imaging findings of IPAS are sometimes shared with hypervascular pancreatic tumors, knowing the different imaging characteristics that distinguish between them is clinically important in order to obviate unnecessary surgery or invasive biopsy. The differential points of the imaging findings of IPAS and hypervascular pancreatic tumors are summarized in Table 1.
Table 1.
Differential Points Between Intrapancreatic Accessory Spleen and Other Hypervascular Tumors on Various Imaging Studies
Note.-IPAS = intrapancreatic accessory spleen, CE US = contrast-enhanced US, AP = arterial phase, PP = portal phase, DP = delayed phase, Gd = gadolinium, SPIO = superparamagnetic iron oxide, Mn-DPDP = mangafodipir trisodium, HDRBC = heat-damaged red blood cell, SI = signal intensity
Pancreatic Islet Cell Tumor
Intrapancreatic accessory spleen can be easily differentiated from nonfunctioning islet cell tumor based on the size of the lesion and the heterogeneity, and the latter is due to the presence of a necrotic area within the lesion; however, it may be difficult to differentiate IPAS from functioning islet cell tumor based on only the imaging findings.
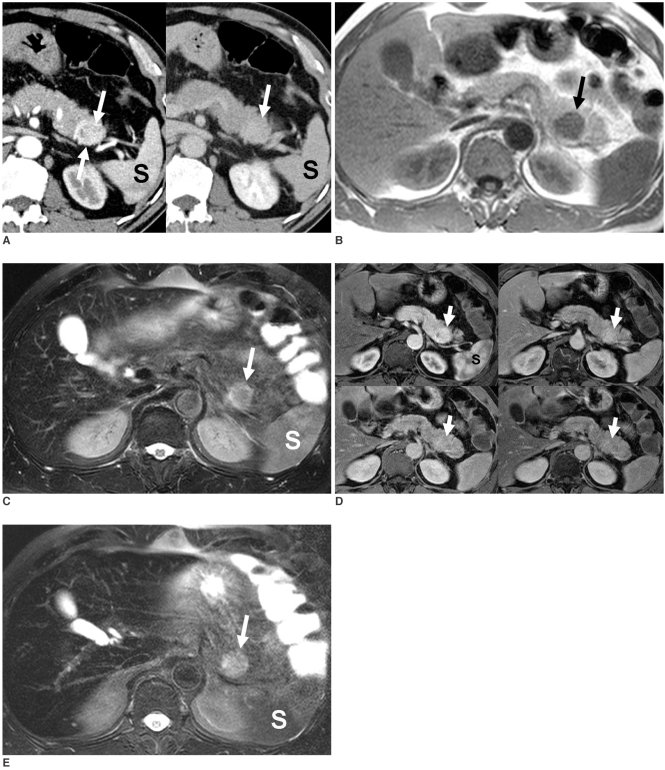
While IPASs showed hyper-echogenicity compared to the pancreas and iso-echogenicity compared to the spleen on all the contrast-enhanced US phases, islet cell tumors usually become iso- or low-echoic compared to the pancreas on the portal or delayed phases (16). Therefore, the prolonged enhancement relative to the pancreas on the contrast-enhanced US provides a clue to the correct differential diagnosis. The same as for IPAS, the majority of pancreatic islet cell tumors are hyperattenuating on the arterial phase CT images (Fig. 9). However, a considerable proportion (40-45%) of the tumors can be hypo- or isoattenuating relative to the enhanced pancreas on the arterial phase CT images (17, 18). Furthermore, islet cell tumors can have a ring-like enhancement that differs from the enhancement pattern of IPAS on the arterial phase. In addition, unlike IPAS, islet cell tumor does not have the characteristic enhancement pattern, i.e. arciform or zebrapatterned enhancement, of the spleen and some islet cell tumors are iso- or low-attenuating compared to the pancreas on the portal or delayed phase images (12, 13) (Fig. 9).
Fig. 9.
Islet cell tumor in tail of the pancreas.
A. Arterial phase CT scan (left) reveals well-defined, homogeneous, hyperattenuating mass (arrow) in pancreatic tail. Note zebra-striped enhancement of spleen (S). On delayed phase scan (right), lesion (arrow) is nearly iso-attenuating compared to pancreas.
B, C. Lesion (arrow) is hypointense on T1-weighted gradient echo image (B) and hyperintense on T2-weighted fat saturated turbo spin-echo image (C). S: spleen
D. On serial gadolinium-enhanced MR images obtained during arterial (left upper), pancreatic (right upper), portal (left lower), and delayed (right lower) phases, lesion conspicuity was most dramatic on arterial phase and this was diminished on following three phases. Note homogeneous enhancement of lesion (arrows) compared to zebra-striped enhancement of spleen (S) on arterial phase.
E. On SPIO-enhanced T2-weighted image, no signal drop was seen in lesion (arrow). Note signal drop of spleen (S) when compared to precontrast image (C).
On MRI, islet cell tumors are typically hypointense compared to the pancreas on the T1-weighted images and hyperintense on the T2-weighted images, but isointense T1- and T2-weighted signal intensities have also been reported (19). The same as on CT, islet cell tumors often demonstrate uniform or ring-like enhancement and this may be more conspicuous during the early arterial phase (Fig. 9). However, a characteristic enhancement pattern, i.e. arciform or zebra-patterned enhancement, of the spleen is not shown by islet cell tumor. On SPIO-enhanced MRI, islet cell tumors do not show negative enhancement or a loss of signal intensity due to the absence of RES cells (Fig. 9).
In addition, Sahani et al. (20) described mangafodipir trisodium (Mn-DPDP) uptake by a functioning pancreatic acinar cell carcinoma and they suggested that a functioning pancreatic tumor should also exhibit the same behavior.The presence of Mn-DPDP uptake may support the possibility of a functioning islet cell tumor.
Hypervascular Metastasis
Hematogenous metastases to the pancreas are rare and these usually manifest in advanced disease. Melanoma, lung cancer and breast carcinoma are the most common origins of pancreatic metastases. The imaging findings of most pancreatic metastases are similar to those of pancreatic adenocarcinoma. However, renal cell carcinoma metastases may demonstrate a hypervascular appearance and its imaging findings may mimic those of other hypervascular pancreatic lesions such as IPAS.
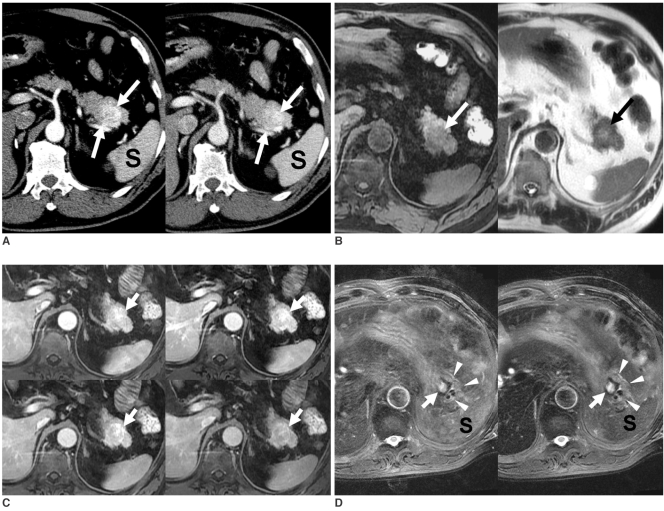
On unenhanced CT studies, pancreatic metastases appear iso- or hypodense compared to the normal parenchyma. On contrast-enhanced CT, most hypervascular metastases avidly enhance during the arterial phase. Nodules smaller than 1.5 cm in diameter usually have homogeneous enhancement while large masses are characterized by heterogeneous enhancement with a central hypodense area. In these cases, splenic vein involvement may be observed. Ng et al. (21) reported the CT enhancement characteristics of renal carcinoma that metastasized to the pancreas in a series of nine patients. They detected 34 pancreatic metastases that were from 0.6 to 11 cm in diameter. All the metastases exhibited rapid enhancement on the arterial phase beginning 25 sec from the start of injection. The lesion conspicuity was less dramatic on the 60-sec portal phase images and this was diminished even further on the 120-sec delayed phase images (21) (Fig. 10).
Fig. 10.
Solitary pancreatic metastasis from renal cell carcinoma that occurred six years after right nephrectomy.
A. On arterial phase CT scan (left), lesion (arrows) enhanced more strongly than did spleen (S). Delayed phase CT scan (right) reveals slightly higher attenuation of lesion (arrows) compared to that of pancreas.
B. Lesion (arrows) is hypointense and heterogeneous hyperintense compared to pancreas on T1- (left) and T2-weighted (right) MR images, respectively.
C. On serial dynamic Gd-enhanced MR images obtained at similar phases to those in Figure 9, metastasis (arrows) demonstrates enhancement similar to that described on CT.
D. Precontrast (left) and SPIO-enhanced (right) fat-saturated T2-weighted images do not show any signal drop of lesion (arrows) in pancreas (arrowheads). Note signal drop of spleen (S) on SPIO-enhanced image (right) when compared to precontrast image (left).
On MRI, pancreatic lesions appear hypointense compared to the normal pancreatic parenchyma on the unenhanced T1-weighted images, both with and without fat saturation. On T2-weighted images, they have a heterogeneous or moderately hyperintense signal (22). If the lesions are very large, then they can also appear hypointense. After intravenous gadolinium contrast administration, a rim of enhancement is visible in the larger lesions, and homogeneous enhancement is usually demonstrated in the smaller metastases, as is seen on CT scans (22) (Fig. 10). On SPIO-enhanced MRI, pancreatic metastases do not show negative enhancement or loss of signal intensity because of the absence of RES cells (Fig. 10). Even though making the distinction between renal cancer pancreatic metastasis and islet cell tumors or IPAS may be problematic, the clinical history can allow this distinction to be made. A hypervascular pancreatic tumor in a patient with a history of renal cell carcinoma should be considered as metastasis from renal cancer unless proven otherwise.
Disease of Intrapancreatic Accessory Spleen
Epidermoid Cyst in Intrapancreatic Accessory Spleen
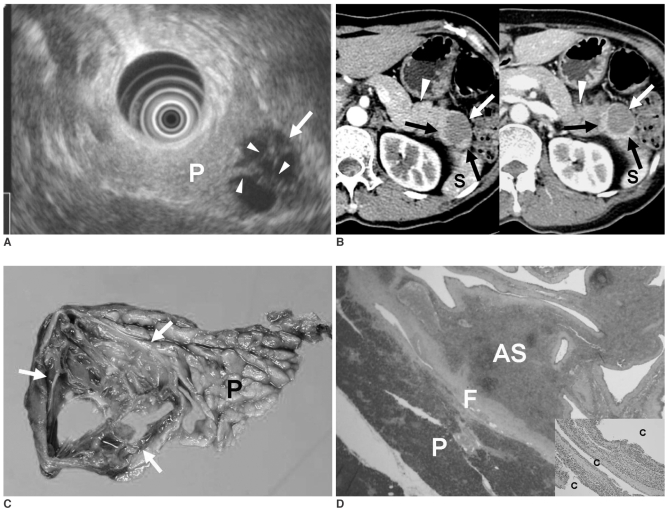
Epidermoid cysts of the spleen are comparatively rare, accounting for only 10 to 20% of the non-parasitic splenic cysts (23). Epidermoid cysts are lined with stratified squamous epithelium, but they have no skin appendages such as sebaceous glands or sweat glands (Fig. 11). Furthermore, epidermoid cysts of the accessory spleen are so rare that only about 10 cases have been reported (6, 24). It is interesting that all the cases of epidermoid cysts of the accessory spleen have been located in the pancreatic tail (Fig. 11). Accordingly, the possibility that the epithelium of epidermal cysts of accessory spleen may have originated from the pancreatic duct has been suggested by Horibe et al. (25). Those authors also suggested that frequent recurrence of chronic inflammation and epitheloid cell granuloma formation in the IPAS may result from an aberration of the ectopic remaining pancreatic tissue in the spleen.
Fig. 11.
Epidermoid cyst in intrapancreatic accessory spleen.
A. Endoscopic US scan shows well-demarcated, low echoic lesion (arrow) attached to pancreatic tail (P) at splenic hilum. Lesion has several thick septa (arrowheads).
B. Axial CT images obtained during arterial (left) and portal (right) phases demonstrate cystic mass (arrows) connected to pancreatic tail (arrowheads). Solid component, which was later revealed to be intrapancreatic accessory spleen, shows same attenuation as spleen (S).
C. Gross specimen of distal pancreatectomy shows cyst (arrows) in pancreatic tail (P).
D. On photomicrograph (Hematoxylin & Eosin staining, ×40), thin fibrous capsule (F) separates intrapancreatic accessory spleen (AS) from pancreas (P). On high power field photomicrograph (Hematoxylin & Eosin staining, ×100) (right lower corner), cysts (c) are lined by stratified squamous epithelium.
The diagnosis of epidermoid cysts of IPAS is quite difficult and this malady is almost always misdiagnosed as pancreatic cystic lesions, including pseudocysts, simple pancreatic cysts, cystic neoplasm and cystic degeneration of pancreatic tumor such as islet cell tumor and even adenocarcinoma. There has been only one report in the English medical literature on the imaging findings of epidermoid cyst in IPAS (24). In that report, distal pancreatectomy and splenectomy were performed and there was a preoperative diagnosis of cystadenocarcinoma or solid cystic neoplasm of the pancreas.
In our case, the solid portion of the lesion showed similar enhancement to the spleen on both the arterial and portal CT phases (Fig. 11) even though we also initially missed the findings. When epidermoid cysts of an accessory spleen are small and asymptomatic, surgery might not be necessary. However, in clinical practice, it is safe and reasonable to perform surgical resection because the possibility of malignancy cannot be completely excluded. In general, en-bloc resection of the cyst of the accessory spleen, including obtaining normal margins of the pancreatic tissue, is recommended.
CONCLUSION
Not only the radiologic findings, but also its typical location may be helpful in arriving at the diagnosis of an IPAS as it has similar characteristics to those of the spleen on both the precontrast and contrast-enhanced images of all imaging modalities. In particular, inhomogeneous enhancement of an IPAS on the early phases, which is known to have the characteristic enhancement pattern of the spleen, may be a diagnostic clue. In addition to Tc-99m HDRBC scintigraphy, SPIO-enhanced MRI and Levovist-enhanced US, the mechanisms that are theoretically similar to that of Tc-99m scintigraphy can be used as an alternative tool to confirm the diagnosis of IPAS. IPAS shows a significant signal drop that is similar to the spleen on the SPIO-enhanced T2 or T2*-weighted image and prolonged enhancement is seen on the delayed hepatosplenic phase of contrast-enhanced US. Familiarity with the spectrum of imaging findings is essential for making the correct diagnosis of IPAS.
References
- 1.Movitz D. Accessory spleens and experimental splenosis. Principles of growth. Chic Med Sch Q. 1967;26:183–187. [PubMed] [Google Scholar]
- 2.Halpert B, Gyorkey F. Lesions observed in accessory spleens of 311 patients. Am J Clin Pathol. 1959;32:165–168. doi: 10.1093/ajcp/32.2.165. [DOI] [PubMed] [Google Scholar]
- 3.Eraklis AJ, Filler RM. Splenectomy in childhood: a review of 1413 cases. J Pediatr Surg. 1972;7:382–388. doi: 10.1016/0022-3468(72)90006-1. [DOI] [PubMed] [Google Scholar]
- 4.Harris GN, Kase DJ, Bradnock H, Mckinley MJ. Accessory spleen causing a mass in the tail of the pancreas: MR imaging findings. AJR Am J Roentgenol. 1994;163:1120–1121. doi: 10.2214/ajr.163.5.7976887. [DOI] [PubMed] [Google Scholar]
- 5.Hamada T, Isaji S, Mizuno S, Tabata M, Yamagiwa K, Yokoi H, et al. Laparoscopic spleen-preserving pancreatic tail resection for an intrapancreatic accessory spleen mimicking a nonfunctioning endocrine tumor: report of a case. Surg Today. 2004;34:878–881. doi: 10.1007/s00595-004-2839-9. [DOI] [PubMed] [Google Scholar]
- 6.Davidson ED, Campbell WG, Hersh T. Epidermoid splenic cyst occurring in an intrapancreatic accessory spleen. Dig Dis Sci. 1980;25:964–967. doi: 10.1007/BF01308048. [DOI] [PubMed] [Google Scholar]
- 7.Kim SH, Lee JM, Han JK, Lee JY, Kang WJ, Jang JY, et al. MDCT and superparamagnetic iron oxide (SPIO)-enhanced MR findings of intrapancreatic accessory spleen in seven patients. Eur Radiol. 2006;16:1887–1897. doi: 10.1007/s00330-006-0193-6. [DOI] [PubMed] [Google Scholar]
- 8.Subramanyam BR, Balthazar EJ, Horii SC. Sonography of the accessory spleen. AJR Am J Roentgenol. 1984;143:47–49. doi: 10.2214/ajr.143.1.47. [DOI] [PubMed] [Google Scholar]
- 9.Kim SH, Lee JM, Lee JY, Han JK, Choi BI. Contrast-enhanced sonography of intrapancreatic accessory spleen in six patients. AJR Am J Roentgenol. 2007;188:422–428. doi: 10.2214/AJR.05.1252. [DOI] [PubMed] [Google Scholar]
- 10.Paterson A, Frush DP, Donnelly LF, Foss JN, O'Hara SM, Bisset GS., 3rd A pattern-oriented approach to splenic imaging in infants and children. Radiographics. 1999;19:1465–1485. doi: 10.1148/radiographics.19.6.g99no231465. [DOI] [PubMed] [Google Scholar]
- 11.Blomley MJ, Kormano M, Coulden R, Lim-Dunham J, Dawson P, Lipton MJ. Splenic blood flow: evaluation with computed tomography. Acad Radiol. 1997;4:13–20. doi: 10.1016/s1076-6332(97)80155-9. [DOI] [PubMed] [Google Scholar]
- 12.Stabile Ianora AA, Muscogiuri E, Scardapane A, Angelelli G. Multislice CT in the study of insulinomas: preliminary experience. Radiol Med (Torino) 2004;107:325–331. [PubMed] [Google Scholar]
- 13.Ichikawa T, Peterson MS, Federle MP, Baron RL, Haradome H, Kawamori Y, et al. Islet cell tumor of the pancreas: biphasic CT versus MR imaging in tumor detection. Radiology. 2000;216:163–171. doi: 10.1148/radiology.216.1.r00jl26163. [DOI] [PubMed] [Google Scholar]
- 14.Sica GT, Reed MF. Case 27: intrapancreatic accessory spleen. Radiology. 2000;217:134–137. doi: 10.1148/radiology.217.1.r00oc30134. [DOI] [PubMed] [Google Scholar]
- 15.Ota T, Tei M, Yoshioka A, Mizuno M, Watanabe S, Seki M, et al. Intrapancreatic accessory spleen diagnosed by technetium-99m heat-damaged red blood cell SPECT. J Nucl Med. 1997;38:494–495. [PubMed] [Google Scholar]
- 16.Ding H, Kudo M, Onda H, Nomura H, Haji S. Sonographic diagnosis of pancreatic islet cell tumor: value of intermittent harmonic imaging. J Clin Ultrasound. 2001;29:411–416. doi: 10.1002/jcu.1058. [DOI] [PubMed] [Google Scholar]
- 17.Van Hoe L, Gryspeerdt S, Marchal G, Baert AL, Mertens L. Helical CT for the preoperative localization of islet cell tumors of the pancreas: value of arterial and parenchymal phase images. AJR Am J Roentgenol. 1995;165:1437–1439. doi: 10.2214/ajr.165.6.7484581. [DOI] [PubMed] [Google Scholar]
- 18.Keogan MT, McDermott VG, Paulson EK, Sheafor DH, Frederick MG, de Long DM, et al. Pancreatic malignancy: effect of dual-phase helical CT in tumor detection and vascular opacification. Radiology. 1997;205:513–518. doi: 10.1148/radiology.205.2.9356637. [DOI] [PubMed] [Google Scholar]
- 19.Carlson B, Johnson CD, Stephens DH, Ward EM, Kvols LK. MRI of pancreatic islet cell carcinoma. J Comput Assist Tomogr. 1993;17:735–740. doi: 10.1097/00004728-199309000-00013. [DOI] [PubMed] [Google Scholar]
- 20.Sahani D, Prasad SR, Maher M, Warshaw AL, Hahn PF, Saini S. Functioning acinar cell pancreatic carcinoma: diagnosis on mangafodipir trisodium (Mn-DPDP)-enhanced MRI. J Comput Assist Tomogr. 2002;26:126–128. doi: 10.1097/00004728-200201000-00019. [DOI] [PubMed] [Google Scholar]
- 21.Ng CS, Loyer EM, Iyer RB, David CL, DuBrow RA, Charnsangavej C. Metastases to the pancreas from renal cell carcinoma: findings on three-phase contrast-enhanced helical CT. AJR Am J Roentgenol. 1999;172:1555–1559. doi: 10.2214/ajr.172.6.10350288. [DOI] [PubMed] [Google Scholar]
- 22.Kelekis NL, Semelka RC, Siegelman ES. MRI of pancreatic metastases from renal cancer. J Comput Assist Tomogr. 1996;20:249–253. doi: 10.1097/00004728-199603000-00015. [DOI] [PubMed] [Google Scholar]
- 23.Higaki K, Jimi A, Watanabe J, Kusaba A, Kojiro M. Epidermoid cyst of the spleen with CA19-9 or carcinoembryonic antigen productions: report of three cases. Am J Surg Pathol. 1998;22:704–708. doi: 10.1097/00000478-199806000-00007. [DOI] [PubMed] [Google Scholar]
- 24.Sonomura T, Kataoka S, Chikugo T, Hirooka T, Makimoto S, Nakamoto T, et al. Epidermoid cyst originating from an intrapancreatic accessory spleen. Abdom Imaging. 2002;27:560–562. doi: 10.1007/s00261-001-0145-1. [DOI] [PubMed] [Google Scholar]
- 25.Horibe Y, Murakami M, Yamao K, Imaeda Y, Tashiro K, Kasahara M. Epithelial inclusion cyst (epidermoid cyst) formation with epithelioid cell granuloma in an intrapancreatic accessory spleen. Pathol Int. 2001;51:50–54. doi: 10.1046/j.1440-1827.2001.01155.x. [DOI] [PubMed] [Google Scholar]


