Abstract
Objective
The CT accreditation program was established in 2004 by the Korean Institute for Accreditation of Medical Image (KIAMI) to confirm that there was proper quality assurance of computed tomography (CT) images. We reviewed all the failed CT phantom image evaluations performed in 2005 and 2006.
Materials and Methods
We analyzed 604 failed CT phantom image evaluations according to the type of evaluation, the size of the medical institution, the parameters of the phantom image testing and the manufacturing date of the CT scanners.
Results
The failure rates were 10.5% and 21.6% in 2005 and 2006, respectively. Spatial resolution was the most frequently failed parameter for the CT phantom image evaluations in both years (50.5% and 49%, respectively). The proportion of cases with artifacts increased in 2006 (from 4.5% to 37.8%). The failed cases in terms of image uniformity and the CT number of water decreased in 2006. The failure rate in general hospitals was lower than at other sites. In 2006, the proportion of CT scanners manufactured before 1995 decreased (from 12.9% to 9.3%).
Conclusion
The continued progress in the CT accreditation program may achieve improved image quality and thereby improve the national health of Korea.
Keywords: Computed tomography (CT), Quality assurance, Image quality, Phantoms
Computed tomography (CT) has been used in Korea as an imaging diagnostic tool since the late 1980s. Nonetheless, little systematic attention was paid to the CT imaging quality until the early 2000s. Maintaining the image quality is very important because it is a prerequisite for making accurate diagnoses at medical institutions.
The Korean Institute for Accreditation of Medical Image (KIAMI) was established in 2004 under the Ministry of Health and Welfare to evaluate the quality of medical images and perform medical imaging quality tests to improve the national health (1). The equipment that was evaluated in this quality assurance program included approximately 1,500 CT scanners, 300 magnetic resonance imaging (MRI) machines and 5,000 mammography scanners. The annual document evaluations via documentation and hands on evaluation (every 3 years) were performed according to the regulations of the KIAMI. The CT accreditation program involves reviewing the standards of a facility, the personnel information, the quality control procedure records and evaluating both phantom and clinical images (1-3).
To the best of our knowledge, performance tests using a CT phantom have been administered worldwide for a long time. However, no Korean studies on a nationwide scale have been reported that analyzed the results based on a standard of accreditation or failure with performing phantom testing.
In our report, we analyzed 604 failed CT phantom image evaluations that were conducted by the KIAMI in 2005 and 2006 (1). We discuss the effect of image quality control by the CT accreditation program through an analysis on the cause of the failures, and we compared the results obtained in 2005 and 2006.
MATERIALS AND METHODS
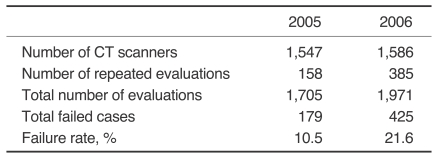
From January 2005 to December 2006, the quality of images with using a CT phantom was evaluated from 1,547 and 1,586 CT scanners in 2005 and 2006, respectively. Repeated failure of the evaluations at one medical institution was determined to be a distinct case. One hundred fifty-eight and 385 cases were retested in 2005 and 2006, respectively; thus, a total of 1,705 and 1,971 CT phantom image evaluations were performed for 2005 and 2006, respectively (Table 1). The manufacturing dates of the CT scanners ranged from 1985 to 2006, and any CT scanner with an unknown manufacturing date was suspected to be a machine made before 1985 or a recycled machine (1).
Table 1.
Total Number of CT Phantom Image Evaluations and Total Failure Rate in 2005 and 2006
CT Accreditation Program of the KIAMI
The KIAMI's CT accreditation program involved examining the standards of a facility, the personnel information and the quality control procedure records and evaluating the phantom and clinical images (1).
The accreditation program was divided into three different types: an annual document evaluation, close evaluation every three years and entry evaluation for new equipment (1). The document evaluation reviewed the facility, personnel, quality control procedure records, and phantom images. For the close evaluation, the clinical images were also evaluated in addition to conducting evaluation via the documentation. No clinical images or quality control procedure records were submitted with the entry evaluation (1).
If a CT unit did not pass any part of an evaluation (e.g., the phantom or clinical), then the CT unit must be taken out of service (1). After corrective action, the facility reapplies for accreditation by repeating only the deficient test (1). We named this as "repeated evaluation". In the first year of this program, both the first year close evaluation and the second year document evaluation were performed at some facilities at the same time because of an adjustment in the evaluation period. This was called the "document with close evaluation". Actually, this evaluation was identical to the close evaluation.
In the document evaluation, all the testing materials, including all the documents and the phantom images, were submitted to the KIAMI for evaluation. The phantom images were obtained at the facility by radiological technologists (1).
For the close evaluation, the entry evaluation and the repeated evaluation, the KIAMI staff visited the site to supervise the CT phantom testing, to validate the quality control procedures and to obtain the clinical images (1).
The accreditation process and standards, including the criteria for passing or failing and the reference level, were developed and implemented by the KIAMI based on the standards of the American College of Radiology (ACR) and there was a detailed analysis of the results of the actual circumstances for the quality control before any accreditation programs existed in Korea.
The phantom and clinical images could be submitted to the KIAMI in either hard or soft copy. The review processes were performed in the reading room of the KIAMI with using a commercially available PACS system and a view box.
CT Phantom Image Evaluation
CT Phantom testing was performed using the AAPM (American Association of Physicists in Medicine) CT Performance Phantom Model 76 410 (Fluke Biomedical, Cleveland, OH) on the CT scanners in the medical institutions nationwide (1-4). The specific performance parameters evaluated in the CT phantom testing were the CT number for water, the noise, the image uniformity, the spatial resolution, the low contrast resolution, the slice thickness, the artifacts and the alignment of a central line (1-3, 5, 6). The phantom images were obtained using the following imaging protocol: a 50 cm scan field of view (FOV) and a 25 cm display FOV with a standard reconstruction algorithm. A 120 kVp tube voltage and 250 mA tube current were applied, and then a single slice scan (not a spiral scan) was acquired (2, 3). 10-mm collimation was applied for all the parameters except for the slice thickness (2, 3).
Standard for CT Phantom Image Evaluation
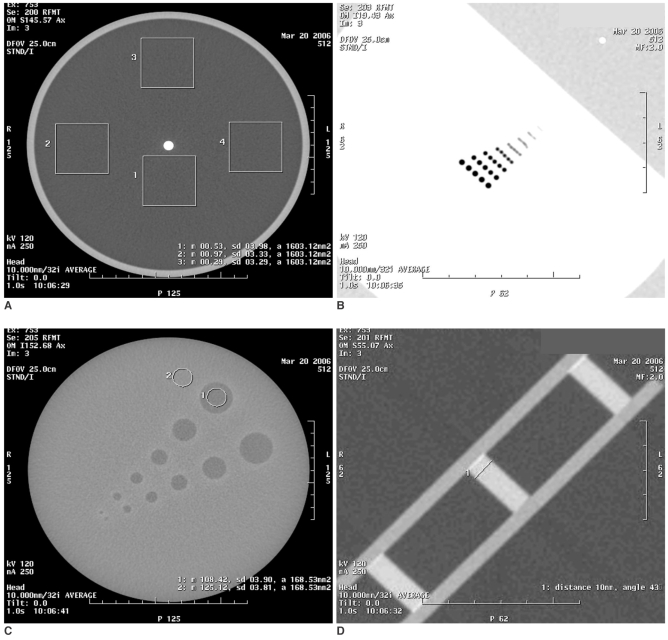
For the CT number of the water, the noise and the image uniformity, the central area of the water-filled CT number calibration block was imaged. A 4 × 4 cm2 cursor from the center of the phantom was established in the quadrant at the 6 o'clock position by applying the region of interest (ROI) analysis function of the equipment. In addition, the mean CT number and the standard deviation were measured (2, 3). These values were defined as the CT number of the water and noise, respectively. For these measurements, the window width of the image was 300 to 400 Hounsfield units (HU) and the window level was 0 ± 100 HU. The mean CT number of water must be between -10 and +10 HU (Table 2). The noise value must be less than 8 HU (Fig. 1A). Image uniformity was quantified by measuring the mean CT number of the water in an ROI with its center at 2/3 the distance from the center of the phantom to the edge at the 3 o'clock, 9 o'clock and 12 o'clock positions (positions of the cursors 2, 3 and 4 in Fig. 1A) and then calculating the absolute values of the mean CT number of cursor 1 - the mean CT number of cursor 2, 3 or 4 (2, 3). For the uniform images, the mean CT number difference must be less than 4 HU for each of the three edge positions (Fig. 1A).
Table 2.
Standards of Parameters used for CT Phantom Image Testing
Fig. 1.
Images of AAPM CT performance phantom.
A-D. Images for CT number of water, noise and image uniformity (A), spatial resolution (B), low contrast resolution (C), and slice thickness (D).
An acrylic equivalent test object was used for the spatial resolution. The object had eight sets of air-holes (five holes per set) with diameters of 1.75, 1.5, 1.25, 1.00, 0.75, 0.61, 0.50 and 0.40 mm. At the time of measurement, the window width was 300 to 400 HU, and the window level was 200 to 100 HU. The 1 mm holes must be clearly resolved to pass the test (Fig. 1B) (2, 3).
To evaluate the low contrast resolution, a solid, acrylic equivalent disk with 12 fillable cavities was used. Pairs of cavities with diameters of 25.4, 19.1, 12.7, 9.5, 6.4 and 3.2 mm were spaced center-to-center at twice their diameter along a centerline. The cavities were filled from the outside with either dextrose or a sodium chloride solution plus iodine contrast. The linear attenuation coefficients between the cavities and the background differed by about 2% (20 HU). At the time of measurement, the window width was 300 to 400 HU and the window level was 0 to 100 HU. One of the two 9.5 mm cavities must be clearly visible to pass this test (Fig. 1C) (2, 3).
To evaluate the accuracy of the slice thickness, 5 mm and 10 mm thicknesses were measured by a single slice scan. The thickness was measured with the window width set at 300 to 400 HU and the window level was set at 0 to 100 HU (2, 3). The full width at half maximum was determined for the measurement. The measured slice thickness must be within 1 mm difference of the prescribed width to pass this test (Fig. 1D) (2, 3).
Not only should there be no artifacts, but the centerline should also be aligned superiorly and inferiorly, as well as the right and left, by less than ± 5.0 mm for a scanner to be accredited (2, 3). The summary of each standard is shown in Table 2. If any one of these CT phantom testing parameters showed failure, then the CT phantom image evaluation was considered a failure (1).
The phantom images were independently assessed by at least two KIAMI-trained radiologist reviewers. If there was a disagreement in the outcome between the two reviewers, then the images were independently evaluated by three more reviewers for arbitration. Based on the results of these five reviewers, the final decision was determined by the majority (2, 3).
To ensure that the evaluations were correct, the reviewers were volunteers who were currently practicing in Korea. They were not employees of the KIAMI. All the image reviewers must be certified by the Korean Board of Radiology and they must have at least two years of experience after residency in diagnostic radiology. The reviewers were required to attend annual refresher courses conducted by the KIAMI.
Methods
Based on the tests described above, 604 cases failed from 2005 to 2006. Some cases failed on several parameters. Thus, 710 failed items were shown. We analyzed the results according to the size of the medical institution: general hospital, hospital or clinic. The classification was based on the medical service law of Korea. General hospitals were defined as medical institutions equipped with more than 100 beds and they had more than nine medical departments, including internal medicine, surgery, pediatrics, gynecology, radiology, anesthesiology, laboratory medicine or pathology, psychiatry and dentistry. Hospitals were defined as medical institutions established by medical doctors and equipped with facilities having more than 30 beds. Clinics were defined as medical institutions where medical doctors practiced and where the facilities were sufficient to perform treatments without impediment, but the clinics did not meet the criteria for a hospital or general hospital (1). We also analyzed the results according to manufacture's date of the CT scanner: from 2001 to 2006, from 1995 to 2000, from 1991 to 1994, from 1985 to 1990 and unknown. We defined machines manufactured prior to 1995 as obsolete ones.
For the results of the CT phantom image evaluation conducted up to present, we analyzed the total failure rate in 2005 and 2006 and the failure rate of each type of evaluation (document evaluation/close evaluation/entry evaluation for new equipment/repeated evaluation/document with close evaluation), the failure rate according to the size of the medical institution, the failure rate of each parameter of the CT phantom image testing, the failure rate of each of the parameters of the CT phantom testing according to the size of the medical institution, and the proportion and failure rate according to the manufacturing date of the CT. A comparison of the failure rates or proportions between the years 2005 and 2006 was done according to the evaluation type, the size of the medical institution, each parameter of the CT phantom image testing and the manufacturing date of the CT.
The differences in these results were assessed using the Mann-Whitney test and the Kruskal Wallis test. SPSS software (Version 13.0, Statistical Package for the Social Sciences, Chicago, IL) was used for the statistical evaluation.
RESULTS
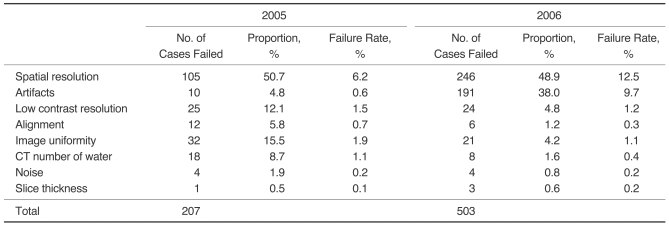
Phantom image evaluations were performed on 1,547 and 1,586 CT scanners and 158 and 385 cases were retested in 2005 and 2006, respectively; thus, a total of 1,705 and 1,971 cases of CT phantom image evaluation were performed for 2005 and 2006, respectively (Table 1). The total number of failed cases was 179 in 2005 and 425 in 2006, and the respective failure rates for accreditation were 10.5% and 21.6%, respectively (Table 1). Concerning the parameters of the CT phantom image testing, the total number of failed items was 207 in 2005 and 503 in 2006 because some cases failed several parameters.
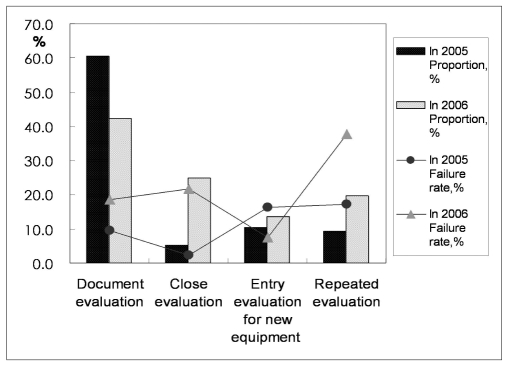
In 2005, there were a total of 1,705 cases that included 1,030 (60.4%) document evaluations, 90 (5.3%) close evaluations, 178 (10.4%) entry evaluations for new equipment, 158 (9.3%) repeated evaluations and 249 (14.6%) document with close evaluations. Among a total of 179 failed cases in 2005, there were 98 (54.7%) document evaluations, two (1.1%) close evaluations, 29 (16.2%) entry evaluations for new equipment, 27 (15.1%) repeated evaluations and 23 (12.8%) document with close evaluations. The failure rate was 9.5% (98/1,030) for the document evaluation, 2.2% (2/90) for the close evaluation, 16.3% (29/178) for the entry evaluation for new equipment, 17.1% (27/158) for the repeated evaluation and 9.2% (23/249) for the document with close evaluation (Table 3).
Table 3.
Failure Rates in 2005 and 2006 for Each Type of Phantom Image Evaluation
Note.-No = Number of each type of phantom image evaluation, No. of failures = Number of failed cases for each type of phantom image evaluation Proportion # = Number of each type/total number×100, Failure rate = Number of failed cases for each type/total number×100
In 2006, there was a total of 1,971 cases that included 831 (42.2%) document evaluations, 488 (24.8%) close evaluations, 266 (13.5%) entry evaluations for new equipment, 385 (19.5%) repeated evaluations and one (0.1%) document with close evaluations. Among the 425 failed cases, there were 153 (36%) document evaluations, 106 (24.9%) close evaluations, 20 (4.7%) entry evaluations for new equipment, 145 (34.1%) repeated evaluations and one (0.2%) document with close evaluation. The failure rate for the document evaluation was 18.4% (153/831), that for the close evaluation was 21.7% (106/488), that for the entry evaluation for new equipment was 7.5% (20/266), that for the repeated evaluation was 37.7% (145/385) and that for the document with close evaluation was 100% (1/1) (Table 3).
The document evaluation, which contained the phantom image evaluation, was the most frequent type of CT accreditation program performed during the two-year period. Compared with 2005, the total failure rate doubled in 2006 (10.5% to 21.6%, p = 0.000), and the failure rate of the document evaluation also approximately doubled in 2006 (9.5% to 18.4%, p = 0.000). Furthermore, the failure rate of the close evaluation (2.2% to 21.7%) and repeated evaluation (17.1% to 37.7%) increased more than the other test types in 2006 (Fig. 2).
Fig. 2.
Types of CT phantom image evaluation and failure rates in 2005 and 2006. Document evaluation was most frequent type of phantom image evaluation during this two-year period. In 2006, total failure rate doubled relative to that in 2005. Difference in failure rates between 2005 and 2006 was more than twice that for close evaluation and repeated evaluation, although it was almost twice or less than twice that of other types of evaluation (see line graph). Failure rates of close evaluation and repeated evaluation were higher.
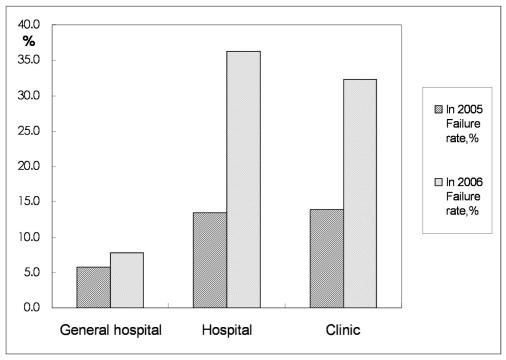
In 2005, the test was performed on 413 CT scanners in general hospitals, on 551 CT scanners in hospitals and on 583 CT scanners in clinics. The number of failed cases was 24, 74 and 81, respectively, for each type of institution. Among the 179 failed cases, the distribution for each institution type was 13.4% (24/179), 41.3% (74/179) and 45.3% (81/179), respectively, and the failure rate, according to the type of medical institution, was 5.8% (24/413), 13.4% (74/551) and 13.9% (81/583), respectively. In 2006, the test was performed on 446 CT scanners in general hospitals, on 552 CT scanners in hospitals and on 588 CT scanners in clinics; the number of failed cases was 35, 200 and 190, respectively. Among the 425 failed cases, the respective distribution was 8.2% (35/425), 47.1% (200/425) and 44.7% (190/425), respectively, and the failure rate, according to the type of the medical institution, was 7.8% (35/446), 36.2% (200/552), and 32.3% (190/588), respectively (Table 4). General hospitals had a lower failure rate than the hospitals or clinics in 2005 and 2006 (p = 0.000). The hospitals and clinics showed no remarkable difference in failure rate both in 2005 (p = 0.820) and 2006 (p = 0.164). In 2006, the total failure rate doubled (from 10.5% to 21.6%); however, the failure rate of general hospitals did not significantly increased in 2006 (p = 0.239). Therefore, the increase in failed cases was largely attributed to the increased failure rates of hospitals or clinics (Fig. 3).
Table 4.
Size of Medical Institutions: Failure Rates in 2005 and 2006
Note.-No. = Number of medical institutions (case), No. of failures = Number of failed cases for each size of medical institution, Failure rate = Number of failed cases for each size medical institution/total number of cases×100.
Fig. 3.
Failure rates for various sized medical institutions in 2005 and 2006. General hospitals showed lower total failure rate than hospitals or clinics in 2005 and 2006. Generally, in 2006 total failure rate doubled relative to 2005; however, failure rate at general hospitals did not increase at same level. Therefore, most of increase of failed cases occurred in hospitals and clinics.
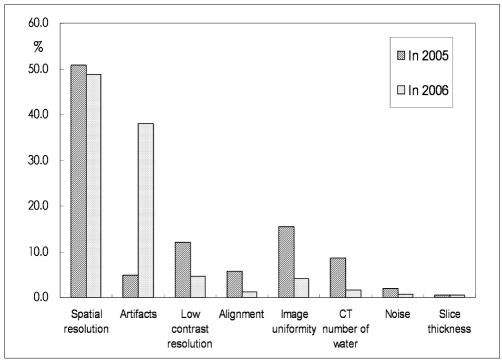
Among the parameters of the CT phantom image testing, the most common parameter that showed failure was the spatial resolution in both 2005 and 2006 (50.7% and 48.9%, respectively). In 2005, the frequencies of failure in decreasing order following spatial resolution were: image uniformity (15.5%), low contrast resolution (12.1%), the CT number of water (8.7%), alignment (5.8%), artifacts (4.8%), noise (1.9%), and slice thickness (0.5%). In 2006, the frequencies of failure in decreasing order following spatial resolution were: artifacts (38%), low contrast resolution (4.8%), image uniformity (4.2%), the CT number of water (1.6%), alignment (1.2%), noise (0.8%) and slice thickness (0.6%) (Table 5, Fig. 4). The failure rate of each parameter was the value of ([the number of failures for the given parameter/the total number of CT phantom image evaluations]×100). In 2005, the failure rate of each parameter was 6.2% (105/1,705) for spatial resolution, 0.6% (10/1,705) for artifacts, 1.5% (25/1,705) for low contrast resolution, 0.7% (12/1,705) for alignment, 1.9% (32/1,705) for image uniformity, 1.1% (18/1,705) for the CT number of water, 0.2% (4/1,705) for noise and 0.1% (1/1,705) for slice thickness. In 2006, the failure rate was 12.5% (246/1,971) for spatial resolution, 9.7% (191/1,971) for artifacts, 1.2% (24/1,971) for low contrast resolution, 0.3% (6/1,971) for alignment, 1.1% (21/1,971) for image uniformity, 0.4% (8/1,971) for the CT number of water, 0.2% (4/1,971) for noise and 0.2% (3/1,971) for slice thickness (Table 5).
Table 5.
Parameters of CT Phantom Image Testing and Rate of Failure for Each Parameter in 2005 and 2006
Note.-No. of cases failed = Number of cases that failed a parameter, Proportion = Number of cases that failed parameter/total number cases that failed a parameter×100, Failure rate = Number of cases that failed the parameter/total number of CT phantom images tested×100.
Fig. 4.
Failure rates for each parameter of CT phantom image testing in 2005 and 2006. Spatial resolution was most commonly failed parameter in 2005 and 2006. Failure due to artifacts markedly increased in 2006. Number of cases that failed for low contrast resolution, alignment, image uniformity and CT number of water decreased in 2006.
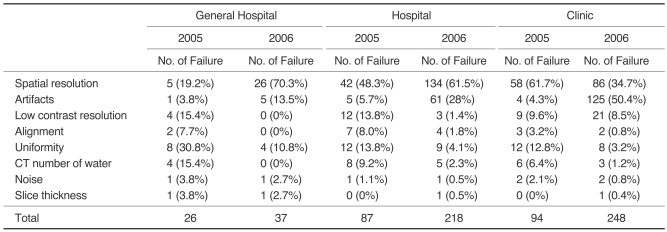
Table 6 showed the failure rate for each parameter of the CT phantom testing in 2005 and 2006 according to the size of the medical institution. The pattern of changes for the failed parameters in 2005 and 2006 was independent of the size of the medical institution. In terms of the overall failure in 2005 and 2006, hospitals were responsible for 41.3% and 47.1%, respectively, while clinics were responsible for 45.3% and 44.7%, respectively. In the general hospitals, the image uniformity was the most commonly failed parameter in 2005 and spatial resolution was the most commonly failed parameter in 2006. In hospitals, the spatial resolution was the most frequently failed parameter in both years. In clinics, the spatial resolution was the most frequently failed parameter in 2005 and artifacts was the most commonly failed parameter in 2006 (Table 6). Most of the failed cases of spatial resolution, low contrast resolution and artifacts were in hospitals and clinics in both years. In particular, most of the failed cases due to low contrast resolution (87.5%) and artifacts (65.4%) were seen in clinics in 2006 (Table 7).
Table 6.
Proportion of Each Parameter of CT Phantom Testing Relative to Total Failed Parameters in 2005 and 2006, According to Size of Medical Institution
Note.-No. of failure = Number of failures for each parameter relative to the total number of failed cases.
Table 7.
Proportion of Failed Cases According to Size of Medical Institution in Terms of Parameters of CT Phantom Image Testing in 2005 and 2006
Note.-Proportion = Number of failed cases for each parameter/total number of failed cases ×100, unit (%).
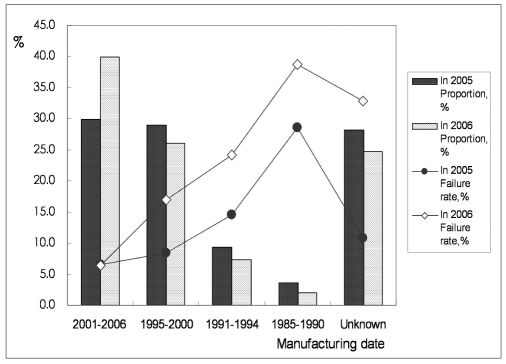
Table 8 and Figure 5 showed the proportion and failure rate in 2005 and 2006 according to the CT scanner manufacturing date. As the CT scanner increase in age, the failure rate increased (p = 0.000). The CT scanners that were tested and known to be manufactured prior to 1995 were 12.9% (200/1,547) in 2005 and 9.3% (147/1,586) in 2006 (Table 8, Fig. 5). Among all the CT scanner, the proportion of CT scanners tested in 2005 with an unknown manufacturing date (assumed to be manufactured before 1985) was 28.1% (435/1,547) and in that in 2006 was 24.7% (392/1,586). This indicated a significant decrease (p = 0.000) in 2006 for the proportion and absolute number of obsolete machines and machines with unknown manufacturing dates.
Table 8.
Proportion and Failure Rate in 2005 and 2006 According to Manufacturing Date of CT Equipment
Note.-No. of CT = Number of CT scanners made during each period of time, No. of failure = Number of failed CT scanners from each period of time, Failure rate = Number of failed CT scanners from each period of time/ total number of failed CT scanners ×100.
Fig. 5.
Proportion and failure rate in 2005 and 2006 according to manufacturing date of CT scanners. In 2005 and 2006, high failure rate was shown for CT scanners manufactured between 1985 and 1994, whereas failure rate was relatively low for CT scanners manufactured between 2001 and 2006 (see line graph). In addition, proportion of failures for CT scanners manufactured prior to 1995 and CT scanners with unknown manufacturing dates decreased in 2006 (see bar graph).
DISCUSSION
From 2005 to 2006, the number of CT phantom image evaluations increased from 1,705 to 1,971 and the failure rate increased from 10.5% to 21.6%. There was no change in the standards of the CT phantom image evaluation in 2006, yet the failure rate increased. The reasons for the increased failure rates in 2006 are thought to be as follows.
First, the percentage of close evaluations increased in 2006. The close evaluations consisted of 24.8% of the total cases in 2006, which was a great increase compared with 5.3% in 2005. This increase is attributable to the KIAMI's policy that requires document evaluation in the first and second years and a comprehensive test in the third year (1-3). The document evaluations were conducted in the medical institutions and the resulting images of the phantom testing were submitted, but the KIAMI staff visited the medical institutions for the close evaluations and they supervised the CT phantom testing (1-3). Because of the more stringent method employed for the close evaluation, it had a higher failure rate and thus, the total number of failed cases increased in 2006 compared with 2005 (24.9% in 2006 from 1.1% in 2005).
Second, for the repeated evaluation, the failure rate in 2005 was 17.1% and that in 2006 was 37.7%. These values were higher in comparison with the overall failure rates, which were 10.5% and 21.6% in 2005 and 2006, respectively. The repeated evaluations were more frequent in 2006 (158 cases in 2005 and 385 cases in 2006) and the failure rate was also greatly increased. We hypothesize that the increased usage of the repeated evaluation could be the cause of the overall increased failure rate in 2006.
The failure rates were different according to the type of medical institution. General hospitals showed lower failure rates than did the hospitals and clinics in both years. In terms of the overall failure in 2005 and 2006, hospitals and clinics were responsible for most of the failed cases. In particular, the failure rates for the parameters of spatial resolution, artifacts and low contrast resolution for the general hospitals were noticeably lower than those of the hospitals and clinics. This difference in failure rates is thought to be caused by the presence of radiologists, who are able to oversee the image quality in general hospitals, and the tendency of general hospitals to have the newest CT machines. In Korea, CT scanners can be used even though there is no radiologist at the medical institution. Thus, there are a large number of hospitals and clinics with no radiologist at the medical institution. Therefore, in the future, accreditation efforts may need to be focused more on hospitals and clinics. To that end, education on the quality control of medical imaging for the managers of CT scanners at medical institutions may be important.
The major failed parameters were the spatial resolution and artifacts. Among the parameters of the CT phantom image testing, the spatial resolution had the highest failure rate in both 2005 and 2006 (50.7% and 48.9%, respectively) (Table 5, Fig. 4). This was likely due to the fact that the standard for the spatial resolution (the test standard) was stricter than that for the other tested parameters (3). During the initial stage of the accreditation process in Korea, the standards of the CT phantom accreditation program were more lenient than the standards of the ACR, except for the standard of spatial resolution, which was identical to that of the ACR (3, 5).
The proportion of the artifacts among the failed parameters increased greatly from 4.8% in 2005 to 38% in 2006, which was likely due to the enforcement of detailed standards and an increased detection rate that was due to better education for the reviewers. The standard for artifacts was simply the presence or absence of an artifact on the CT phantom image. Therefore, this did not mean that there was a new, detailed standard for artifacts in 2006, but rather that the reviewer determined whether or not artifacts were present under stricter subjective standards after being educated with using a variety of artifact examples.
Artifacts and noise are the two biggest limitations for image quality (7). The failure rate of noise in 2005 and 2006 was very low, with values of 0.2% and 0.2%, respectively (Table 5). This was likely because the standard for judging noise that was set by the KIAMI (8 HU) was more lenient than the ACR standard (5 HU) (3). Because there is a small difference in the attenuation coefficients of normal and pathological tissues (8), noise, which is characterized by a grainy appearance of the images, is the most important limiting factor of CT image quality (7, 8). Furthermore, low contrast resolution is limited by noise, that is, as noise increases, the low contrast resolution decreases and this inhibits visualization of the slight differences in the tissue density (7, 9). Noise is shown as an objective number in the CT phantom testing, and so the standard for judging noise should be as stringent as the ACR standard.
In addition, the proportion of image uniformity, low contrast resolution and the CT number of water decreased from 15.5% to 4.2%, from 12.1% to 4.8% and from 8.7% to 1.6%, respectively, from 2005 to 2006. Moreover, the number of failed cases also decreased in 2006. This implies that the decreased frequency of failed cases was due to those parameters that can be feasibly improved by basic calibration of CT scanners. Thus, proper beforehand inspection and management of CT scanners by the medical institutions should show a positive change by instituting better quality control.
We performed an analysis of the parameters of phantom testing with respect to the CT scanner manufacturing dates. For the CT scanners manufactured between 1985 and 1990, a high failure rate (28.6% and 38.7%) was shown in 2005 and 2006, respectively. In contrast, CT scanners manufactured between 2001 and 2006 exhibited a low failure rate of 6.5%. The proportion of CT scanners manufactured prior to 1995 and the CT scanners with unknown manufacturing dates decreased from 2005 to 2006. This showed a positive change in eliminating obsolete machines due to the CT accreditation program. Nevertheless, for those CT scanners manufactured before 1995 or those with an unknown manufacturing date, the failure rate was relatively high, which highlighted the need for intensive control of such machines.
Failure of the parameters of the CT phantom image evaluation was reduced in part through the CT accreditation program, and the proportion of obsolete CT scanners was decreased. This was considered to be a positive change caused by the CT accreditation program. In past two years, the general hospitals showed low failure rates, which affirmed the importance of radiologists for adequate quality control and the elimination of old CT scanners. In addition, the increase in the failure of some parameters, such as artifacts, was considered to directly exemplify the improved quality control due to educating the reviewers.
Following a review of the CT phantom image evaluation results accrued during 2005 and 2006, it was then necessary to control and more stringently manage certain standards that had been more lenient than those set by the ACR. New KIAMI standards have been suggested and they are currently being applied.
In conclusion, continued progress in the CT accreditation program, as reported here for 2005 and 2006, may achieve improved image quality and so improve Korea's national health.
References
- 1.Im TH, Na DG. Annual report No.1 2004~2006. Seoul: Korean Institute for Accreditation of Medical Image (KIAMI); 2007. pp. 1–28.pp. 75–105. [Google Scholar]
- 2.Department of education, KIAMI. The workshop for the examiners on quality assurance program (2005) Seoul: KIAMI; 2005. pp. 13–31. [Google Scholar]
- 3.Department of education, KIAMI. The workshop for the examiners of quality assurance program (2006) Seoul: KIAMI; 2006. pp. 141–177. [Google Scholar]
- 4.Nuclear Associates 76-410-4130 and 76-411, AAPM CT Performance Phantom, Users Manual. Fluke Corporation; 2005. Mar, [Google Scholar]
- 5.American Colleges of Radiology (ACR) CT accreditation program requirement. http://www.acr.org/accreditation/computed/ct_reqs.aspx. [Google Scholar]
- 6.McCollough CH, Bruesewitz MR, McNitt-Gray MF, Bush K, Ruckdeschel T, Payne JT, et al. The phantom portion of the American College of Radiology (ACR) computed tomography (CT) accreditation program: practical tips, artifact examples, and pitfalls to avoid. Med Phys. 2004;31:2423–2442. doi: 10.1118/1.1769632. [DOI] [PubMed] [Google Scholar]
- 7.Reddinger W. CT image quality; OutSource, Inc. 1998. http://www.e-radiography.net/mrict/CT_IQ.pdf.
- 8.Judy PF, Balter S, Bassano D, McCullough EC, Payne JT, Rothenberg L. AAPM report No.1 phantoms of performance evaluation and quality assurance of CT scanner. Chicago, Illinois: AAPM; 1977. [Google Scholar]
- 9.Euclid S. Computed tomography: physical principles, clinical applications and quality assurance. Philadelphia: Saunders: 1994. pp. 174–199. [Google Scholar]


