Abstract
Background & Aims
One of the most common symptoms among patients with inflammatory bowel diseases (IBD) is diarrhea, which is thought to be contributed by changes in electrolyte transport associated with intestinal inflammation. This study is designed to test the hypothesis that intestinal Na+-related transporters/channels and their regulatory proteins may be down-regulated as a potential contributor to IBD-associated diarrhea.
Methods
SDS-PAGE and Western blotting and/or confocal immunomicroscopy were used to examine the expression of Na+/H+-exchangers 1-3 (NHE1-3), epithelial Na+ channel (ENaC), Na+/K+-ATPase, the intracellular Cl- channel 5 (ClC-5), and NHE3 regulatory factors (NHERF1 & 2), in ileal and colonic pinch biopsies from IBD patients and noninflammatory controls, as well as from colonic mucosa of DSS- and TNBS-induced acute murine IBD models.
Results
NHE1&3 (but not NHE2), β-ENaC, Na+/K+-ATPase-α, ClC-5 and NHERF1 were all down-regulated in sigmoid mucosal biopsies from most cases of active UC and/or CD, compared to controls. NHE3 was also decreased in ileal mucosal biopsies of active CD, as well as in ~50% of sigmoid biopsies from inactive UC or CD. Importantly, similar down-regulation of NHE1&3, β-ENaC, and NHERF1&2 was also observed in the mouse colon (but not ileum) of DSS- and TNBS-induced colitis.
Conclusions
IBD-associated diarrhea may be due to a coordinated down regulation of multiple Na+ transporter and related regulatory proteins, including NHE1&3, Na+/K+-ATPase, and ENaC, as well as NHERF1 & 2, and ClC-5, all of which are involved directly or indirectly in intestinal Na+ absorption.
Keywords: IBD, Na transport, NHE3, NHERF, diarrhea
Inflammatory bowel diseases (IBD) are generally classified into two subtypes: Crohn's disease (CD) and ulcerative colitis (UC) (37). Diarrhea is one of the most common symptoms among patients with IBD (21). Decreases in Na+ absorption and increases in Cl- secretion, resulting in impaired water transport, are thought to be the main electrolyte transport abnormalities in IBD-associated diarrhea (21;40). Other mechanisms contributing to diarrhea in IBD include short bowel, ileal disease (e.g. bile salt malabsorption), fistulae, maldigestion and bacterial overgrowth (45). Some of the earliest data supporting a role of dysregulated electrolyte transporters in IBD-associated diarrhea came from the observations that the levels of Na+ and Cl- in the stool of Crohn's colitis were elevated while stool pH was lower than that of control subjects (24;25).
IBD-associated diarrhea has also been attributed to elevated pro-inflammatory cytokines (which inhibit Na+ transport), such as tumor necrosis factor-α (TNF-α), interferon-γ (IFN-γ), and various interleukins (IL), including IL-4,6,8,12, & 13 (3-6;13;39;44) (see more details in Table S1). For example, IFN-γ inhibits intestinal transport by down-regulating Na+/K+-ATPase and Na+/K+/2Cl- (6). In rat intestine and intestinal epithelial cell models, TNF-α and IFN-γ down-regulate NHE3 (4;39). TNF-α inhibits NHE3 activity by increasing NHE3 internalization (13). In both DSS- and TNBS-induced mouse colitis models, we recently demonstrated that diarrhea were associated with significant elevation of various cytokines in colonic mucosa (1): In the acute DSS colitis model, Th1-Th2 cytokines (IL-6, IFNγ, and IL-17) were increased while Th1-Th17 cytokines (IL-12p40, IL-23p19, IFNγ, and IL-17) were up-regulated in acute TNBS colitis. In chronic colitis models, IL-6 and IFNγ (but not IL-12p40 &IL-17) were elevated in DSS colitis, while IL-12p40, IL-17, and particularly IL-IL23p19 were greatly increased in TNBS colitis. These data suggest that, although there are clear differences in the production of specific cytokines between the UC-like (DSS model) and CD-like (TNBS model), these cytokine differences result in a similar clinical consequence: diarrhea (1).
In addition, NHE3 activity in Caco-2 cells was inhibited in a dose-dependent fashion by nitric oxide (NO), over-production of which has been suggested to be involved in the pathogenesis of IBD (16). NHE3 plays a critical role in normal intestinal electro-neutral NaCl absorption, inhibition of which is an important mechanism for diarrheal diseases (15). In addition to active electrolyte transport across intestinal epithelial cells, altered epithelial paracellular permeability was also observed in IBD patients and associated with relapsing diarrhea (8;36). Proinflammatory cytokines disrupt epithelial barrier functions by either decreasing expression and/or causing mis-localization of tight-junction (TJ) complex proteins (11;23). Thus, impaired electrolyte transport, either transcellularly or paracellularly, contributes to IBD-associated diarrhea.
Down- or up-regulation of several membrane transporters in different models have been linked to IBD-associated diarrhea, including Na+/K+-ATPase (6;36;44), Na+ channel (ENaC) (3), Na+/H+ exchangers 1 &3 (NHE1 &3; in cell models only) (4;13;39), and Na+/K+/2Cl- (3;6) (see extensive list of transporters and relevant references in Suppl Table S1; S: Supplementary Data). While previous studies have enhanced our understanding of IBD-associated diarrhea, changes of epithelial transporters in cell culture or animal models may or may not reflect the changes in intestinal mucosa of IBD patients. In addition, previous human studies examined primarily the changes of transporter mRNA levels, which may or may not correlate with the changes at the protein levels of these transporters, the latter of which are much more reliable indicators for actual transport activity. Therefore, it is necessary to examine at the protein levels the changes in expression of relevant transporter in intestinal mucosa from IBD patients, and correlate them to disease activity. Here, we present data showing a coordinated down-regulation of Na+-related transporter proteins in both patients with active IBD and mice with well-established acute colitis induced by DSS or TNBS. Our data suggest that a common regulatory mechanism may exist to systematically down-regulate multiple intestinal Na+ transporters and functionally related proteins that are involved in intestinal Na+-absorption.
Materials and methods
Antibodies
Polyclonal antibodies: anti-NHE3 [Ab1381 and Ab1380 were used together for analysis NHE3 (30)], NHE1 and NHE2 [M. Tse, Johns Hopkins University (JHU)], NHERF1 &2 (C. Yun, Emory University), ClC-5 (S Guggino, JHU and Oliver Devuyst, Cambridge University), β-ENaC (M. Knepper, NHLBI, NIH), intestinal alkaline phosphatase (D. Alper, Washington Univ), and β-actin (Sigma); monoclonal antibodies: anti-Na+/K+-ATPase α-subunit (D. Fambrough, JHU) and anti-GAPDH (US Biological).
Patients and controls
The study population consisted of 51 patients (21 CD and 30 UC), diagnosed based on well-established clinical, endoscopic and histopathological criteria for CD (52% male; mean age 37 yrs, range: 14-57) and UC (53% male; mean age 31 yrs, range: 14-61). The cohort studied also included control subjects (48% male; mean age 35 yrs, range: 16-57; and with no intestinal inflammation), who underwent colonoscopy for colon cancer screening, evaluation of suspected irritable bowel syndrome (IBS), polyp screening, or abdominal pain. The study was approved by the Institutional Review Board, and biopsies were obtained from both patients and controls after informed consent at the Meyerhoff IBD Center at Johns Hopkins Hospital. An independent GI pathologist reviewed slides and classified IBD histologically as being either active or inactive. Active disease was defined histologically by the presence of neutrophilic inflammation, including cryptitis and crypt abscesses. Uninvolved mucosa was defined as mucosa free of endoscopically and histologically active or chronic inflammation. In inactive disease, chronic inflammation, crypt distortion and/or lymphoid aggregates were common, although there was no neutrophilic inflammatio. The UC patients had, at a minimum, rectosigmoid disease. Individuals with bleeding or on anti-coagulation therapy, and patients with fistulizing Crohn's disease were excluded from the study. Both patients and controls were also free of antibiotics and non-steroidal anti-inflammatory drugs for at least 2 weeks prior to the colonoscopy.
Acquisition of human ileal and colonic mucosal biopsies
Ileal and sigmoid pinch biopsies were obtained from IBD patients in areas with active disease or from uninvolved colon. Endoscopically active disease was defined by the presence of severe erythema, erosions, and/or ulcerations. In controls, biopsies were obtained from the ileum and sigmoid colon. At each location in the ileum or colon, 2-3 adjacent biopsies were obtained, one for routine histopathology, and one or two for proteomic analysis. Biopsies for proteomic analysis were immediately snap-frozen in dry ice, and then stored in 80 °C (short-term; <6 months) or liquid N2 (long-term) until used.
Experimental animals and establishment of DSS and TNBS mouse colitis models
6-8 week old mice weighing ~18-21 g at the beginning of the experiment were used. Mice were given drinking water and standard rodent pellets ad libitum. DSS and TNBS mouse IBD models were established as we described previously (1), except that 2.5%, instead of 3% DSS, was used in DSS colitis model. Briefly, in the DSS (Dextran sulphate sodium) model, colitis was induced by feeding 2.5% DSS (ICN Biomedicals Inc., Aoraro, Ohio, USA; molecular weight 36-50 kDa, dissolved in drinking water) ad libitum for seven days. Control mice for the DSS received the same drinking water without DSS. In the TNBS (2,4,6-trinitrobenzene sulfonic acid) model, approximately 0.1 ml of TNBS (5mg in 1 ml 50% ethanol) was administered via an 18 gauge, 2.5mm dia. feeding tube (Fine Science Tools, Inc. Foster City, CA) that was advanced through the rectum into the colon, until the tip was 4 cm proximal to the anus (mid-colon). Control mice for TNBS were administered 50% ethanol using the same technique. At day 7, following induction with DSS and TNBS, animals were sacrificed by CO2 inhalation, and the entire colon and small intestine were quickly removed and photographed. Colon was immediately cleared of feces by gently flushing with ice-cold saline using a syringe. For histopathology and immunmocroscopy, colonic segments taken were fixed in 10% neutral buffered formalin, embedded in paraffin and sectioned (4-μm thickness) (34). At 4 °C, the mucosa was scraped from the remaining colon, snap frozen with liquid nitrogen and stored at - 80 °C for protein expression analysis.
Disease activity index (DAI) of DSS- and TNBS-induce colitis
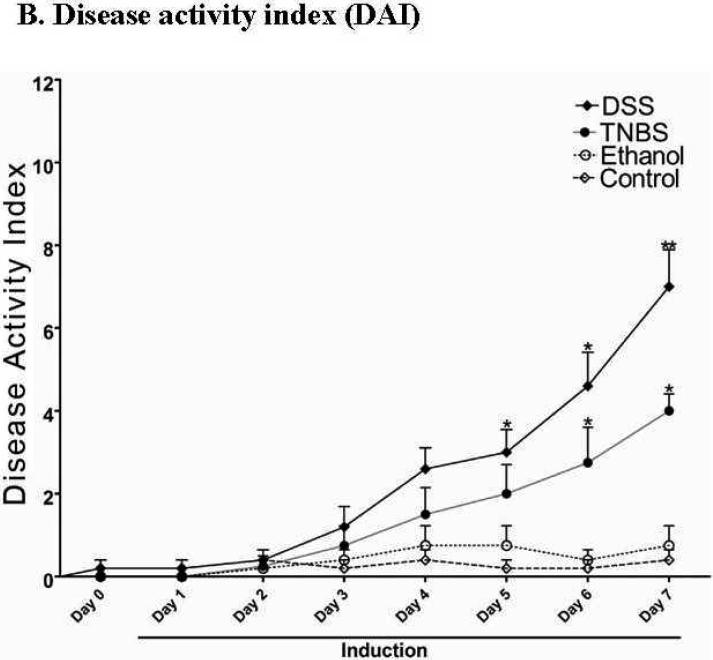
Animals were observed twice daily for weight, water/food consumption, morbidity, stool consistency, piloerection, and the presence of gross blood in feces and at the anus. Clinical signs of colitis were assessed by a ‘DAI’, which was calculated by assigning well-established scores for parameters described previously(7;35), This was assessed by changes in weight loss, stool characteristics, and fecal bleeding. In brief, recordings for weight loss, stool consistency and rectal bleeding were scored as follows: (a). Weight loss: 0, no weight loss; 1, weight loss of 1-15%; 2, weight loss of 5-10%; 3, loss of 10-15%; and 4, weight loss >15% , (b). Assessment of diarrhea: 0, normal well-formed pellets; 2, pasty and semiformed pellets which do not stick to the anus; 4, liquid stools that stick to the anus (watery diarrhea). (c). Rectal bleeding: 0, no bleeding; 2, slight visible bleeding; 4, gross bleeding. The resulting scoring parameters were added resulting in a total disease activity index ranging from 0 (healthy) to 12 (maximal activity of colitis). Protein extraction from human biopsies and mouse colonic/ileal mucosa. All procedures were done at 4 °C. The mouse mucosa was scraped from the colon or ileum, snap frozen with liquid nitrogen and stored at -80 °C for protein expression analysis. For extraction of proteins from human biopsies, each biopsy was first minced in a 1.5 ml Eppendorf tube in the presence of 100-150 μl of HEPES buffer, pH7.4, containing 150 mM NaCl, 1% of Triton X-100, 2 mM Na3VO4, and protease inhibitors [including a protease inhibitor cocktail (Sigma, P8340), 1 mM PMSF (phenylmethylsulfonyl fluoride), and 0.1mM TPCK (Tosyl Phenylalanyl Chloromethyl Ketone)]. The minced biopsy was then homogenized on wet ice with either mini-Teflon homogenizer for human biopsies, or with an Omini TH homogenizer (using a 5 × 95 mm flat bottom stainless steel generator probe (Omini International, Marietta, GA) for mouse intestinal mucosa. Homogenates were centrifuged for 10 min at 2000g to remove tissue/cell debris and nuclei. Cell lysates were assayed for protein concentration using BioRad Protein Assay solution.
SDS-PAGE, Western blotting, chemiluminescent/infared fluorescent detection and quantitative/statistical analysis
Proteins from human biopsies or mouse colonic mucosa were separated by SDS-PAGE and blotted onto nitrocellulose membranes. Proteins of interest were detected either by visible fluorophore-based chemiluminescence (developed with multiple exposures to minimize saturation),or by infrared fluorophores with Odyssey Infrared Imaging System (LI-COR), as we previously described (30;34). For quantitative and statistical analysis, chemiluminescence-detected proteins were scanned on an Epson 1680-Pro scanner, and expression level of each protein was quantified by ImageQuant software. Proteins detected by Odyssey System were quantified Software. The expression of each protein was normalized to GAPDH or actin (loading control). Statistical analysis was done with Student t-Test using OriginPro 7.5 (OriginLab).
Immunohistochemistry and Imaging Analysis
Paraffin-embedded colonic sections were deparaffinized, endogenous peroxidase activity blocked, and further processed as we previously described (1;34). Antigen retrieval was performed with 0.01 M citrate buffer, pH 6.0, for 5 min in a microware oven. Sections were blocked for 1 h in 5% normal goat serum (NGS) in PBS. Blocked sections were then incubated for 1 h with primary antibody diluted in 5% NGS in PBS (NHE3: 1:50; NHERF1: 1:500; NHERF2: 1:300; Na+/K+-ATPase: 1:250), followed by 1 h incubation with corresponding fluorescence-conjugated secondary antibodies: goat anti-mouse Alexa568 (Na+/K+-ATPase), or goat anti-rabbit Alexa488 (NHE2, NHE3) and Alex568 (NHERF1/2). Nucleus was counter-stained with Hoechst 33342. Autofluorescence was quenched with 1% Sudan Black in 70% methanol for 10 min at room temperature. Fluorescent images were taken using a Zeiss LSM 510 confocal microscope (Zeiss 63X water immersion objective).
Results
NHE3, NHERF1, and ClC-5 was down-regulated in biopsies from CD and UC patients with active disease
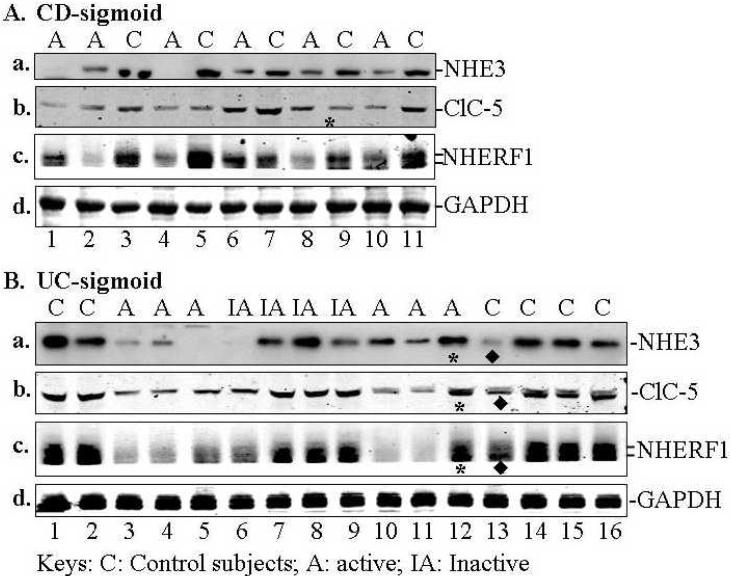
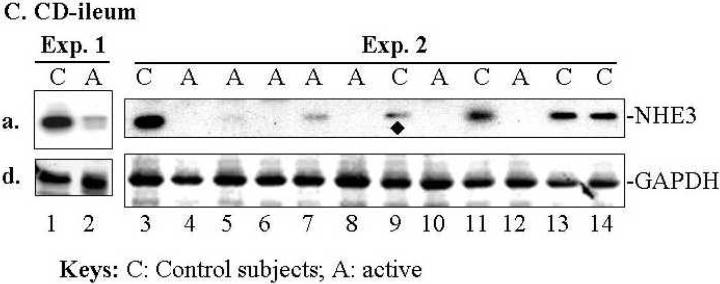
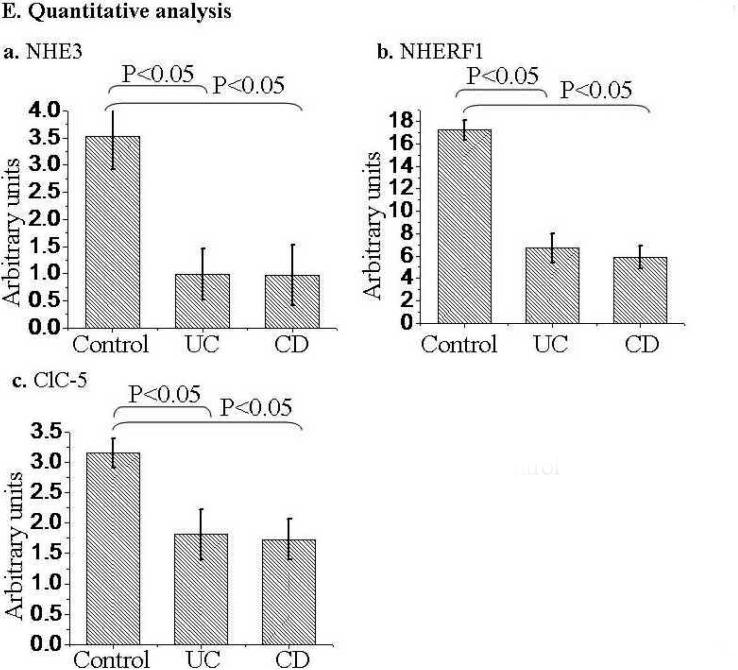
NHE3, NHERF1, and ClC-5 were down regulated in patients with active CD and UC based on comparing the mean magnitude of expression of each protein (obtained by quantitative Western blotting). A summary of NHE3, NHERF1, and ClC-5 expression by Western-blot analysis is shown in Table 1. The representative expression profiles of these proteins are shown in Fig. 1A & B (for sigmoid) and in Fig. 1C (for ileum). Quantitative analysis of changes of NHE3, NHERF1, and ClC-5 is shown in Fig. 1D. NHE3 expression was decreased in sigmoid mucosa of >87 % of patients with active UC or CD (n=42) and all 8 ileal mucosa from CD patients with active ileitis (Table 1A and representative blots in Fig. 1A-C). NHERF1 expression is down-regulated in >85% sigmoid mucosa of active UC or CD (n=21) (Table 1B and representative blots in Fig. 1A,B). Even in inactive sigmoid mucosa of IBD patients, both NHE3 and NHERF1 were down-regulated, although to a variable degree, in sigmoid biopsies of 50% patients tested (Table 1A & B, n=6; Fig. 1B, lane 6). Down-regulation of ClC-5 was observed in sigmoid mucosa of 80%, 60% and 22% patients with active UC (n=10), active CD (n=10), and inactive UC/CD (n=9), respectively (Table 1C and representative blots in Fig. 1A&B). Overall, the expression of NHE3, NHERF1 and ClC-5 in IBD mucosa is ~50% (as for ClC-5), or lower (as for NHE3 and NHERF1) than that in mucosa of controls (Fig. 1E).
Table 1.
Summary of down-regulation of NHE3, NHERF1 and NHE3
| A. NHE3 in sigmoid and ileum | ||
|---|---|---|
| Subjects | No. of Biopsies | % down regulated* |
| Sigmoid | 42 (total) | |
| Control subjects | 14 | 7.1% (1/14) |
| Active UC | 12 | 91.7% (11/12) |
| Active CD | 8 | 87.5% (7/8) |
| Inactive UC/CD | 6 | 50% (3/6) |
| Uninvolved UC/CD | 2 | 0% (0/2) |
| Ileum | 14 (total) | |
| Control | 6 | 16.7% (1/6) |
| Active CD | 8 | 100% (8/8) |
| Total # biopsies | 56 | |
| B. NHERF1 in sigmoid | ||
|---|---|---|
| Subjects | No. of Biopsies | % down regulated* |
| Control subjects | 13 | 7.69% (1/13) |
| Active/ UC | 13 | 84.6% (11/13) |
| Active CD | 8 | 87.5% (7/8) |
| Inactive CD/UC | 6 | 50% (3/6) |
| Uninvolved CD | 2 | 50% (1/2) |
| Total # biopsies | 42 | |
| C. ClC-5 in sigmoid | ||
|---|---|---|
| Subjects | No. of Biopsies | % down regulated* |
| Control subjects | 16 | 6.3% (1/16) |
| Active UC | 10 | 80.0% (8/10) |
| Active CD | 10 | 60.0% (6/10) |
| Inactive CD/UC | 9 | 22.2% (2/9) |
| Uninvolved CD/UC | 4 | 0.0% (0/4) |
| Total # biopsies | 49 | |
Note: The expression of NHE3, NHERF1, and ClC-5 in the mucosa of IBD patients was compared to that in mucosa of healthy controls. "Down-regulation" was defined as at least 40% less expression than the average of all corresponding control mucosa. Expression of these proteins was normalized to the expression of GAPDH in each biopsy.
Fig. 1. Expression of NHE3, NHERF1 and ClC-5 in the sigmoid mucosa of active CD or UC was significantly decreased compared to control subjects.
Approximately equal amount of total lysate (40 μg proteins) of each sigmoid biopsy was separated by SDS-PAGE, electroblotted onto nitrocellulose membrane, and probed with specific antibodies against proteins of interested as labeled. A &B. Representative expression profiles in sigmoid: Down-regulation of NHE3, NHERF1, and ClC-5 was observed in the sigmoid mucosa from CD (A) and UC (B) patients. Equal amount of total lysate (45 μg) of each sigmoid biopsy from active CD (A) and active (or inactive) UC (B), was separated by SDS-PAGE and probed separately with antibodies against NHE3 (a), ClC-5 (b) and NHERF1 (c). GAPDH was used as a loading control (d). Due to the similar molecular weight between NHE3 and ClC-5 and between NHERF1 and GAPDH, two identical gels were prepared from the same set of samples shown. C. Down-regulated of NHE3 in the ileum of CD patients. Equal amount of total lysate (45 μg) of each ileal biopsy was analyzed with polyclonal antibodies against NHE3 (a) and GAPDH (d). Protein bands marked by symbols “*” or “◆” indicate changes that are not representative of active IBD or control subjects, respectively. D. Statistical analysis. D-a. NHE3 expression in sigmoid biopsies from 14 control subjects was compared to those from 12 patients with active UC and 8 with UC (See Table 1A). D-b. NHERF1 expression in 13 controls was compared to 13 active UC and 8 active CD (See Table 1B). D-c. ClC-5 expression in 16 controls compared to 10 active UC or CD (see Table 1C). Due to the similar molecular weight between NHE3 and ClC-5, at least two identical gels were prepared from the same set of samples shown. The expression of each protein was normalized to GAPDH or actin (loading control). Statistical analysis was done with Origin 7.5 Software and p-value calculated by Student's T-test. Standard errors are reflected by error bars.
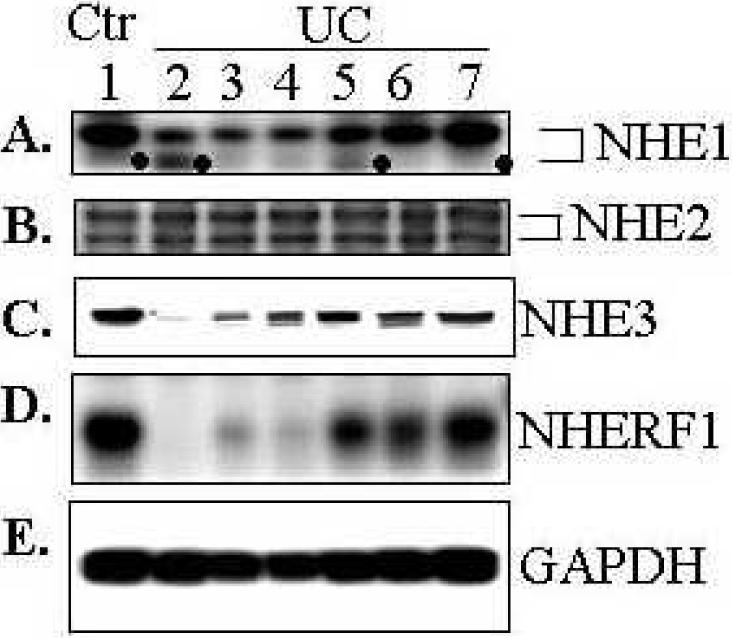
Expression of NHE1, a ubiquitous isoform of NHEs, was also decreased in majority of sigmoid of UC patients (Fig. 2A), though to a lesser extent when compared to NHE3 and NHERF1 in some patients (see a representative of experiments with sigmoid biopsies from 8 controls and 13 UC patients; Fig. 1A&B and D). In contrast, no apparent difference between control and UC patients in the expression of NHE2 (Fig. 2B), another NHE isoform that known to be located at apical surface of intestinal epithelial cells(22). It is interesting to note that a smaller molecular weight band of NHE1 (marked by dots “•”) was increased in 2 samples (Fig. 2A, lanes 2 &5), while in most biopsies the smaller molecular band was not prominent. Since both NHE1 and NHE2 exhibit two bands in Western blot, a glycosylated mature form (upper band) and a non-glycosylated immature form (lower band)(26), it is most likely that this lower molecular weight band is the non-glycosylated immature form.
Fig. 2. Expression of NHE1, but not NHE2, was also down-regulated in the sigmoid of affected UC patients.
Total lysate (40 μg) of each sigmoid biopsy from control subjects (Ctr) or UC was analyzed by SDS-PAGE and Western blot as described in Fig. 1 and probed with polyclonal antibodies against NHE1 (A), NHE2 (B), NHE3 (C), NHERF1 (D), and monoclonal antibody to GAPDH (E, loading control). NHE1 and NHE2 display two well-separated bands, a glycosylated mature form (upper band) and unglycosylated immature form (lower band). Note that the immature (un-glycosylated) form of NHE1, marked by dot symbol “●”, appears to be preferentially increased in some of the UC samples. Representatives of 8 controls and 13 UC samples were shown. NHE3 and NHERF1 were shown for comparison purpose: their down-regulation in some samples was more dramatic than NHE1. All blots were obtained from either same or identical gels.
Na+/K+-ATPase and ENaC, but not intestinal alkaline phosphatase, were decreased in patients with active disease
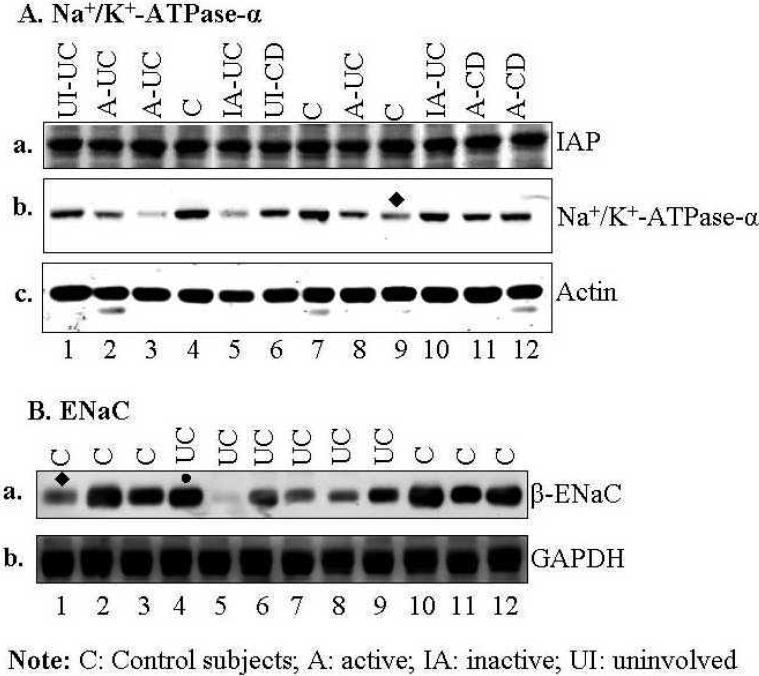
One concern using whole mucosal biopsies was the potential differences in protein expression due to heterogeneity of multiple cell populations between control and IBD mucosa. More specifically, the percentage of a given cell type in normal/control mucosa might differ from that in mucosa with active inflammation. Therefore, it is possible that lower level of epithelial transporters in active IBD patients may result from less epithelial cells (and more infiltrating inflammatory cells) in the biopsies. To minimize this potential pitfall, patients with severe inflammation (based on histopathology) were excluded from this study. Furthermore, to test this possibility, expression of intestinal alkaline phosphatase (IAP), a major apical marker in polarized enterocytes, was determined. If the enterocyte number in biopsies from IBD patients were significantly smaller as a percent of total cells present, the IAP expression would be decreased in biopsies from patients with active IBD when normalized to actin. As shown in Fig. 3A-a, there was no significant difference in IAP expression among biopsies in control subjects, uninvolved area from patients with IBD, inactive UC, and active CD or UC. In contrast, expression of Na+/K+-ATPase α-subunit was decreased in 3 of the 5 patients with active disease (Fig. 3A-b). The fact that no change was observed in the expression of NHE2 (Fig. 2B) that is expressed only apically in enterocytes, further indicates that the number of enterocytes in each biopsy is similar. Since down-regulation of Na+/K+-ATPase in IBD has been reported previously (6;32;36;44) (also see Suppl Table S1), limited number of patients (3 controls and 9 IBD) were studied to further confirm this observation. It appears that the down-regulation of Na+/K+-ATPase is less consistent (in 60% active sigmoid IBD and 33% controls; see Table 2A) and to a lesser degree (Fig. 3A-b) between control subjects and IBD patients, when compared to that of NHE3 (in ~90% active sigmoid IBD and only 7% controls; see Table 1A and Fig. 1A &B).
Fig. 3. While little change in intestinal alkaline phosphatase was observed, Na+/K+-ATPase and ENaC were down-regulated in most of the sigmoid biopsies tested from active UC or CD patients.
Total lysate of each biopsy was analyzed by SDS-PAGE and Western blot as described in Fig. 1. A. Expression of Intestinal alkaline phosphatase (IAP) (a), Na+/K+-ATPase-α subunit (b), and actin (c, loading control). B. Expression of β-ENaC (a), and GAPDH (b). Equal amount of total lysate (45 μg) of each sigmoid biopsy was separated by SDS-PAGE and probed separately with monoclonal antibodies against intestinal alkaline phosphatase (IAP). Two identical gels were prepared from the same samples and used for Western blot analysis. Protein bands marked by symbol “●” or “◆” indicate a change that is not representative. Summary of expression in Na+/K+-ATPase and ENaC was shown in Table 2. All blots in A or B were obtained from either same or identical gels.
Table 2.
Summary of down-regulation of Na+/K+ -ATPase and ENaC
| A. Na+/K+-ATPase (see Western blot in Fig. 2A) | ||
|---|---|---|
| Subjects | No. of Biopsies | % down-regulated* |
| Control subjects | 3 | 33.3% (1/3) |
| Active UC/CD | 5 | 60% (3/5) |
| Inactive/Uninvolved UC/CD | 4 | 25% (1/4) |
| Total # biopsies | 13 | |
| B. ENaC (see Western blot in Fig. 2B) | ||
|---|---|---|
| Subjects | No. of Biopsies | % down regulated* |
| Control subjects | 6 | 16.7% (1/6) |
| Active UC | 6 | 83.3% (5/6) |
| Total # biopsies | 12 | |
Note: Expression of Na+/K+-ATPase α-subunit or β-ENaC in IBD mucosa was compared to the average of that inmucosa of control subjects. "Down-regulation" was defined as at least 40% less expression than the average of the control mucosa. Expression of Na+/K+-ATPase or β-ENaC was normalized to the expression of actin or GAPDH in each biopsy.
β-ENaC, a regulatory subunit of the apical epithelial Na channel (ENaC), was also decreased, to different extents, in 5 of the 6 UC patients (83%) (Fig. 3B-a & Table 2B), with almost undetectable levels in one patient (Fig. 3A-a, lane 5). These data further confirm the down regulation of β-ENaC in UC patients that has been reported previously (3;5).
Down regulation of NHE1, NHE3 and NHERF1 were recapitulated in DSS- and TNBS-induced acute mouse colitis model
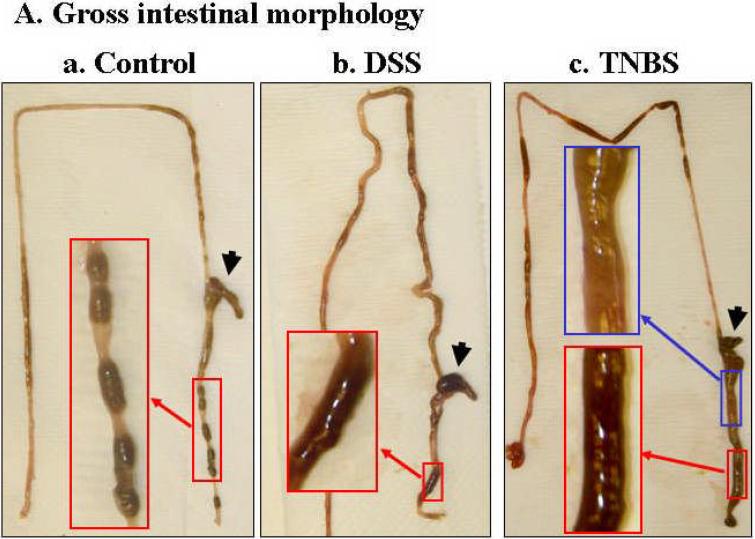
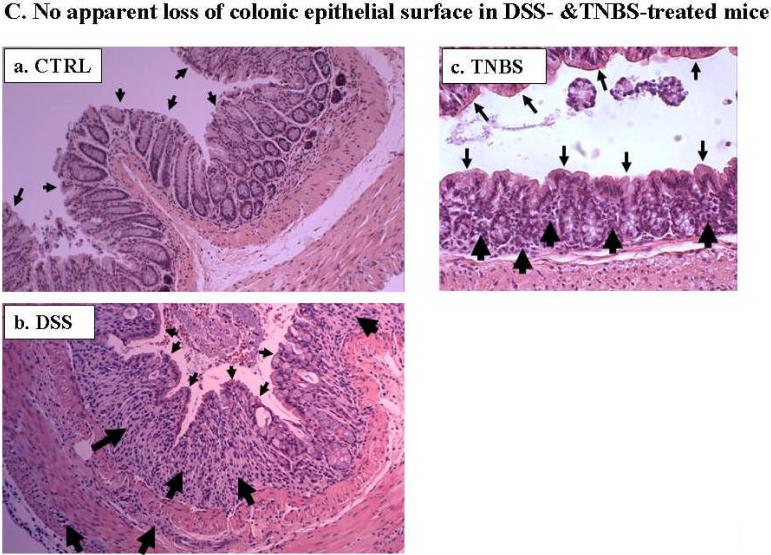
Due to the limited potential molecular and experimental manipulations possible in human IBD studies, we tested whether altered expression of these Na+ transport-related proteins could be recapitulated in mouse IBD models. We chose two chemically (DSS and TNBS) induced colitis models, mainly because these models are reversible in a highly controlled fashion, which allow future mechanistic studies. In order to avoid loss of colonic epithelial cells, 2.5% DSS was used for the DSS-colitis model. [We initially tested the effects of several concentrations of DSS, including 2.5%, 3%, 4%, and 5%, on colonic epithelial cell loss, and observed that DSS at 3% or higher caused loss of epithelial cells (data not shown), which is in agreement with previous reports (32)]. For the TNBS model, we tested two TNBS doses (5 and 6 mg/mouse in 50% ethanol) and chose 5 mg/mouse with consideration of minimizing loss of epithelial cells. In both acute DSS- and TNBS-induced mouse colitis, the affected segments of the GI tract are colon and cecum, which are characterized by inflamed, shorter and thickened colon and enlarged cecum, as well as mild bloody and loose stools, compared with control mice (Fig. 4A). The progressive development of colitis is further demonstrated by the disease activity index (DAI; see main text Fig. 4B). Histological analyses showed the loss or shortening of the crypts and apparent infiltration of inflammatory cells in both lamina propria and muscularis mucosa (Fig. 4C), as we and others previously reported (1;10).
Fig. 4. While DSS- and TNBS-induced inflammation is evident in the colon of acute mouse colitis models, no apparent damage was observed in the luminal surface of colonic epithelial cells.
A. Mice with both DSS- and TNBS-induced colitis exhibited loose and mild bloody stools as well as shorter and often thickened colon and cecum (b &c), compared with those of control mice, which exhibited normal appearance of intestine and stood (with fecal pellets in distal ileum and throughout the colon) (a). Blood was often present in the colon of DSS- (b) or TNBS-treated (c) mice (see enlarged images) and cecum (marked by flat arrows). Colon thickening was observed in all TNBS-induced mouse colitis (c). B. DSS-treated and TNBS-treated mice showed significant increase in disease activity index, an indication of the severity of intestinal inflammation in murine colitis. Values are plotted as means with SEM. Asterisk (*) denotes p < 0.05 when DSS-induced and TNBS-induced mice were compared to its respective controls (water and ethanol, respectively). C. Cross sections of mouse colon from normal controls (a, CTRL), and DSS- (b) or TNBS-(c) treated mice were stained with H&E and viewed under light microscopy. No significant epithelial ulceration was observed in both colitis models. The small arrows indicated the luminal surface of colonic epithelial cells. The large arrows indicate infiltration of inflammatory cells in lamina propria or muscularis propria and loss of crypts.
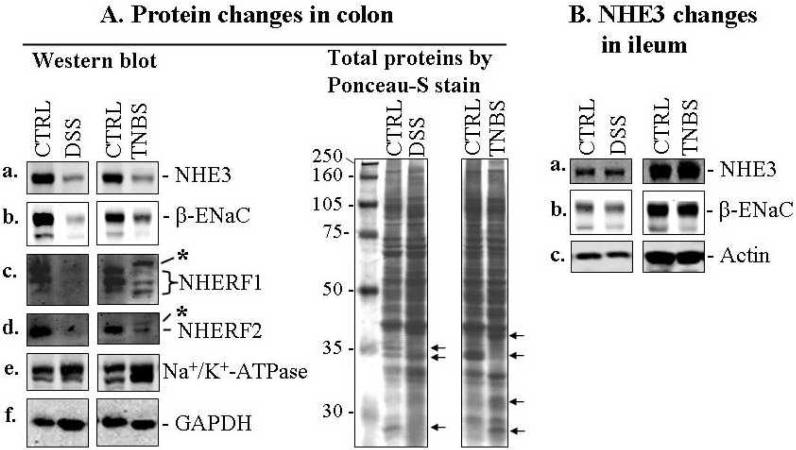
The expression of NHE1, NHE3, β-ENaC, NHERF1, and NHERF2 (Figs. 5, 6 & 7) were all reduced in colon from both DSS and TNBS models. Although apparent crypt destruction or shortening were observed under the conditions used, it is important to mention that no significant intestinal epithelial surface damage or loss of surface epithelial cells was observed in either DSS or TNBS colitis as assessed by H&E staining (Fig. C) and immunomicroscopy of NHE2 (Figs. 6B & 7). These data suggest that the decrease in amount of NHE1, NHE3, β-ENaC, NHERF1 &2 reflects their protein expression levels, and not a loss of intestinal epithelial cells. Na+/K+-ATPase α-subunit expression was either not affected (DSS mice) or slightly increased (TNBS mice; Fig. 5A-e). Interestingly both NHERF1 and NHERF2 exhibited a migration shift on SDS-PAGE after TNBS-treatment (Fig. 5A, marked by asterisks). While the reason for this shift is unknown, it may result from increased phosphorylation of the NHERF proteins. Of note, NHERF1 is known to be phosphorylated, while phosphorylation of NHERF2 has not been demonstrated (15).
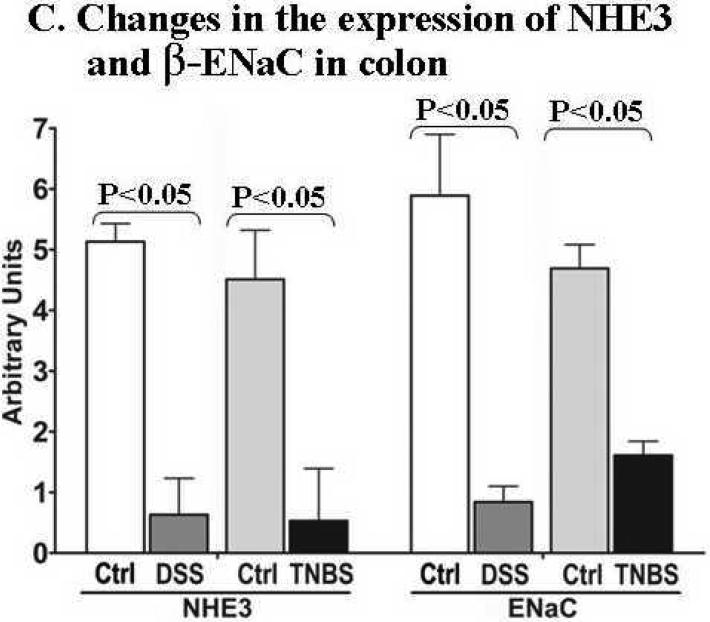
Fig. 5. Significant down-regulation of NHE3, ENaC and NHERF proteins was demonstrated in both DSS- and TNBS-induced acute colitis in mouse IBD models.
A. Western blot (left panel) shows that the expression of NHE3 (a), β-ENaC (b), NHERF1 (c), NHERF2 (d) was reduced in the colonic mucosa of DSS- and TNBS-induced mouse colitis. However, the expression of Na+/K+-ATPase α-subunit (e) appears to be either unchanged in DSS model or slightly increased in TNBS model after normalized GAPDH level (f) for protein loading (also see total protein profiles, right panel). The difference in protein expression profiles was even evident in total protein staining (see right panel of A; arrow-pointed bands). Total colonic mucosal protein (40 μg) was visualized by Ponceau-S staining of the blot before antibody probing. B. Expression of NHE3 (a) and β-ENaC (b) in the ileal mucosa was not affected in DSS and TNBS mice. Actin (c) was used as a loading control. 40 μg total ileal mucosal proteins were loaded on each lane. Antibodies used are described in Figs. 1-3. C. Statistical analysis of the expression of NHE3 and ENaC by normalization to GAPDH. Standard errors are reflected by error bars. Representatives of at least 3 independent experiments are shown in A &B.
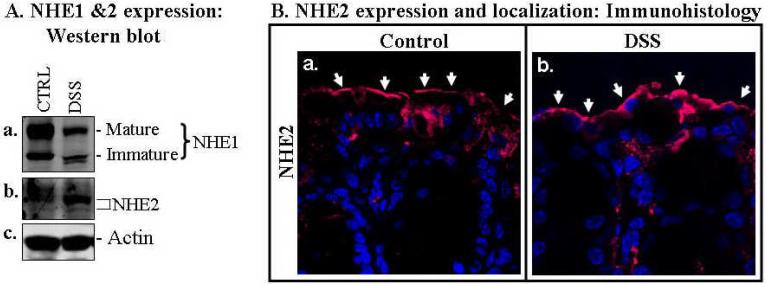
Fig. 6. NHE1, but not NHE2, was down-regulated in the colonic mucosa of DSS mouse colitis.
A. Western blot analysis showed that both the mature and immature forms of NHE1 (a) were decreased in the colonic mucosa of DSS colitis, while NHE2 (b), another apically localized intestinal NHE isoform, remained similar to the control. Actin (c) was used as a loading control. B. Immunocytochemical analysis of NHE2. NHE2 was seen predominantly at the apical (luminal) surface and appeared to be slightly higher in expression in the mucosa of DSS colitis than that in normal controls (compared panels a & b). Luminal surface (apical) is marked with arrows. NHE2 was visualized by probing sections of paraffin-embedded colon with a rabbit anti-NHE2 antibody and followed by Alexa 568-labeled secondary antibody (red). Representative of 3 independent experiments are shown.
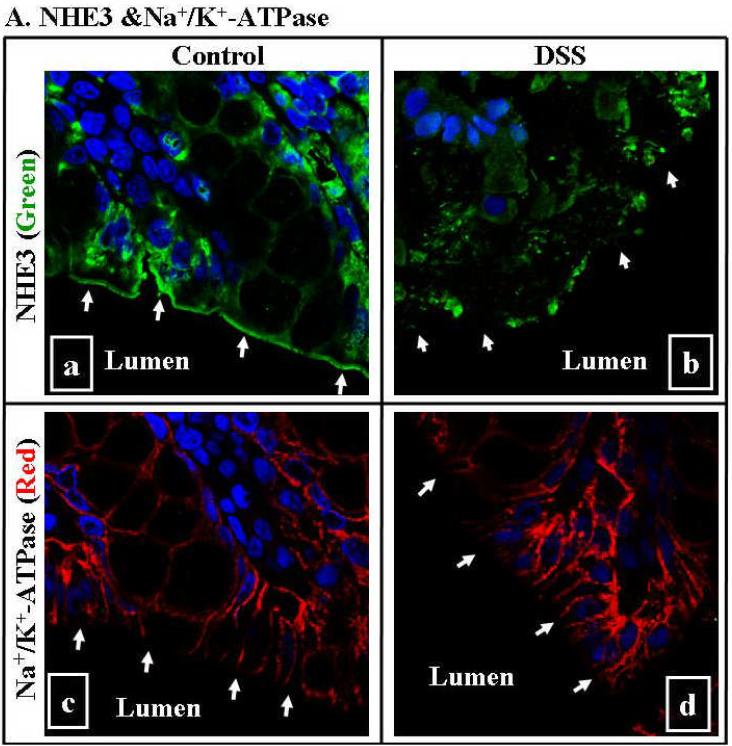
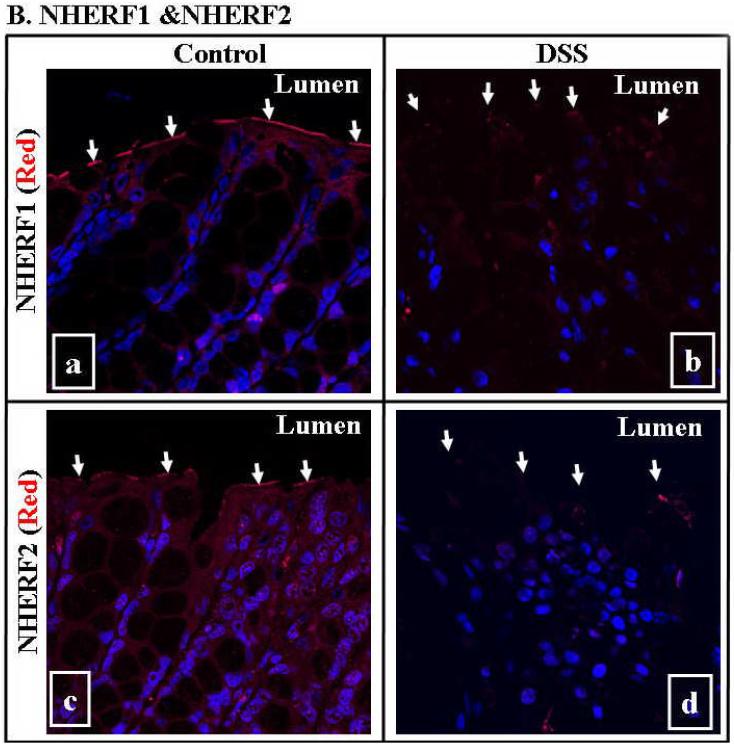
Fig. 7. Down-regulation of NHE3, NHERF1 and NHERF2 was seen in DSS mouse colitis by immunomicroscopy.
A. NHE3 was abundantly expressed at the luminal (apical) surface of colon in control mice (A-a), while diminished in that of DSS-treated mice (A-b; marked by arrows). There is no difference in the expression of Na+/K+-ATPase between control (A-c) and DSS-treated mice (A-d). B. While both NHERF1 &2 were expressed at the luminal surface of colon in control mice (B-a and B-c), they diminished in the colonic mucosa of the DSS-colitis mice (B-b and B-d). NHE3 was visualized by probing sections of paraffin-embedded colon with anti-NHE3 antibody and followed by Alexa 488-labeled secondary antibody (green). Na+/K+-ATPase was visualized by anti- Na+/K+-ATPase α-subunit followed by Alexa 568-conjugated secondary antibodies (red). NHERF1 &2 were visualized by anti-NHERF1 or 2 antibodies followed by Alexa 568-labeled secondary antibody (red). Nuclei were labeled by Hoechst 33342 (blue). A representative image (63X) of 2-4 independent experiments was shown. Arrows in each panel mark the luminal surface of intestinal epithelial cells.
In contrast to the down-regulation of NHE3 and β-ENaC in the colon of DSS- or TNBS mice, these two Na+-transporters exhibited no significant changes in the ileum (compare Fig. 5A with 5B). This observation correlates with the normal morphology of the ileum, where no overt inflammation was evident and stools formed normally (Fig. 4A). Thus the mild diarrhea in both DSS- and TNBS mice is primarily due to colonic and not ileal effects.
Consistent with the data obtained from human biopsies, NHE1 was also down-regulated in DSS-colitis mice (Fig. 6A). In contrast, NHE2 expression was similar or even slightly increased in DSS-colitis compared to controls, as demonstrated by both Western blot and immunohistology (Fig. 6), which is similar to the data from UC biopsies (Fig. 1D). These data would suggest that in the colon, at least two apical (NHE3 and ENaC) and one basolateral [NHE1] (9) Na+-absorbing proteins are involved in the apical Na+ absorption. Thus, down-regulation of NHE1, NHE3 and ENaC may be a significant factor contributing to IBD-associated diarrhea.
The decreased expression of NHE3, NHERF1 &2 in DSS-colitis was further confirmed by immunomicroscopy in Fig. 7. While NHE3, NHERF1 &2 were expressed predominantly at the luminal surface of colonic epithelial cells in the control mice, their expression in mice with DSS- colitis was greatly diminished (Fig. 7A-a & b and 7B). In contrast, Na+/K+-ATPase expression in the colonic mucosa was not altered between control and DSS-treated mice (Fig. 7A-c & d).
Discussion
Intestinal Na+absorption is carried out by several Na+- transporters, including 1) apical NHE3-mediated neutral NaCl absorption coupled with Cl-/HCO3- co-transporters, DRA and PAT1, and colonic short-chain fatty acid-coupled Na+uptake, and 2) basolateral transport of Na+ by Na+/K+-ATPase (15;27), which is thought to be the major driving force for apical Na+ uptake by NHE3 and ENaC (27). Since impaired Na+ absorption is a major mechanism of diarrhea (15), it is conceivable that down-regulation of any one or more of these intestinal transporters could contribute to IBD-associated diarrhea.
Although scattered evidence can be found in previous studies that decreased Na+-transport may contribute to IBD-associated diarrhea (see extensive list of intestinal transporters in Suppl Table S1), the novel finding of our study 1) presents evidence for down-regulation of multiple Na+-transporting proteins in the same IBD mucosa, including apical transporters NHE1&3 and ENaC, as well as the basolateral Na+/K+-ATPase, and 2) shows for the first time that NHE3 and NHERF1 &2 are down-regulated in the mucosa of both IBD patients and DSS-colitis mice. These data provide a strong link between NHE3 regulation and IBD-associated diarrhea, and new molecular insights into the pathogenesis of diarrhea associated with human IBD. The remarkable similarity in our studies between results from human IBD and those from mouse colitis strengthens our conclusion that down-regulation of these transporters might be a significant contributor to IBD-associated diarrhea.
The role of NHE3 in intestinal Na+ absorption was definitively demonstrated in NHE3 knockout (KO) mouse with phenotypic presentation of congenital diarrhea (20;42). A study of IL-2-knockout mice, which develop colitis, showed that colonic Na+ absorption was impaired due, in part, to the down regulation of NHE3 (5). Most recently, Laubitz et al (29) demonstrated that NHE3-KO mice, hosted in a conventional facility, spontaneously developed distal colitis, with features including mild diarrhea, reduced body weight and occasional rectal prolapse. By real-time PCR, NHE3-KO mice exhibited elevated expression of inducible nitric oxide synthesis (38-fold), TNF-α (6-fold), macrophage inflammatory proteins-2 (48-fold), and IL-8 (3-fold), compared WT mice (29). Therefore, it is certain that down-regulation of NHE3 in IBD patients will contribute to IBD-associated diarrhea. It is important to note that, despite being a Cl- channel, ClC-5 is an intracellularly localized Cl- channel and is not expected to be involved in plasma membrane Cl- secretion. Rather, it has been suggested to play an important role in regulation of protein trafficking in epithelial cells including NHE3 (12;46). Our recent study showed that, in mouse mucosa, NHE3 and ClC-5 co-migrated in the same endosomal pool isolated by OptiPrep gradient fractionation (unpublished data). Since trafficking of NHE3 between plasma membrane and endosomal compartments is a major regulatory mechanism of NHE3, these data collectively support that ClC-5 may be involved in NHE3 trafficking. Therefore the decrease in ClC-5 in IBD may also be relevant to IBD diarrhea, especially since there was reduced surface NHE3 amount in the proximal tubule of ClC-5 KO mouse(15).
Since down-regulation (activity or mRNA) of both Na+/K+-ATPase (6;32;36;44) and ENaC (3;5) in IBD has been reported previously (also see Suppl Table S1), only a limited number of subjects were included in this study. ENaC, a key apical Na+channel in intestinal epithelial cells, consists of three heterotrimeric subunits (α,β & γ). Interestingly, only subunits of β- and γ-ENaC, but not α-ENaC, were shown to be down-regulated in UC or by treatment of surgically obtained colonic epithelial cells with IFN-γ and TNF-α (3;5). Our data is consistent with previous reports that β-ENaC is down-regulated in both patients with active IBD and mouse DSS-colitis model.
Reduced activity of Na+/K+-ATPase in IBD patients was reported in 1980's (2;17;38). Interestingly however, in animal models, diarrhea induced by T-cell activation with anti-CD3 mAb inhibited Na+/K+-ATPase activity without affecting its expression in mice (36). Similar results were also reported in Caco-2 cells, in which IFN-γ decreased activity but not expression of Na+/K+-ATPase (31) . Here, we demonstrated that 60% of active IBD patients exhibited reduced Na+/K+-ATPase expression. In contrast, our DSS- or TNBS-colitis models showed that Na+/K+-ATPase expression was either not changed or increased, respectively. This discrepancy may arise from intrinsic differences between human, mouse or cell models. In addition, this explanation is supported by an elegant study using human intestinal xenografts, in which Barrett's group demonstrated that prolonged IFN-γ exposure decreased both activity and expression of Na+/K+-ATPase (6). Therefore, exact changes in Na+/K+-ATPase expression in patients with IBD and its role in IBD-associated diarrhea needs further study.
We present here the first evidence that NHERF1&2 are down-regulated in human IBD patients and in DSS- or TNBS-induced mouse colitis [Down-regulation of NHERF2 in IBD biopsies is more moderate than that of NHERF1 (data not shown]. Down regulation of PDZ domain-containing protein NHERF1/2 in IBD pathogenesis may occur at several different levels: 1). At least 4 members NHERF family of PDZ-proteins in intestinal epithelial cells are known to regulate NHE3 activity (15). 2). NHERF1 has been shown to regulate a diverse group of other epithelial transporters such as CFTR, DRA, and Na+/K+-ATPase (15). Therefore, NHERF1 down-regulation may also lead to changes in the activity of multiple transporters that contribute to IBD-associated diarrhea. Decreased DRA expression has been implicated in IBD-associated diarrhea, while the role of CFTR is less clear. Although IBD-associated diarrhea has been attributed to increased Cl--secretion based on some early observations (24;25) (perhaps through the up-regulation of CFTR) more recent experiments in mouse IBD models suggest that Cl- secretion does not appear to be affected (see more on CFTR in Suppl Table S1). CFTR gene expression was not altered in animal IBD models, including TNBS rat model and a mouse model with human intestinal xenografts after prolonged IFN-γ exposure, although the actual change of CFTR expression at both mRNA and protein levels in human IBD mucosa requires further examination. 3). NHERF1 is suggested to play a critical role in establishing and maintaining the integrity of intestinal barrier function (28;33). These data suggest that, in addition to decreasing Na+-absorption by regulating NHE3, NHERF1 down-regulation may result in an increased intestinal epithelial permeability, a recognized mechanism of microbe-mediated pathogenesis of IBD (41;43).
The signals that trigger the down-regulation of multiple epithelial transporters in IBD patients remain unknown. We speculate that there are likely some common transcriptional regulators or factors regulating expression of NHE1, NHE3, ENaC, Na+/K+-ATPase, ClC-5 and NHERF 1 &2. One group of potential factors are IBD-associated inflammatory cytokines (14;18) (see more Suppl Table S1), which inhibit the expression of these transporters. Another potential common regulator of multiple transporters are microRNAs (miRNAs), since a single miRNA is capable of targeting and down-regulating multiple genes [see review (19)].
Why was down-regulation of intestinal transporters also seen in ~50% of inactive biopsies? The sigmoid mucosas of all patients with inactive colitis used in this study have histologically inactive chronic inflammation and crypt distortion. We propose that there is likely a down-regulation of intestinal Na+ transporters under these conditions. In support of this, clinically, many IBD patients with histologically inactive disease have diarrhea, which might be contributed, at least in part, by the down-regulation of the Na+ transporters.
Identifying changes of key membrane transporters that regulate transepithelial electrolytes and their regulators in IBD may 1) lead to a better understanding of the molecular causes for IBD-associated diarrhea, 2) provide a biochemical profile to evaluate disease activity of IBD, and 3) present a rational approach to pursue new therapeutic targets for the management of diarrhea in IBD patients.
Supplementary Material
Acknowledgements
This work was supported primarily by Broad Medical Research Program (IBD-0119R), and in part by NIH-NIDDK grants (5R21DK77064), NIH/NIDDK KO1- DK62264, NIH T32 fellowship, and R24-DK64388 (The NIDDK-Hopkins Basic Research Digestive Diseases Development Core Center). We would like to thank following individuals who have helped in this work: Dr. Theodore M. Bayless for commenting on this manuscript and other supports; Patricia D. Ushry, Sherrise Maddox for patient recruiting/consenting; and Drs. Ming Tse, Chris Yun, Sandra Guggino, Oliver Devuyst, Mark Knepper, David Alper, for providing antibodies. Special thanks go to Dr. Daniel Podolsky, GI Unit/ Dept of Medicine, Massachusetts General Hospital, for his help in providing some of the experimental materials and for his valuable comments and suggestion for the preparation of this manuscript, and to Mr. & Mrs. Morton Hyatt for their generous support for the on-going IBD research in Dr. Xuhang Li's laboratory.
Reference List
- 1.Alex P, Zachos NC, Nguyen T, et al. Inflamm Bowel Dis. 2008. Distinct Cytokine Patterns Identified from Multiplex Profiles of Murine DSS and TNBS-Induced Colitis. In press. [DOI] [PMC free article] [PubMed] [Google Scholar]
- 2.Allgayer H, Kruis W, Paumgartner G, et al. Inverse relationship between colonic (Na+/ K+)-ATPase activity and degree of mucosal inflammation in inflammatory bowel disease. Dig Dis Sci. 1988;33:417–422. doi: 10.1007/BF01536025. [DOI] [PubMed] [Google Scholar]
- 3.Amasheh S, Barmeyer C, Koch CS, et al. Cytokine-dependent transcriptional down-regulation of epithelial sodium channel in ulcerative colitis. Gastroenterology. 2004;126:1711–1720. doi: 10.1053/j.gastro.2004.03.010. [DOI] [PubMed] [Google Scholar]
- 4.Amin MR, Malakooti J, Sandoval R, et al. IFN-{gamma} and TNF-{alpha} Regulate the Human NHE3 Gene Expression By Modulating the Sp Family Transcription Factors in Human Intestinal Epithelial Cell Line, C2BBe1. Am J Physiol Cell Physiol. 2006;291:C887–896. doi: 10.1152/ajpcell.00630.2005. [DOI] [PubMed] [Google Scholar]
- 5.Barmeyer C, Harren M, Schmitz H, et al. Mechanisms of diarrhea in the interleukin-2-deficient mouse model of colonic inflammation. Am J Physiol Gastrointest Liver Physiol. 2004;286:G244–G252. doi: 10.1152/ajpgi.00141.2003. [DOI] [PubMed] [Google Scholar]
- 6.Bertelsen LS, Eckmann L, Barrett KE. Prolonged interferon-gamma exposure decreases ion transport, NKCC1, and Na+-K+-ATPase expression in human intestinal xenografts in vivo. Am J Physiol Gastrointest Liver Physiol. 2004;286:G157–G165. doi: 10.1152/ajpgi.00227.2003. [DOI] [PubMed] [Google Scholar]
- 7.Best WR, Becktel JM, Singleton JW, et al. Development of a Crohn's disease activity index. National Cooperative Crohn's Disease Study. Gastroenterology. 1976;70:439–444. [PubMed] [Google Scholar]
- 8.Bjarnason I, MacPherson A, Hollander D. Intestinal permeability: an overview. Gastroenterology. 1995;108:1566–1581. doi: 10.1016/0016-5085(95)90708-4. [DOI] [PubMed] [Google Scholar]
- 9.Bookstein C, DePaoli AM, Xie Y, et al. Na+/H+ exchangers, NHE-1 and NHE-3, of rat intestine. Expression and localization. J Clin Invest. 1994;93:106–113. doi: 10.1172/JCI116933. [DOI] [PMC free article] [PubMed] [Google Scholar]
- 10.Breider MA, Eppinger M, Gough A. Intercellular adhesion molecule-1 expression in dextran sodium sulfate-induced colitis in rats. Vet Pathol. 1997;34:598–604. doi: 10.1177/030098589703400608. [DOI] [PubMed] [Google Scholar]
- 11.Bruewer M, Luegering A, Kucharzik T, et al. Proinflammatory cytokines disrupt epithelial barrier function by apoptosis-independent mechanisms. J Immunol. 2003;171:6164–6172. doi: 10.4049/jimmunol.171.11.6164. [DOI] [PubMed] [Google Scholar]
- 12.Christensen EI, Devuyst O, Dom G, et al. Loss of chloride channel ClC-5 impairs endocytosis by defective trafficking of megalin and cubilin in kidney proximal tubules. Proc Natl Acad Sci U S A. 2003;100:8472–8477. doi: 10.1073/pnas.1432873100. [DOI] [PMC free article] [PubMed] [Google Scholar]
- 13.Clayburgh DR, Musch MW, Leitges M, et al. Coordinated epithelial NHE3 inhibition and barrier dysfunction are required for TNF-mediated diarrhea in vivo. J Clin Invest. 2006;116:2682–2694. doi: 10.1172/JCI29218. [DOI] [PMC free article] [PubMed] [Google Scholar]
- 14.Cominelli F. Cytokine-based therapies for Crohn's disease--new paradigms. N Engl J Med. 2004;351:2045–2048. doi: 10.1056/NEJMp048253. [DOI] [PubMed] [Google Scholar]
- 15.Donowitz M, Li X. Regulatory binding partners and complexes of NHE3. Physiol Rev. 2007;87:825–872. doi: 10.1152/physrev.00030.2006. [DOI] [PubMed] [Google Scholar]
- 16.Dykhuizen RS, Masson J, McKnight G, et al. Plasma nitrate concentration in infective gastroenteritis and inflammatory bowel disease. Gut. 1996;39:393–395. doi: 10.1136/gut.39.3.393. [DOI] [PMC free article] [PubMed] [Google Scholar]
- 17.Ejderhamn J, Finkel Y, Strandvik B. Na,K-ATPase activity in rectal mucosa of children with ulcerative colitis and Crohn's disease. Scand J Gastroenterol. 1989;24:1121–1125. doi: 10.3109/00365528909089265. [DOI] [PubMed] [Google Scholar]
- 18.Elson CO, Cong Y, Lorenz R, et al. New developments in experimental models of inflammatory bowel disease. Curr Opin Gastroenterol. 2004;20:360–367. doi: 10.1097/00001574-200407000-00010. [DOI] [PubMed] [Google Scholar]
- 19.Engels BM, Hutvagner G. Principles and effects of microRNA-mediated post-transcriptional gene regulation. Oncogene. 2006;25:6163–6169. doi: 10.1038/sj.onc.1209909. [DOI] [PubMed] [Google Scholar]
- 20.Gawenis LR, Stien X, Shull GE, et al. Intestinal NaCl transport in NHE2 and NHE3 knockout mice. Am J Physiol Gastrointest Liver Physiol. 2002;282:G776–G784. doi: 10.1152/ajpgi.00297.2001. [DOI] [PubMed] [Google Scholar]
- 21.Greig E, Sandle GI. Diarrhea in ulcerative colitis. The role of altered colonic sodium transport. Ann N Y Acad Sci. 2000;915:327–332. doi: 10.1111/j.1749-6632.2000.tb05260.x. [DOI] [PubMed] [Google Scholar]
- 22.Guan Y, Dong J, Tackett L, et al. NHE2 is the main apical Na+/H+ exchanger in mouse colonic crypts but an alternative Na+ -dependent acid extrusion mechanism is upregulated in NHE2-null mice. Am J Physiol Gastrointest Liver Physiol. 2006;291:689–699. doi: 10.1152/ajpgi.00342.2005. [DOI] [PubMed] [Google Scholar]
- 23.Han X, Fink MP, Delude RL. Proinflammatory cytokines cause NO*-dependent and -independent changes in expression and localization of tight junction proteins in intestinal epithelial cells. Shock. 2003;19:229–237. doi: 10.1097/00024382-200303000-00006. [DOI] [PubMed] [Google Scholar]
- 24.Harris J, Archampong EQ, Clark CG. The effect of salazopyrin on water and electrolyte transport in the human colon measured in vivo and in vitro. Gut. 1972;13:855. [PubMed] [Google Scholar]
- 25.Hawker PC, McKay JS, Turnberg LA. Electrolyte transport across colonic mucosa from patients with inflammatory bowel disease. Gastroenterology. 1980;79:508–511. [PubMed] [Google Scholar]
- 26.Hoogerwerf WA, Tsao SC, Devuyst O, et al. NHE2 and NHE3 are human and rabbit intestinal brush-border proteins. Am J Physiol. 1996;270:G29–G41. doi: 10.1152/ajpgi.1996.270.1.G29. [DOI] [PubMed] [Google Scholar]
- 27.Khundmiri SJ, Weinman EJ, Steplock D, et al. Parathyroid hormone regulation of NA+,K+-ATPase requires the PDZ 1 domain of sodium hydrogen exchanger regulatory factor-1 in opossum kidney cells. J Am Soc Nephrol. 2005;16:2598–2607. doi: 10.1681/ASN.2004121049. [DOI] [PubMed] [Google Scholar]
- 28.Kreimann EL, Morales FC, de Orbeta-Cruz J, et al. Cortical stabilization of beta-catenin contributes to NHERF1/EBP50 tumor suppressor function. Oncogene. 2007;26:5290–5299. doi: 10.1038/sj.onc.1210336. [DOI] [PubMed] [Google Scholar]
- 29.Laubitz D, Larmonier CB, Bai A, et al. Colonic gene expression profile in NHE3-deficient mice: evidence for spontaneous distal colitis. Am J Physiol Gastrointest Liver Physiol. 2008;295:G63–G77. doi: 10.1152/ajpgi.90207.2008. [DOI] [PMC free article] [PubMed] [Google Scholar]
- 30.Li X, Galli T, Leu S, et al. Na+-H+ exchanger 3 (NHE3) is present in lipid rafts in the rabbit ileal brush border: a role for rafts in trafficking and rapid stimulation of NHE3. J Physiol. 2001;537:537–552. doi: 10.1111/j.1469-7793.2001.00537.x. [DOI] [PMC free article] [PubMed] [Google Scholar]
- 31.Magro F, Fraga S, Ribeiro T, et al. Intestinal Na+-K+-ATPase activity and molecular events downstream of interferon-gamma receptor stimulation. Br J Pharmacol. 2004;142:1281–1292. doi: 10.1038/sj.bjp.0705895. [DOI] [PMC free article] [PubMed] [Google Scholar]
- 32.McCole DF, Rogler G, Varki N, et al. Epidermal growth factor partially restores colonic ion. Gastroenterology. 2005;129:591–608. doi: 10.1016/j.gastro.2005.06.004. [DOI] [PubMed] [Google Scholar]
- 33.Morales FC, Takahashi Y, Kreimann EL, et al. Ezrin-radixin-moesin (ERM)-binding phosphoprotein 50 organizes ERM proteins at the apical membrane of polarized epithelia. Proc Natl Acad Sci U S A. 2004;101:17705–17710. doi: 10.1073/pnas.0407974101. [DOI] [PMC free article] [PubMed] [Google Scholar]
- 34.Murtazina R, Kovbasnjuk O, Zachos NC, et al. Tissue-specific regulation of sodium/proton exchanger isoform 3 activity in Na(+)/H(+) exchanger regulatory factor 1 (NHERF1) null mice. cAMP inhibition is differentially dependent on NHERF1 and exchange protein directly activated by cAMP in ileum versus proximal tubule. J Biol Chem. 2007;282:25141–25151. doi: 10.1074/jbc.M701910200. [DOI] [PubMed] [Google Scholar]
- 35.Murthy SN, Cooper HS, Shim H, et al. Treatment of dextran sulfate sodium-induced murine colitis by intracolonic cyclosporin. Dig Dis Sci. 1993;38:1722–1734. doi: 10.1007/BF01303184. [DOI] [PubMed] [Google Scholar]
- 36.Musch MW, Clarke LL, Mamah D, et al. T cell activation causes diarrhea by increasing intestinal permeability and inhibiting epithelial Na+/K+-ATPase. J Clin Invest. 2002;110:1739–1747. doi: 10.1172/JCI15695. [DOI] [PMC free article] [PubMed] [Google Scholar]
- 37.Podolsky DK. Inflammatory bowel disease. N Engl J Med. 2002;347:417–429. doi: 10.1056/NEJMra020831. [DOI] [PubMed] [Google Scholar]
- 38.Rachmilewitz D, Karmeli F, Sharon P. Decreased colonic Na-K-ATPase activity in active ulcerative colitis. Isr J Med Sci. 1984;20:681–684. [PubMed] [Google Scholar]
- 39.Rocha F, Musch MW, Lishanskiy L, et al. IFN-gamma downregulates expression of Na(+)/H(+) exchangers NHE2 and NHE3 in rat intestine and human Caco-2/bbe cells. Am J Physiol Cell Physiol. 2001;280:C1224–C1232. doi: 10.1152/ajpcell.2001.280.5.C1224. [DOI] [PubMed] [Google Scholar]
- 40.Sandle GI. Salt and water absorption in the human colon: a modern appraisal. Gut. 1998;43:294–299. doi: 10.1136/gut.43.2.294. [DOI] [PMC free article] [PubMed] [Google Scholar]
- 41.Sartor RB. Mechanisms of disease: pathogenesis of Crohn's disease and ulcerative colitis. Nat Clin Pract Gastroenterol Hepatol. 2006;3:390–407. doi: 10.1038/ncpgasthep0528. [DOI] [PubMed] [Google Scholar]
- 42.Schultheis PJ, Clarke LL, Meneton P, et al. Renal and intestinal absorptive defects in mice lacking the NHE3 Na+/H+ exchanger. Nat Genet. 1998;19:282–285. doi: 10.1038/969. [DOI] [PubMed] [Google Scholar]
- 43.Strober W, Fuss I, Mannon P. The fundamental basis of inflammatory bowel disease. J Clin Invest. 2007;117:514–521. doi: 10.1172/JCI30587. [DOI] [PMC free article] [PubMed] [Google Scholar]
- 44.Sugi K, Musch MW, Field M, et al. Inhibition of Na+,K+-ATPase by interferon gamma down-regulates intestinal epithelial transport and barrier function. Gastroenterology. 2001;120:1393–1403. doi: 10.1053/gast.2001.24045. [DOI] [PubMed] [Google Scholar]
- 45.Targan S, Shanahan F, Karp LC. Inflammatory Bowel Disease: From Bench to Bedside. 2nd Edition Springer; 2003. [Google Scholar]
- 46.Wang Y, Cai H, Cebotaru L, et al. ClC-5: role in endocytosis in the proximal tubule. Am J Physiol Renal Physiol. 2005;289:F850–F862. doi: 10.1152/ajprenal.00011.2005. [DOI] [PubMed] [Google Scholar]
Associated Data
This section collects any data citations, data availability statements, or supplementary materials included in this article.


