Abstract
Purpose
A maximum P-wave duration (Pmax) of ≥ 110 msec and a P-wave dispersion (PWD) ≥ 40 msec are accepted indicators of a disturbance in interatrial conduction and an inhomogeneous propagation of the sinus impulse, respectively. The left atrial (LA) volume has been reported to be strongly associated with a systolic and diastolic dysfunction and is considered to be an index of atrial remodeling. We aimed to investigate the relationship between LA volume and Pmax or PWD in patients with congestive heart failure (CHF).
Patients and Methods
Sixty-one patients with CHF were enrolled in this study. The study population was classified into four groups: two groups were divided according to the Pmax (≥ 110 msec or < 110 ms), and the other two groups were formed based on the PWD (≥ 40 msec or < 40 msec). The left atrial volume index (LAVi) was measured by three-dimensional (3-D) transthoracic echocardiography. The Pmax and PWD were measured from a 12-lead electrocardiogram.
Results
There were significant differences in the ejection fraction (EF), diastolic function, and LAVi between patients with a Pmax ≥ 110 ms or a PWD ≥ 40 ms and those with a Pmax < 110 ms or a PWD < 40 ms. The LAVi was independently associated with a disturbance in interatrial conduction and an inhomogeneous propagation of the sinus impulse. The LAVi can be used to identify patients with a disturbance in interatrial conduction and an inhomogeneous propagation of the sinus impulse with reasonably good accuracy.
Conclusion
We concluded that a disturbance in interatrial conduction and an inhomogenous propagation of the sinus impulse in patients with CHF is associated with an increase in the LA volume and a deleterious systolic and diastolic dysfunction.
Keywords: P-wave duration, P-wave dispersion, heart failure, left atrial volume
INTRODUCTION
The prolongation of P-wave duration is an accepted indicator of a disturbance in the interatrial conduction and is depicted as a prolonged P-wave ( ≥ 110 msec) on an electrocardiogram (ECG).1,2 A lead-variable P-wave duration is an indicator of site-dependent, inhomogeneous and discontinuous propagation of the sinus impulse and is generally evaluated using P-wave dispersion (PWD).3,4 PWD is defined as the difference between the maximum (Pmax) and minimum P-wave duration (Pmin) on ECG and is shown as an increased PWD ( ≥ 40 msec).3 Left atrial (LA) enlargement is predictive of a future stroke, atrial fibrillation, and death.5,6 Previous studies have reported that many cardiovascular diseases can potentially lead to systolic and diastolic dysfunction, an increase in the filling pressure, and atrial remodeling from chronic pressure overload.7,8 The LA volume has been reported to be a representation of systolic and diastolic dysfunction, the cumulative effect of the filling pressure over time, and also a marker of atrial remodeling.7,8 The correlation between the LA volume and an abnormality in the electrical conduction of the atrium in patients with congestive heart failure (CHF) has not been well established. This study examined the relationship between the LA volume indexed to the body surface area and a disturbance in the interatrial conduction (Pmax ≥ 110 msec) or an inhomogeneous propagation of the sinus impulse (PWD ≥ 40 msec) in patients with CHF.
PATIENTS AND METHODS
Study population
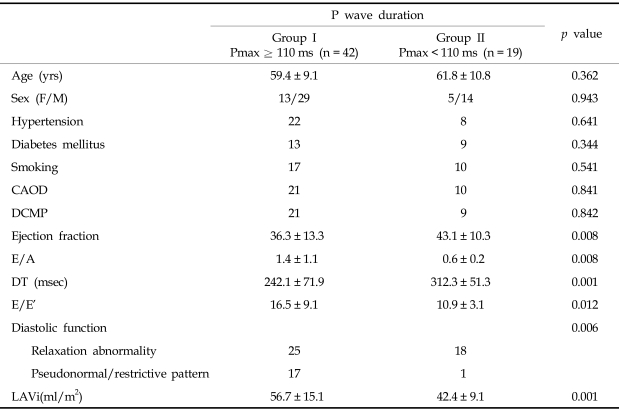
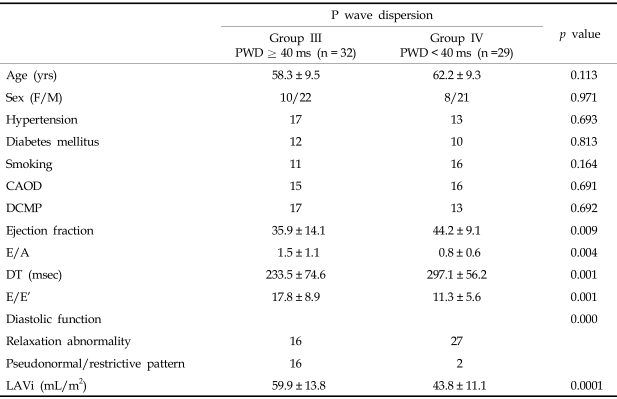
We performed two-dimensional (2-D) echocardiography in 61 congestive heart failure patients. Patients met the inclusion criteria if they had experienced heart failure of New York Heart Association (NYHA) class II or greater for at least three months, if they had an LV ejection fraction < 55% as assessed by echocardiography, and if they had been on stable medication (ACE inhibitor, ARB, diuretics and beta blocker) for at least three months. Patients with atrial fibrillation, valvular heart disease including mitral regurgitation greater than grade I, or a history drug use that could affect atrial conduction were excluded. The study population was classified into two groups according to the Pmax. Group I contained 43 patients with a Pmax ≥ 110 msec, and Group II consisted of 19 patients with a Pmax < 110 ms (Table 1). The population was also classified into two groups according to the PWD. Group III contained 32 patients with a PWD ≥ 40 ms, and Group IV contained 29 patients with a PWD < 40 ms (Table 2).
Table 1.
Comparison of Clinical, Echocardiographic Features of Patients with and without Disturbances in the Interatrial Conduction
CAOD, coronary artery obstructive disease; DCMP, dilated cardiomyopathy; DT, deceleration time; LAVi, left atrial volume index; F/M, female/male.
Table 2.
Comparison of Clinical, Echocardiographic Feature of Patients with and without an Inhomogeneous Propagation of the Sinus Impulse
CAOD, coronary artery obstructive disease; DCMP, dilated cardiomyopathy; DT, deceleration time; LAVi, left atrial volume index; F/M, female/male.
12-lead surface ECG
A 12-lead surface ECG was obtained from all patients while in the supine position. All ECGs were recorded at a paper speed of 25 mm/s with 1 mV/cm standardization. The patients were allowed to breathe freely but asked to refrain from speaking or coughing during recording. The P-wave duration was measured manually by an investigator who was blinded to the clinical status of the patients. The P-wave duration was measured using a magnifying lens and a 0.5 mm-scale precision ruler, as described previously.3 The onset of the P-wave was defined as the junction between the isoelectric line and the beginning of the P-wave deflection. The offset of the P-wave was defined as the junction between the end of the P-wave and the isoelectric line. The Pmax and Pmin were measured in all 12-lead surface ECGs. The PWD was defined as the difference between the Pmax and Pmin. Intraobserver and interobserver coefficients of variation (the SD of differences between two observations divided by the mean value and expressed as a percent) were found to be 3.7% and 4.41% for Pmax and 4.2% and 6.9% for PWD, respectively.
2-Dimensional echocardiography (2DE)
An experienced sonographer acquired the parasternal long axis and apical views by harmonic imaging using a transthoracic 3-MHz phased-array transducer (Sonos 7500, Philips Medical Systems, Andover, MA, USA). The sample volume of the pulsed-wave Doppler was placed between the tips of the mitral leaflets in the apical four-chamber view. The early (E) and late (A) transmitral flow velocities, along with their ratios (E/A) and the deceleration time (DT) of the E velocity, were obtained.
Pulsed-wave tissue Doppler imaging (TDI) was performed by positioning the sample volume at the lateral side of the mitral annulus in the apical four-chamber view. The early (E') and late (A') mitral annular velocities were measured and the E-to-E' ratios were calculated.
The left ventricular (LV) diastolic function was assessed by the 2DE and Doppler-derived measurements. An LV diastolic dysfunction was differentiated into three stages according to the LV filling pattern using the Doppler measurements of the transmitral inflow. A relaxation abnormality was defined as a DT > 250 ms and an E/A < 1.0. A pseudonormal pattern was defined as 160 < DT < 250 ms and E/A > 1.0. A restrictive pattern was defined as DT < 160 ms and E/A > 1.5.
3-Dimensional echocardiography
Real-time 3-dimensional Echocardiography (RT3DE) was carried out using a commercially available system (Live 3D Echo, Sonos 7500, Phillips, Co. Andover, MA, USA). The RT3DE images were obtained from an apical window in the same position. The images were also obtained over four cardiac cycles using a matrix-array ultrasonographic transducer. Care was taken to include the entire endocardial border in the volumetric data set. The off-line 3-dimensional LA volume measurements were carried out using 3D computer software (4D LV analysis, TomTec, Co. Germany).
The 3D data were segmented into eight rotational apical planes (angle increment = 20°) around the rotational axis from the LV apex through the center of the mitral annulus. Endocardial contour tracing was then performed manually. The LA volume index (LAVi) was calculated from the ratio of the LA volume to the body surface area.
Statistical analysis
The data are presented as a mean value ± SD. Statistical analyses were performed with SPSS statistical software (SPSS 12.0K, Inc., Chicago, IL, USA). The univariate characteristics between those both with and without a disturbance in the interatrial conduction or an inhomogeneous propagation of the sinus impulse were compared using a Student's t-test for the continuous variables and/or a chi-square test for the categorical variables. A model was constructed using a stepwise logistic regression to identify the subset of variables that jointly predicted a disturbance in the interatrial conduction or an inhomogeneous propagation of the sinus impulse. All the variables whose univariate tests resulted in a p value < 0.2 were considered in the multiple logistic regression model. A receiver-operator characteristic (ROC) curve analysis was used to determine the predictive accuracy of the LAVi for detecting a disturbance in interatrial conduction and an inhomogeneous propagation of the sinus impulse in patients with CHF. A p-value < 0.05 was considered significant.
RESULTS
Clinical and study characteristics of the patients with and without a disturbance in interatrial conduction
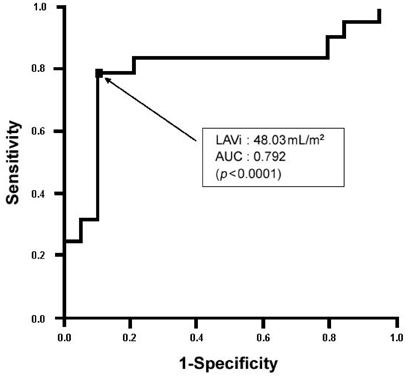
Sixty-one patients were dichotomized upon entering the study according to the presence of a disturbance in interatrial conduction. Forty-two patients (Group I) had a disturbance in interatrial conduction (Pmax ≥ 110 ms) and 19 patients (Group II) did not (Pmax < 110 ms). There were no significant differences with regard to age, gender, or underlying structural heart disease between Groups I and II. However, there were significant differences in the LVEF, E/A, DT, E/E', and LAVi between the two groups (Table 1). Multiple logistic regression analyses revealed that the LAVi was significantly associated with a disturbance in interatrial conduction (Table 3). The ROC curve showed that the LAVi determined by RT3DE (LAVi ≥ 48.03 mL/m2) separates patients with a disturbance in interatrial conduction with an accuracy of 0.792, a sensitivity of 78.0%, a specificity of 89.5%, a positive predictive value of 78.1%, and a negative predictive value of 89.5% (Fig. 1).
Table 3.
Multivariate Logistic Regression Analysis of Independent Parameters for the Presence of a Disturbance in the Interatrial Conduction in Patients with Congestive Heart Failure
DT, deceleration time; LAVi, left atrial volume index.
Fig. 1.

On the ROC curve, the AUC of the LAVi for predicting a disturbance in the interatrial conduction was 0.792 (sensitivity 78.0%, specificity 89.5%, positive predictive value 78.1%, negative predictive value 89.5%), and the optimum cut-off point was 48.03 mL/m2 (p < 0.0001). ROC, receiver operating characteristic; AUC, accuracy; LAVi, left atrial volume index.
Clinical and study characteristics of patients with and without an inhomogeneous and discontinuous propagation of the sinus impulse
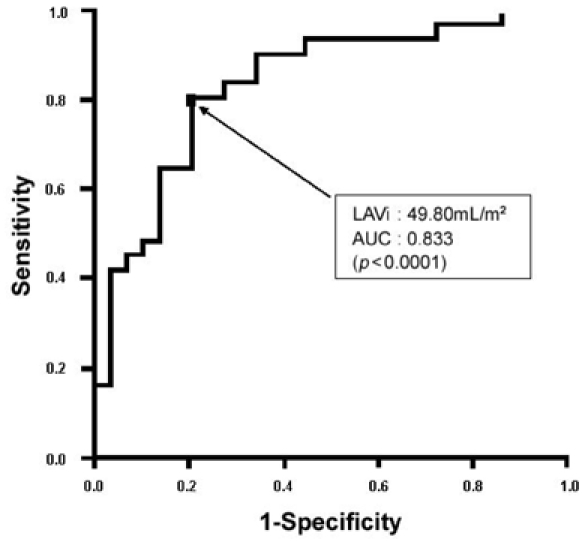
Sixty-one patients were dichotomized upon entering the study according to the presence of an inhomogeneous and discontinuous propagation of the sinus impulse. Thirty-two patients (Group III) had an inhomogeneous and discontinuous propagation of the sinus impulse (PWD ≥ 40 ms), and 29 patients (Group IV) did not (PWD < 40 ms). There were no significant differences between Groups III and IV with regard to age, gender or underlying structural heart disease. However, there were significant differences in the LVEF, E/A, DT, E/E', and LAVi between the two groups (Table 2). Multiple logistic regression analyses revealed the LAVi to be significantly associated with an inhomogeneous and discontinuous propagation of the sinus impulse (Table 4). The ROC curve showed that the LAVi by RT3DE (LAVi ≥ 49.80 mL/m2) also separates patients with an inhomogeneous propagation of the sinus impulse with an accuracy of 0.833, a sensitivity of 80.6%, a specificity of 79.3%, a positive predictive value of 80.6%, and a negative predictive value of 79.3% (Fig. 2).
Table 4.
Multivariate Logistic Regression Analysis of the Independent Parameters for the Presence of an Inhomogeneous Propagation of the Sinus Impulse in Patients with Congestive Heart Failure
DT, deceleration time; LAVi, left atrial volume index.
Fig. 2.

On the ROC curve, the AUC of LAVi for predicting an inhomogeneous propagation of the sinus impulse was 0.833 (sensitivity 80.6%, specificity 79.3%, positive predictive value 80.6%, negative predictive value 79.3%), and the optimum cut-off point was 49.80 mL/m2 (p < 0.0001). ROC, receiver operating characteristic; AUC, accuracy, LAVi, left atrial volume index.
DISCUSSION
The Pmax and PWD were significantly higher in patients with paroxysmal atrial fibrillation.9 It was previously reported3 that a Pmax of 110 ms and a PWD of 40 ms might be useful for distinguishing patients with a history of paroxysmal atrial fibrillation from healthy subjects during the sinus rhythm. The criterion for a defect in interatrial conduction in this study was a Pmax ≥ 110 ms.1,2 A disturbance in interatrial conduction is a delay in conduction between the atria due to an abnormality in the Bachmann bundle1,2 and is associated with LA enlargement and pathophysiological derangements resulting in atrial tachyarrhythmia, LA electromechanical dysfunction, and embolism.10,11 PWD is defined as the difference between the maximum and minimum P-wave duration, and it has been reported to be associated with inhomogeneous and discontinuous atrial conduction of the sinus impulse. A PWD ≥ 40 ms has been used to identify patients with paroxysmal atrial fibrillation.3 In this study, a PWD ≥ 40 ms was used to define the site-dependent inhomogeneous and discontinuous propagation of the sinus impulses.
The systolic and diastolic functions are important prognostic indicators of a number of cardiac conditions, and problems with these functions are significant causes of heart failure. Recently, they have even been linked to the development of atrial fibrillation.8,12 The LA volume has also been reported to be strongly associated with systolic and diastolic dysfunction and is considered to be an index of atrial remodeling.7,8,13 P-wave abnormalities have been reported to be associated with LA enlargement,14,15 LA hypertension,16 altered conduction,17 or a combination of many factors.18,19 One study reported that the Pmax and PWD were significantly higher in patients with dilated cardiomyopathy than in the control subjects.20 The LA diameter was significantly higher, and the left ventricular ejection fraction was significantly lower in patients with dilated cardiomyopathy.20 However, there are no reports of a relationship between the LA volume and the Pmax or PWD in patients with CHF.
In this study, the presence of a disturbance in interatrial conduction and an inhomogeneous propagation of the sinus impulse in patients with CHF were associated with an increased LA volume and deleterious systolic and diastolic dysfunction. There was an independent association between the LAVi and a disturbance in interatrial conduction or inhomogeneous propagation of the sinus impulse. This association between the LAVi and changes in electrical conduction in the atrium of CHF patients with diastolic dysfunction and lower EF can be explained by the following mechanism. The LA is directly exposed to pressure in the left ventricle that increases with decreasing LV compliance. The LA pressure increases to maintain adequate filling,21 and the increased atrial wall tension leads to chamber dilatation and stretching of the atrial myocardium. This causes a change in the geometry of the atrial fibrils and also in the nonhomogenous fibrosis of the LA wall leading to a disturbance in the interatrial conduction and an inhomogeneous conduction of the sinus impulse.12 Wong et al.22 reported the right atrial mechanoelectrical remodeling phenomenon after a Fontan operation. The Fontan right atrium remodels and dilates. Structural remodeling and dilation occur in conjunction with changes in the electrophysiological properties, as manifested by the atrial conduction delay and the imbalance of the conduction homogenicity.22 Therefore, the Pmax and PWD are longer in patients late after the Fontan procedures, which correlates well with the atrial dimension.22
This study showed that a disturbance in the interatrial conduction may appear as an LAVi ≥ 48.03 mL/m2, and inhomogeneous conduction of the sinus impulse may also appear as an LAVi ≥ 49.80 mL/m2.
Although there are considerable volumes of data on the relationship between LA dimensions and the Pmax or PWD,23,24 there are less data on the relationship between the LA volume and the Pmax or PWD. Because the LA may become less spherical as it remodels, the LA volume may be considered a more sensitive index of LA remodeling than the LA dimension. Previous studies have shown that the 2-dimensional LA volume calculation underestimates the LA volume by more than 20%.25,26 This limitation of the 2DE result arises from difficulties in reproducing the same cut planes in the sequential studies and the limitation of simplified geometric formulas in describing the LA.27 Recently, LA volume quantitation by RT3DE demonstrated the feasibility and accuracy of this method in quantifying LA volume.27 In this study, a better estimation of the LA enlargement could be obtained using RT3DE.
There were some limitations to this study. The sample size was relatively small, which highlights the need for larger studies. Special care was taken to obtain good quality ECGs. However, this is not always possible in clinical practice, and a modest quality of the P-wave inscriptions on the ECGs is expected to limit the clinical value of these observations.
In conclusion, the presence of a disturbance in interatrial conduction and an inhomogeneous propagation of the sinus impulse in patients with congestive heart failure is associated with an increased LA volume and a deleterious systolic and diastolic dysfunction.
References
- 1.Bayes De Luna A. Clinical electrocardiography: a textbook. New York, NY: Futura Company; 1998. Electrocardiographic alteration due to atrial pathology; pp. 169–171. [Google Scholar]
- 2.Willems JL, Robles de Medina EO, Bernard R, Coumel P, Fisch C, Krikler D, et al. Criteria for intraventricular conduction disturbances and preexcitation. World Health Organizational/International Society and Federation of Cardiology Task Force Ad Hoc. J Am Coll Cardiol. 1985;5:1261–1275. doi: 10.1016/s0735-1097(85)80335-1. [DOI] [PubMed] [Google Scholar]
- 3.Dilaveris PE, Gialafos EJ, Sideris SK, Theopistou AM, Andrikopoulos GK, Kyriakidis M, et al. Simple electrocardiographic markers for the prediction of paroxysmal idiopathic atrial fibrillation. Am Heart J. 1998;135:733–738. doi: 10.1016/s0002-8703(98)70030-4. [DOI] [PubMed] [Google Scholar]
- 4.Dilaveris PE, Gialafos EJ, Andrikopoulos GK, Richter DJ, Papanikolaou V, Poralis K, et al. Clinical and electrocardiographic predictors of recurrent atrial fibrillation. Pacing Clin Electrophysiol. 2000;23:352–358. doi: 10.1111/j.1540-8159.2000.tb06761.x. [DOI] [PubMed] [Google Scholar]
- 5.Benjamin EJ, D'Agostino RB, Belanger AJ, Wolf PA, Levy D. Left atrial size and the risk of stroke and death. The Framingham Heart Study. Circulation. 1995;92:835–841. doi: 10.1161/01.cir.92.4.835. [DOI] [PubMed] [Google Scholar]
- 6.Tsang TS, Barnes ME, Bailey KR, Leibson CL, Montgomery SC, Takemoto Y, et al. Left atrial volume: important risk marker of incident atrial fibrillation in 1665 older men and women. Mayo Clin Proc. 2001;76:467–475. doi: 10.4065/76.5.467. [DOI] [PubMed] [Google Scholar]
- 7.Pritchett AM, Mahoney DW, Jacobsen SJ, Rodeheffer RJ, Karon BL, Redfield MM. Diastolic dysfunction and left atrial volume: a population-based study. J Am Coll Cardiol. 2005;45:87–92. doi: 10.1016/j.jacc.2004.09.054. [DOI] [PubMed] [Google Scholar]
- 8.Gottdiener JS, Kitzman DW, Aurigemma GP, Arnold AM, Manolio TA. Left atrial volume, geometry, and function in systolic and diastolic heart failure of persons ≥ 65 years of age (The Cardiovascular Health Study) Am J Cardiol. 2006;97:83–89. doi: 10.1016/j.amjcard.2005.07.126. [DOI] [PubMed] [Google Scholar]
- 9.Poli S, Barbaro V, Bartolini P, Calcagnini G, Censi F. Prediction of atrial fibrillation from surface ECG: review of methods and algorithms. Ann Ist Super Sanita. 2003;39:195–203. [PubMed] [Google Scholar]
- 10.Goyal SB, Spodick DH. Electromechanical dysfunction of the left atrium associated with interatrial block. Am Heart J. 2001;142:823–827. doi: 10.1067/mhj.2001.118110. [DOI] [PubMed] [Google Scholar]
- 11.Ramsaran EK, Spodick DH. Electromechanical delay in the left atrium as a consequence of interatrial block. Am J Cardiol. 1996;77:1132–1134. doi: 10.1016/s0002-9149(96)00149-x. [DOI] [PubMed] [Google Scholar]
- 12.Tsang TS, Gersh BJ, Appleton CP, Tajik AJ, Barnes ME, Bailey KR, et al. Left ventricular diastolic dysfunction as a predictor of the first diagnosed nonvalvular atrial fibrillation in 840 elderly men and women. J Am Coll Cardiol. 2002;40:1636–1644. doi: 10.1016/s0735-1097(02)02373-2. [DOI] [PubMed] [Google Scholar]
- 13.Tsang TS, Barnes ME, Gersh BJ, Baily KR, Seward JB. Left atrial volume as a morphophysiologic expression of left ventricular diastolic dysfunction and relation to cardiovascular risk burden. Am J Cardiol. 2002;90:1284–1289. doi: 10.1016/s0002-9149(02)02864-3. [DOI] [PubMed] [Google Scholar]
- 14.Snoeck J, Decoster H, Vrints C, Marchand X, Kahn JC, Verherstraeten M, et al. Predictive value of the P wave at implantation for atrial fibrillation after VVI pacemaker implantation. Pacing Clin Electrophysiol. 1992;15:2077–2083. doi: 10.1111/j.1540-8159.1992.tb03025.x. [DOI] [PubMed] [Google Scholar]
- 15.Shettigar UR, Barry WH, Hultgren HN. P wave analysis in ischaemic heart disease. An echocardiographic, haemodynamic, and angiographic assessment. Br Heart J. 1977;39:894–899. doi: 10.1136/hrt.39.8.894. [DOI] [PMC free article] [PubMed] [Google Scholar]
- 16.Waggoner AD, Adyanthaya AV, Quinones MA, Alexander JK. Left atrial enlargement. Echocardiographic assessment of electrocardiographic criteria. Circulation. 1976;54:553–557. doi: 10.1161/01.cir.54.4.553. [DOI] [PubMed] [Google Scholar]
- 17.Sahn DJ, DeMaria A, Kisslo J, Weyman A. Recommendations regarding quantitation in M-mode echocardiography: results of a survey of echocardiographic measurements. Circulation. 1978;58:1072–1083. doi: 10.1161/01.cir.58.6.1072. [DOI] [PubMed] [Google Scholar]
- 18.Schiller NB, Shah PM, Crawford M, DeMaria A, Devereux R, Feigenbaum H, et al. Recommendations for quantitation of the left ventricle by two-dimensional echocardiography. American Society of Echocardiography Committee on Standards, Subcommittee on Quantitation of Two-Dimensional Echocardiograms. J Am Soc Echocardiogr. 1989;2:358–367. doi: 10.1016/s0894-7317(89)80014-8. [DOI] [PubMed] [Google Scholar]
- 19.Devereux RB, Alonso DR, Lutas EM, Gottlieb GJ, Campo E, Sachs I, et al. Echocardiographic assessment of left ventricular hypertrophy: comparison to necropsy findings. Am J Cardiol. 1986;57:450–458. doi: 10.1016/0002-9149(86)90771-x. [DOI] [PubMed] [Google Scholar]
- 20.Senen K, Turhan H, Riza Erbay A, Basar N, Saatci Yasar A, Sahin O, et al. P-wave duration and P-wave dispersion in patients with dilated cardiomyopathy. Eur J Heart Fail. 2004;6:567–569. doi: 10.1016/j.ejheart.2003.12.020. [DOI] [PubMed] [Google Scholar]
- 21.Greenberg B, Chatterjee K, Parmley WW, Werner JA, Holly AN. The influence of left ventricular filling pressure on atrial contribution to cardiac output. Am Heart J. 1979;98:742–751. doi: 10.1016/0002-8703(79)90473-3. [DOI] [PubMed] [Google Scholar]
- 22.Wong T, Davlouros PA, Li W, Millington-Sanders C, Francis DP, Gatzoulis MA. Mechano-electrical interaction late after Fontan operation: relation between P-wave duration and dispersion, right atrial size, and atrial arrhythmias. Circulation. 2004;109:2319–2325. doi: 10.1161/01.CIR.0000129766.18065.DC. [DOI] [PubMed] [Google Scholar]
- 23.Ariyarajah V, Mercado K, Apiyasawat S, Puri P, Spodick DH. Correlation of left atrial size with p-wave duration in interatrial block. Chest. 2005;128:2615–2618. doi: 10.1378/chest.128.4.2615. [DOI] [PubMed] [Google Scholar]
- 24.Gunduz H, Binak E, Arinc H, Akdemir R, Ozhan H, Tamer A, et al. The relationship between P wave dispersion and diastolic dysfunction. Tex Heart Inst J. 2005;32:163–167. [PMC free article] [PubMed] [Google Scholar]
- 25.Kircher B, Abbott JA, Pau S, Gould RG, Himelman RB, Higgins CB, et al. Left atrial volume determination by biplane two-dimensional echocardiography: validation by cine computed tomography. Am Heart J. 1991;121:864–871. doi: 10.1016/0002-8703(91)90200-2. [DOI] [PubMed] [Google Scholar]
- 26.Schabelman S, Schiller NB, Silverman NH, Ports TA. Left atrial volume estimation by two-dimensional echocardiography. Cathet Cardiovasc Diagn. 1981;7:165–178. doi: 10.1002/ccd.1810070206. [DOI] [PubMed] [Google Scholar]
- 27.Khankirawatana B, Khankirawatana S, Lof J, Porter TR. Left atrial volume determination by three-dimensional echocardiography reconstruction: validation and application of a simplified technique. J Am Soc Echocardiogr. 2002;15:1051–1056. doi: 10.1067/mje.2002.122080. [DOI] [PubMed] [Google Scholar]


