INTRODUCTION
In recent years, there has been a strong push to identify bioavailability problems of a drug formulation based on the results of appropriately designed dissolution experiments. Particularly for immediate release (IR) dosage forms, the paddle apparatus has evolved as the method of choice for this purpose (1,2). However, standard paddle experiments require both large volumes of test media which, particularly when using biorelevant media, can be cost intensive and large sample sizes that are typically not available in the early stage development when the main objective is to characterize the physicochemical properties of the active ingredient and the final formulation has not been established. Therefore, it would be very helpful to use a test system that requires smaller sample sizes and smaller volumes of media but has the same reliability and predictivity as the standard test apparatus. In the last decades, various types of miniaturized paddle apparatus have been introduced to the market. However, most of these miniaturized systems do not exactly reflect the hydrodynamic conditions in the standard paddle apparatus.
The objective of the present series of tests was to determine if standard paddle experiments could be scaled down without losing the reliability and the predictability of the standard method. Currently there are several miniaturized paddle apparatus on the market, but their dimensions do not correspond with those described in the pharmacopoeia. Therefore it is likely that the resulting dissolution profiles may not always be comparable with those generated in the standard setup. The standardization of the miniaturized equipment was considered as fundamental for a subsequent scale up to standard conditions and for the acceptance by regulatory agencies if this method should also be used for quality control. The mini paddle setup used in the present series of test was constructed based on the pharmacopoeial dimensions. Of particular concern are the hydrodynamic conditions, since these are known to influence in vivo dissolution of drugs after their oral administration (3,4). However, provided suitable in vitro test conditions are chosen, it is often possible to predict dissolution limitations to oral absorption of drugs and to reflect variations in hydrodynamic conditions in the upper gastrointestinal tract (5). For this purpose, drug release profiles of four IR dosage forms containing drugs that belong to the biopharmaceutics classification system (BCS) classes I, II, III, and IV (6–8) were compared in the paddle and the mini paddle under different hydrodynamic conditions, i.e., paddle stirring speeds of 50, 75, 100, and 125 rpm.
MATERIALS AND METHODS
Products Studied
Diazepam (BCS I): Diazepam STADA™ 10 mg (lot # 1552, STADApharm GmbH, Bad Vilbel, Germany)
Metoprolol (BCS I): Metoprolol 50 Heumann (lot # 112639, Heumann Pharma GmbH, Nuernberg, Germany)
Prednisolon (BCS I): PREDNI H Tablinen™ 5 mg (lot # 1220122J, Lichtenstein Pharmazeutica GmbH & Co., Muehlheim-Kaerlich, Germany)
Ibuprofen (BCS II): IbuHexal™ akut 200 (lot # 61A772, Hexal AG, Holzkirchen, Germany)
Piroxicam (BCS II), Piroxicam 20 Heumann (lot # 102441, Heumann Pharma GmbH, Nuernberg, Germany)
Atenolol (BCS III): Juvental 100 mg (lot # 202040, Henning Arzneimittel GmbH & Co KG, Floersheim, Germany)
Hydrochlorothiazide (BCS III): HCT-beta 25 (lot # 404068, betapharm Arzneimittel GmbH, Augsburg, Germany)
Furosemide (BCS IV): Furosemid Sandoz™ 40 mg Tabletten (lot # 34052, Sandoz Pharmaceuticals GmbH, Ismaning, Germany)
Dissolution Test Conditions
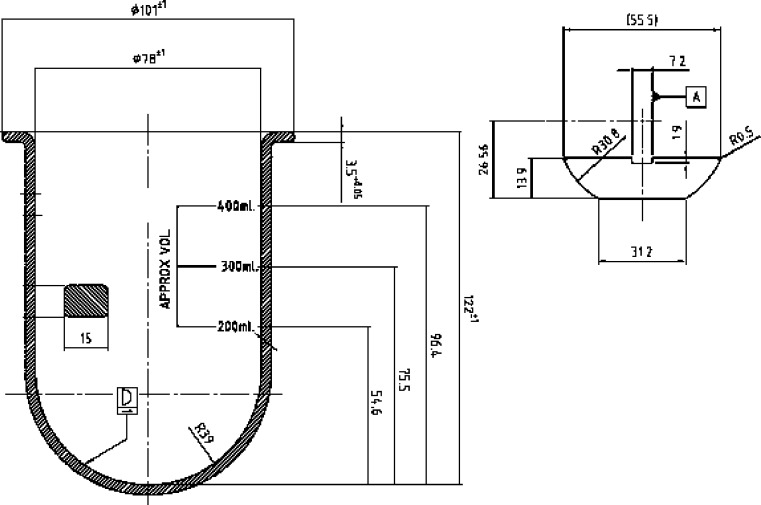
Drug release experiments were performed with the USP paddle (DT 706 HH, Erweka, Heusenstamm, Germany) and the ERWEKA mini paddle (modified DT 600 HH, Erweka, Heusenstamm, Germany). The mini paddle is based on the USP paddle setup but scaled down 1/3 with respect to the dimensions (see Fig. 1 and Table I for the dimensions). Five hundred milliliters of test medium was used in the paddle and 250 ml in the mini paddle apparatus. To keep the experimental conditions as close as possible to the USP specifications, the distance between the mini paddle and the vessel bottom was adjusted to 2/3 of the compendial height.
Fig. 1.
Dimensions of a mini paddle and a mini vessel (courtesy of ERWEKA GmbH, Heusenstamm, Germany)
Table I.
Dimensions of the Constituents of the Standard Paddle and the Mini Paddle Setup
| USP paddle apparatus (mm) | Mini paddle apparatus (mm) | |
|---|---|---|
| Height of the vessel | 160–210 | 122 ± 1 |
| Inner diameter of the vessel | 98–106 | 78 ± 1 |
| Diameter of the shaft | 9.4–10.1 | 7.5 |
| Length of the paddle blade | 74.0–75.0 | 55.5 |
| Thickness of the paddle blade | 4.0 ± 1.0 | 2.7–0.1 |
| Height of the paddle blade | 19.0 ± 0.5 | 13.9 |
| Distance between paddle blade and inside bottom of the vessel | 25 ± 2 | 18 |
As the mini paddle apparatus is not described in the USP, a performance verification test does not exist for this setup. However, as the authors wanted to determine the acceptable performance of this dissolution assembly, they conducted a performance verification test following the official procedure described by the USP and using the official USP calibrator tablets (USP Salicylic Acid Tablets RS, Lot Q0D200 and USP Prednisone Tablets RS, Lot O0C056). In terms of maintaining sink conditions, it was not possible to use 250 ml of test medium in the mini paddle. However, with respect to the subsequent experiments which were performed, it was also intended to keep the volume of test medium as small as possible. As a compromise, 450 ml of phosphate buffer USP pH 7.4 were used for the salicylic acid experiments whereas the volume of water was 350 ml for the prednisone experiments. Simulated gastric fluid without pepsin SGFsp USP 30 pH 1.2 was used as the test medium for diazepam and metoprolol and simulated intestinal fluid without pancreatin SIFsp USP 30 pH 6.8 for prednisolon, piroxicam, atenolol, hydrochlorothiazide, and furosemide. Special attention was given to achieve sink conditions in all experiments. Sink conditions were defined as maintaining a volume of dissolution media that is at least five times greater than the volume at the saturation point of the drug contained in the drug delivery system being tested, in all experiments. For this reason, drug release experiment with formulations containing the poorly soluble weak acid ibuprofen were performed using simulated intestinal fluid without pancreatin with a somewhat higher pH, namely SIFsp USP 23 pH 7.5. In contrast to preliminary studies (9) where mini paddle experiments were run with half of the dose of drug used for the paddle experiments, in the current study, equal doses were used in both setups. For this reason, it was essential to maintain sink conditions in all experiments. Experiments were run at 37 ± 0.5°C applying stirring speeds of 50, 75, 100, and 125 rpm. Samples (5 ml in the paddle and 2.5 ml in the mini paddle) were removed at predetermined time points using a 5- or 3-ml glass syringe (FortunaTM OptimaTM Luer Lock, Wertheim, Germany), respectively. Experiments were run in triplicate and results expressed as mean % (±SD) dissolved at the given sampling time.
UV Analysis
Following appropriate dilution, samples were analyzed at 278.5 (Diazepam STADA™ 10 mg), 273 (Metoprolol 50 Heumann), 246 (PREDNI H Tablinen™ 5 mg), 270 (IbuHexal™ akut 200), 285 (Piroxicam 20 Heumann), 273 (Juvental 100 mg), 316 (HCT-beta 25), and 330 nm (Furosemid Sandoz™ 40 mg) using a UV spectrophotometer (U 2000, Hitachi Ltd, Tokyo, Japan) equipped with a 10-mm cuvette.
In Vitro Dissolution Profile Comparison
The similarity factor f2 (10–12) was calculated to indicate similarity of the two test methods by comparing the release profiles. The f2 comparison has been chosen, since it is one of the simplest methods to comparing dissolution profiles, has been shown as a reliable tool for this purpose, and is well accepted by international regulatory agencies like, e.g., the Food and Drug Administration (FDA) and the European Medicines Agency (EMEA).
The similarity factor f2 is inversely proportional to the average squared difference between two dissolution profiles. During the last decade, f2 calculation has become a recommended method in several FDA Guidances for Industry (13–15). The f2 value is calculated as follows:
 |
where LOG = logarithm base 10, n = number of sampling points, Σ = summation over all time points, and Rt and Tt = the cumulative percentage dissolved at each of the selected time points of the reference and test product, respectively. When the two profiles are identical, f2 = 100, an average difference of 10% at all measured time points results in a f2 value of 50. FDA has set a public standard of 50 ≤ f2 ≤ 100 to indicate similarity between two dissolution profiles. In contrast to the requirements of the FDA guidances, three instead of 12 units of each product were used for similarity testing. However, in accordance with the guidances, dissolution measurements were performed under the same test conditions, and the sampling times used for f2 calculation were the same. Because f2 values are sensitive to the number of dissolution time points, only one measurement was considered after 85% dissolution of the product had been reached (11).
Usually, the f2 comparison is used to compare the quality of different products, containing the same active pharmaceutical ingredient under corresponding dissolution test conditions. However, in the present series of tests, the similarity of dissolution profiles was taken as an indicator for similar hydrodynamics in the two vessels. Similar hydrodynamic conditions in the two dissolution setups are of particular importance for a scale down of the standard setup since it is well known that hydrodynamics in a dissolution vessel are complex and can have a huge impact on the dissolution profiles of a test product. Thus, it is most likely that similar dissolution profiles in the two setups indicate similar hydrodynamic conditions.
Results and discussion
Performance Verification Test
All of the individual calculated values for drug release from the calibrator tablets were in the specified ranges which were 17–25% dissolved at 30 min at 100 rpm for the salicylic acid tablets and 26–47% dissolved at 30 min at 50 rpm for the prednisone tablets. Thus, the mini paddle apparatus passed the slightly modified USP performance verification test and was therefore regarded as suitable for the subsequent series of tests.
Dissolution Experiments
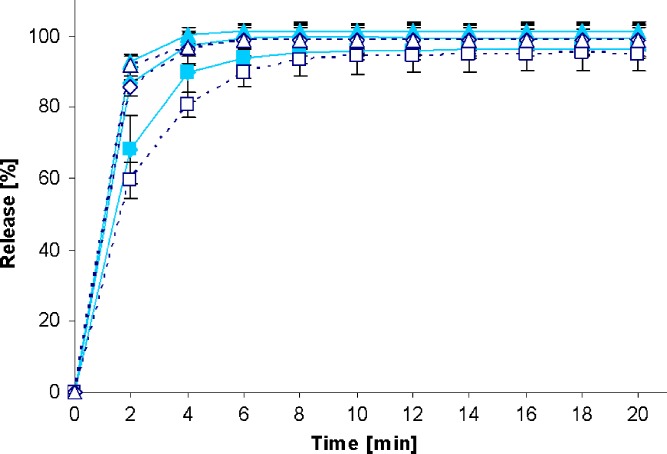
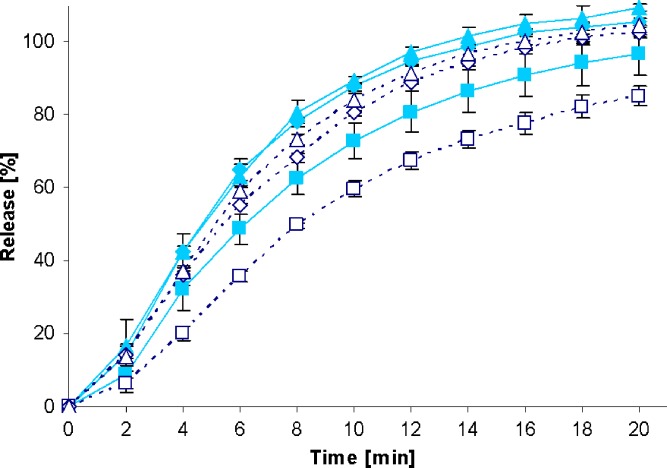
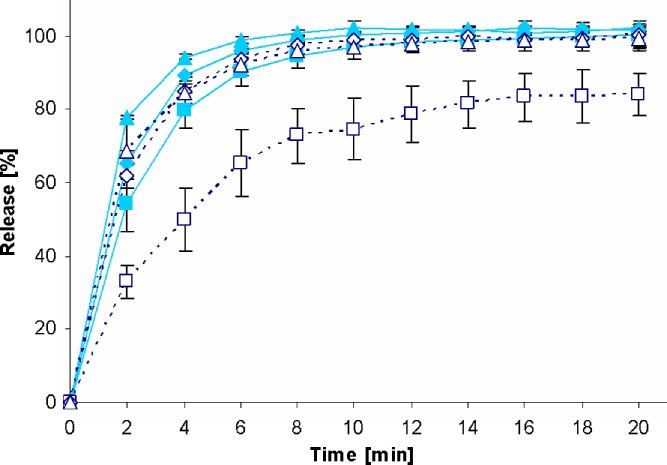
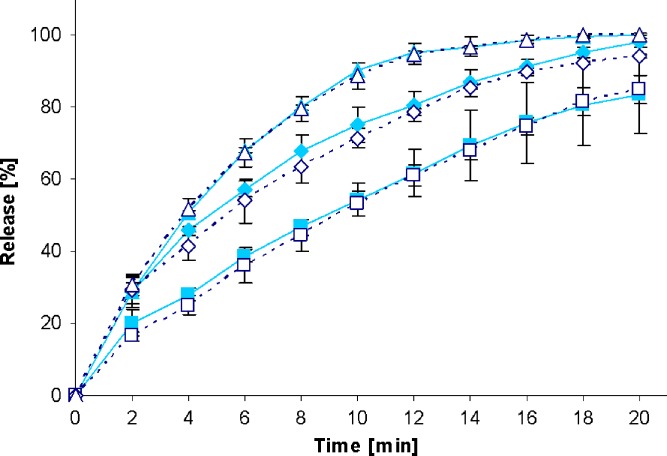
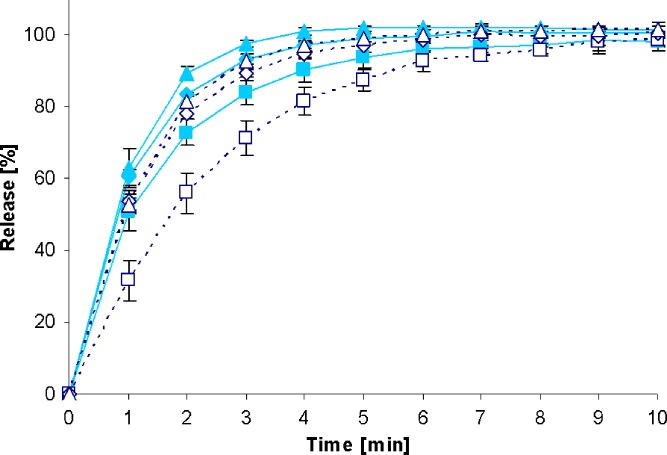
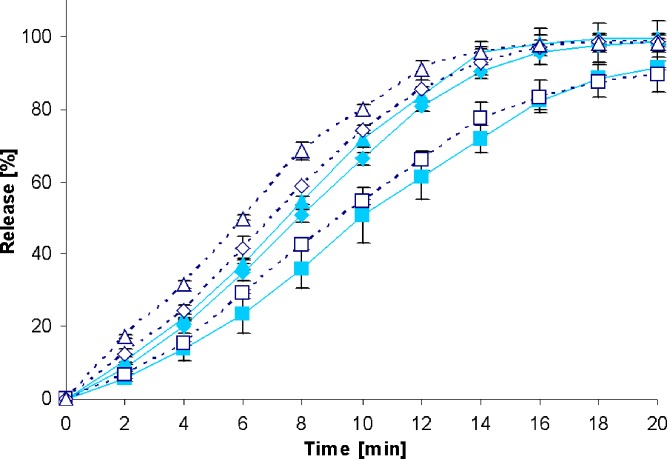
To check whether the drug release rate from the test formulations is influenced by different stirring speeds, dissolution profiles were first generated with the standard paddle apparatus at 50, 75, 100 (see closed symbols in Figs. 2, 3, 4, 5, 6, 7, 8, and 9), and 125 rpm for all formulations. The dissolution profiles obtained with the standard paddle apparatus clearly indicate that the paddle speed has some impact on drug release rate. Coning was observed during most of the release experiments at a paddle speed of 50 rpm, particularly resulting in a decrease in the dissolution rate of those types of IR dosage forms that are formulated with high amounts of insoluble excipients that form a disintegrated mass at the bottom of the vessel. Recently, it has been shown that the coning effect is more pronounced for such formulations that contain poorly soluble drugs (16). Based on these observations, it is reasonable that the coning effect observed at low stirring speeds had the highest impact on drug release from formulations containing poorly soluble drugs belonging to BCS class II and IV.
Fig. 2.
Drug release profiles of Diazepam STADA™ 10-mg tablets in the standard paddle apparatus (closed symbols) and the mini paddle apparatus at 100 (open triangle), 75 (open diamond), and 50 (open square) rpm
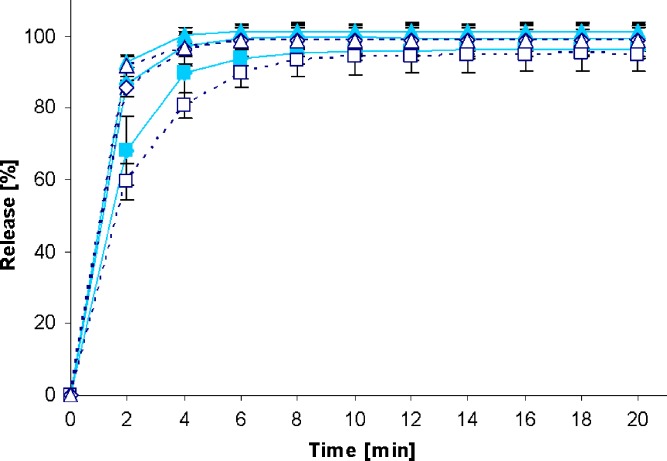
Fig. 3.
Drug release profiles of Metoprolol 50 Heumann tablets in the standard paddle apparatus (closed symbols) and the mini paddle apparatus at 100 (open triangle), 75 (open diamond), and 50 (open square) rpm
Fig. 4.
Drug release profiles of PREDNI H Tablinen™ 5-mg tablets in the standard paddle apparatus (closed symbols) and the mini paddle apparatus at 100 (open triangle), 75 (open diamond), and 50 (open square) rpm
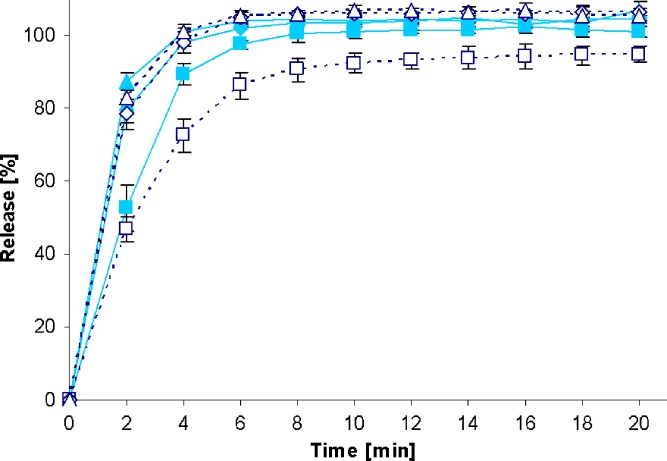
Fig. 5.
Drug release profiles of Ibuhexal™ akut 200 tablets in the standard paddle apparatus (closed symbols) and the mini paddle apparatus at 100 (open triangle), 75 (open diamond), and 50 (open square) rpm
Fig. 6.
Drug release profiles of Piroxicam 20 Heumann tablets in the standard paddle apparatus (closed symbols) and the mini paddle apparatus at 100 (open triangle), 75 (open diamond), and 50 (open square) rpm
Fig. 7.
Drug release profiles of Juvental 100-mg tablets in the standard paddle apparatus (closed symbols) and the mini paddle apparatus at 100 (open triangle), 75 (open diamond), and 50 (open square) rpm
Fig. 8.
Drug release profiles of HCT-beta 25 tablets in the standard paddle apparatus (closed symbols) and the mini paddle apparatus at 100 (open triangle), 75 (open diamond), and 50 (open square) rpm
Fig. 9.
Drug release profiles Furosemid Sandoz™ 40-mg tablets in the standard paddle apparatus (closed symbols) and the mini paddle apparatus at 100 (open triangle), 75 (open diamond), and 50 (open square) rpm
Increasing the paddle speed from 50 to 75 rpm or higher helped to overcome the coning. The higher paddle speeds resulted in a better dispersion of the disintegrated particles and, therefore, in more significant dissolution profiles, i.e., the shape of the dissolution profiles of the test formulations was determined by the drug delivery system itself rather than being influenced by accidental occurrences like coning, etc. Correspondingly, results obtained at 75 rpm compared with those generated at even higher paddle speeds of 100 and 125 rpm do result in less pronounced differences. With the objective of generating drug release profiles that are similar to these in the paddle apparatus, corresponding experiments were performed with the mini paddle apparatus, whereas particular attention was paid to simulating paddle experiments run at 75 rpm (see open symbols in Figs. 2, 3, 4, 5, 6, 7, 8, and 9).
As observed in the paddle apparatus, drug release rate in the mini paddle apparatus was influenced by the hydrodynamic conditions. The coning observed in the paddle experiments run at 50 rpm also occurred in the mini paddle setup at the same stirring speed. These results indicate that higher paddle speeds are necessary in both paddle and mini paddle to avoid coning and to achieve meaningful dissolution profiles. As feasible, f2 values were calculated for all formulation/paddle speed combinations (see Tables II, III, IV, and V). However, some formulations (i.e., Diazepam STADA™ 10 mg, PREDNI H Tablinen™ 5 mg, Piroxicam 20 Heumann, and HCT-beta 25) showed a very rapid release behavior (>85% within less than 15 min) that made it impossible to calculate the f2 value. Nevertheless, a visual inspection of the resulting profiles indicates that mini paddle profiles generated at both 75 and 100 rpm fit well to those obtained with a paddle speed of 75 rpm (see Figs. 2, 4, 6, and 8).
Table II.
Metoprolol 50 Heumann Tablets—f 2 Values from Comparison of Dissolution Profiles Generated with the Standard Paddle Apparatus and the Mini Paddle at Different Stirring Speeds
| Mini paddle | ||||
|---|---|---|---|---|
| 50 rpm | 75 rpm | 100 rpm | 125 rpm | |
| Paddle | ||||
| 50 rpm | 63.57 | 47.31 | 40.09 | 30.51 |
| 75 rpm | 42.44 | 77.63 | 57.44 | 38.99 |
| 100 rpm | 35.42 | 68.50 | 83.31 | 48.38 |
| 125 rpm | 31.07 | 56.35 | 68.23 | 63.14 |
Table III.
IbuHexal™ akut 200 Tablets—f 2 Values from Comparison of Dissolution Profiles Generated with the Standard Paddle Apparatus and the Mini Paddle at Different Stirring Speeds
| Mini paddle | ||||
|---|---|---|---|---|
| 50 rpm | 75 rpm | 100 rpm | 125 rpm | |
| Paddle | ||||
| 50 rpm | 45.92 | 57.01 | 51.39 | 41.36 |
| 75 rpm | 30.43 | 55.85 | 67.14 | 63.26 |
| 100 rpm | 29.87 | 54.12 | 64.22 | 66.88 |
| 125 rpm | 26.00 | 42.50 | 47.77 | 55.34 |
Table IV.
Juvental 100-mg Tablets—f 2 Values from Comparison of Dissolution Profiles Generated with the Standard Paddle Apparatus and the Mini Paddle at Different Stirring Speeds
| Mini paddle | ||||
|---|---|---|---|---|
| 50 rpm | 75 rpm | 100 rpm | 125 rpm | |
| Paddle | ||||
| 50 rpm | 82.25 | 40.81 | 39.75 | 21.37 |
| 75 rpm | 34.95 | 74.00 | 50.83 | 34.65 |
| 100 rpm | 26.19 | 43.33 | 90.38 | 45.69 |
| 125 rpm | 18.79 | 29.58 | 42.34 | 70.73 |
Table V.
Furosemid Sandoz™ 40-mg Tablets—f 2 Values from Comparison of Dissolution Profiles Generated with the Standard Paddle Apparatus and the Mini Paddle at Different Stirring Speeds
| Mini paddle | ||||
|---|---|---|---|---|
| 50 rpm | 75 rpm | 100 rpm | 125 rpm | |
| Paddle | ||||
| 50 rpm | 68.89 | 36.06 | 29.60 | 27.23 |
| 75 rpm | 50.68 | 59.62 | 43.87 | 39.58 |
| 100 rpm | 43.74 | 74.55 | 49.97 | 44.49 |
| 125 rpm | 38.83 | 76.68 | 63.49 | 54.82 |
Results from the f2 calculation of dissolution profiles using 75 rpm in paddle method and 75/100 rpm in mini paddle method are in good agreement with this observation. Similar drug release profiles (f2 ≥ 50) were obtained at both stirring rates, whereby in most cases, higher f2 values were obtained at 75 rpm. This is a clear indicator for similar hydrodynamic conditions in the two different setups and thus, it is obvious that a scale down of standard paddle experiments is possible.
SUMMARY
Results from the present series of tests indicate that the mini paddle apparatus is a useful tool in characterizing drug release profiles under “standard test conditions”. Due to the possibility of using smaller sample sizes and smaller volumes of media, it offers various advantages in terms of substance, analytical, and material cost savings when evaluating release properties of drug candidates. The mini paddle setup is also a promising alternative if the analytics are not very sensitive or in the case of highly potent drugs. Because the size and shape of dosage forms can also impact drug release, the mini paddle should preferably be used for powders, multiparticulate dosage forms, and small tablets or capsules (i.e., where the paddle apparatus would be the usual method of choice).
Nowadays, there are various types of mini paddle systems available on the market. However, most of these systems reflect everything but a miniaturized reproduction of the USP paddle system. For this reason, the outcome of the present study should not be generalized since changing the dimensions of the setup can quickly result in alterations of the hydrodynamics which, as has been shown in the present study, can have a huge impact on drug release from the dosage form tested. The next steps would be therefore to check, if it is possible to further downsize the setup with maintaining the significance of the compendial setup, to determine the impact of experimental settings on drug release from MR formulations and to measure/simulate flow velocities in the mini vessel.
Acknowledgement
The authors would like to thank ERWEKA GmbH, Heusenstamm, Germany for the provision of the mini paddle test equipment.
References
- 1.Dissolution testing of immediate release solid oral dosage forms; Guidance for Industry; U.S. Department of Health and Human Services, Food and Drug Administration, Center for Drug Evaluation and Research (CDER), U.S. Government Printing Office: Washington, DC, 1997.
- 2.Waiver of in vivo bioavailability and bioequivalence studies for immediate-release solid oral dosage forms based on a biopharmaceutics classification system; Guidance for Industry; U.S. Department of Health and Human Services, Food and Drug Administration, Center for Drug Evaluation and Research (CDER), U.S. Government Printing Office: Washington, DC, 2000.
- 3.Scholz A., Kostewicz E., Abrahamsson B., Dressman J.B. Can the USP paddle method be used to represent in-vivo hydrodynamics. J. Pharm. Pharmacol. 2003;55(4):443–451. doi: 10.1211/002235702946. [DOI] [PubMed] [Google Scholar]
- 4.Wu Y., Kildsig D.O., Ghaly E.S. Effect of hydrodynamic environment on tablets dissolution rate. Pharm. Dev. Technol. 2004;9(1):25–37. doi: 10.1081/PDT-120027415. [DOI] [PubMed] [Google Scholar]
- 5.Diebold S. Physiological parameters relevant to dissolution testing: hydrodynamic considerations. In: Dressman J.B., Kraemer J., editors. Pharmaceutical dissolution testing. Boca Raton, FL: Taylor & Francis; 2005. pp. 127–191. [Google Scholar]
- 6.Lindenberg M., Kopp S., Dressman J.B. Classification of orally administered drugs on the World Health Organization Model list of Essential Medicines according to the biopharmaceutics classification system. Eur. J. Pharm. Biopharm. 2004;58(2):265–278. doi: 10.1016/j.ejpb.2004.03.001. [DOI] [PubMed] [Google Scholar]
- 7.Kasim N.A., Whitehouse M., Ramachandran C., Bermejo M., Lennernas H., Hussain A.S., Junginger H.E., Stavchansky S.A., Midha K.K., Shah V.P., Amidon G. Molecular properties of WHO Essential Drugs and Provisional Biopharmaceutical Classification. Mol. Pharm. 2004;1(1):85–96. doi: 10.1021/mp034006h. [DOI] [PubMed] [Google Scholar]
- 8.Wu C.Y., Benet L.Z. Predicting drug disposition via application of BCS: transport/absorption/elimination interplay and development of a biopharmaceutics drug disposition classification system. Pharm. Res. 2005;22(1):11–23. doi: 10.1007/s11095-004-9004-4. [DOI] [PubMed] [Google Scholar]
- 9.Klein S. The mini paddle apparatus—a useful tool in the early developmental stage? Experiences with immediate release dosage forms. Dissolution Technologies. 2006;13(4):6–11. [Google Scholar]
- 10.Moore J.W., Flanner H.H. Mathematical comparison of dissolution profiles. Pharm. Technol. 1996;20:64–74. [Google Scholar]
- 11.Shah V.P., Tsong Y., Sathe P., Williams R.L. Dissolution profile comparison using similarity factor, f2. Dissolution Technol. 1999;6(3):15. doi: 10.1023/a:1011976615750. [DOI] [PubMed] [Google Scholar]
- 12.Shah V.P., Tsong Y., Sathe P., Liu J.P. In vitro dissolution profile comparison—statistics and analysis of the similarity factor, f2. Pharm. Res. 1998;15(6):889–896. doi: 10.1023/A:1011976615750. [DOI] [PubMed] [Google Scholar]
- 13.Extended release oral dosage forms: development, evaluation, and application of in vitro/in vivo correlations; Guidance for Industry; U.S. Department of Health and Human Services, Food and Drug Administration, Center for Drug Evaluation and Research (CDER), U.S. Government Printing Office: Washington, DC, 1997.
- 14.SUPAC-MR: modified release solid oral dosage forms. Scale-up and postapproval changes: chemistry, manufacturing, and controls; in vitro dissolution testing and in vivo bioequivalence documentation; Guidance for Industry; U.S. Department of Health and Human Services, Food and Drug Administration, Center for Drug Evaluation and Research (CDER), U.S. Government Printing Office: Washington, DC, 1997.
- 15.Oral extended (controlled) release dosage forms in vivo bioequivalence and in vitro dissolution testing; Guidance for Industry; U.S. Department of Health and Human Services, Food and Drug Administration, Office of Generic Drugs, U.S. Government Printing Office: Washington, DC, 1993.
- 16.Mirza T., Yatindra J., Qian J.L., Vivilecchia R. Evaluation of dissolution hydrodynamics in the USP, Peak™ and Flat-Bottom Vessels using different solubility drugs. Dissolution Technol. 2005;12(1):11–16. [Google Scholar]


