Abstract
Formation of inhalable microparticles containing rifampicin and poly(l-lactide) (L-PLA) by using supercritical anti-solvent process (SAS) was investigated. The solutions of drug and polymer in methylene chloride were sprayed into supercritical carbon dioxide. The effect of polymer content and operating conditions, temperature, pressure, carbon dioxide molar fraction, and concentration of solution, on product characteristics were studied. The prepared microparticles were characterized with respect to their morphology, particle size and size distribution, drug content, drug loading efficiency, and drug release characteristic. Discrete, spherical microparticles were obtained at high polymer:drug ratios of 7:3, 8:2, and 9:1. The shape of L-PLA microparticles became more irregular and agglomerated with decreasing polymer content. Microparticles with polymer content higher than 60% exhibited volumetric mean diameter less than 5 μm, but percent drug loading efficiency was relatively low. Drug-loaded microparticles containing 70% and 80% L-PLA showed a sustainable drug release property without initial burst release. Operating temperature level influenced on mean size and size distribution of microparticles. The operating pressure and carbon dioxide molar fraction in the range investigated were unlikely to have an effect on microparticle formation. An increasing concentration of feed solution provided larger size microparticles. Rifampicin-loaded L-PLA microparticles could be produced by SAS in a size range suitable for dry powder inhaler formulation.
Key words: biodegradable, inhalation, microparticles, poly(l-lactide), rifampicin, supercritical anti-solvent
INTRODUCTION
Tuberculosis (TB) is an infectious lung disease which is one of the leading causes of death worldwide. This disease has become a clinically significant opportunistic disease among the population with high incidence of acquired immunodeficiency syndrome. Rifampicin is one of the first-line drugs in the therapy of TB (1). Current medical treatment of TB is accomplished by various methods of drug delivery, being mostly oral and parenteral. Since the site of infection is primarily in the lung, the administration of drug through inhalation route offers distinct advantages. Several investigators have proposed the administration of anti-tuberculosis drugs in the form of vesicular systems (2) as well as microparticulate systems (3,4). The effectiveness of pulmonary delivery of rifampicin in animal studies has been reported (2–5).
The microparticulate drug delivery systems targeting to the alveolar macrophages contribute to improved chemotherapy of TB (3,4). Recently, the administration of biodegradable microspheres through the bronchio-pulmonary route for better therapy of TB was reported (6,7). Biodegradable microparticles as a drug delivery system via inhalation is capable of sustaining the drug release while targeting the deep lung and specifically the alveolar macrophages (8). An efficient targeted drug delivery system, with the capability for extended release, should also increase patient compliance with long-term therapies by allowing less frequent dosing and reduce side effects associated with long-term systemic antibiotic therapy (9). In pulmonary drug delivery, drug-loaded microparticles can be administered via a dry powder inhaler, metered dose inhaler, or nebulizer. The small microparticles having a typical mass median aerodynamic diameter of 1–5 μm are required in order to efficiently penetrate to pulmonary alveoli (10).
A number of conventional preparation techniques have been employed to produce the microparticles for inhalation, e.g., spray drying, milling, and emulsion solvent evaporation method. In recent years, a process using supercritical fluids (SCF), particularly supercritical carbon dioxide (SCO2), has received increased attention as an alternative approach to produce microparticles for pharmaceutical use. Particle formation by means of SCF could be in single-component particles or composite particles.
A number of SCF methods for particle formations have been devised and can be found in several review papers. A comprehensive review article focused on the production of composite particles by SCF has been reported by Bahrami and Ranjbarian (2007) and classified based on the roles of SCF, which are solvent, anti-solvent, and solute (11). The following are mainly established SCF techniques. The rapid expansion of supercritical solution (RESS) is a solvent-based process. Gas anti-solvent (GAS), precipitation with a compressed anti-solvent (PCA), aerosol solvent extraction system (ASES), supercritical fluid anti-solvent (SAS), and solution-enhanced dispersion by supercritical fluids (SEDS) methods are the processes with SCF acting as an anti-solvent and the particles from gas saturated solution (PGSS) is a solute-based process.
RESS is the first SCF method which has been applied to produce particles (12). Microparticles are formed as a result of a rapid expansion of SCF solvent (13). This method is suitable for substances with sufficiently high solubility in the SCF. It is known as a novel method to prepare solvent-free, drug-containing polymeric particles for controlled release delivery (14,15).
In GAS method, the SCO2 (or compressed gas) is introduced into an organic solution, previously loaded in precipitation vessel, resulting in microspheres or microencapsules. The method is of interest in the formulation of fine peptide/protein powders as well as polymeric particles (16).
An alternative method capable of producing microparticles in a single step at a moderate temperature is PCA/ASES/SAS. The drug is dissolved in an organic solvent and the solution is then sprayed into supercritical fluid. The organic solvent is miscible with the SCF gas thus causing the drug particles to precipitate. Microparticles prepared by this method contain a negligible amount or none of residual solvent (17). The microparticles can be produced to meet certain morphological requirements such as size, shape, and porosity by varying necessary process parameters of the system.
The PGSS method requires neither drug particle nor polymer to dissolve in SCO2. In PGSS technique, SCO2 dissolves in a molten or plasticized substance at high pressure, leading to a gas saturated solution. The rapid expansion of solution through a nozzle results in particles. The consumption of CO2 in PGSS method is lower than RESS method (11).
In addition to the processes described above, new techniques are developed where SCF is used to assist the nebulization of solution of the compound to be processed such as the carbon dioxide-assisted nebulization with a bubble dryer and supercritical assisted atomization. The mechanism of the process is similar to classic micronization by spray drying: the SCF and the drug solution are intimately mixed and sprayed in a drying chamber at atmospheric pressure. The method allows the production of microparticles with the minimal decomposition of thermally labile bioactive compounds (18).
Various supercritical fluid techniques have been used as methods for preparation of microparticles of pure biodegradable polymers, e.g., poly-(dl-lactide), poly(l-lactide), poly-(dl-lactide-co-glycolyde) (PGLA), poly(β-hydroxybutyric acid), dextran, inulin (19–22), and pure drugs, e.g., rifampicin, cepharosporin, and tetracycline (23–25). Bahrami and Ranjbarian (2007) and Tandya et al. (2007) have reviewed the application of SCF techniques to fabricate polymeric drug-loaded formulations (11,26). There were numerous reports of the production of composite particles of drug-loaded biodegradable polymers such as lovastatin-loaded DL-PLA (19), gentamicin-loaded L-PLA (27) and hydrocortisone-loaded DL-PLGA microparticles (28), and tetracosactide–L-PLA microparticles (29). The SCF technique has been used to produce drug-loaded microparticles suitable for pulmonary delivery such as budesonide-, flunisolide-, fluticasone propionate-, prednisolone-, and triamcinolone acetonide-containing microparticles (30) as well as terbutaline-loaded microparticles (31) and ipratropium bromide (32).
However, two methods, emulsion solvent evaporation and spray drying technique, have been applied for preparing rifampicin-loaded biodegradable microparticles for pulmonary delivery but no work using a SCF technique is reported. So, it is of interest to investigate the application of supercritical anti-solvent process (SAS) to prepare rifampicin-containing biodegradable microparticles having a diameter in the inhalable range of 1–5 μm. In this study, the microparticles containing rifampicin and L-PLA were prepared by supercritical anti-solvent process. Polymer:drug ratio and process variables (operating pressure, temperature, carbon dioxide molar fraction, and solution concentration) affecting particle formation were investigated. The drug-containing microparticles were characterized with respect to their morphology, particle size and size distribution, drug content, loading efficiency, and in vitro drug release properties.
MATERIALS AND METHODS
Materials
Rifampicin was supplied by Siam Bheasach Co. Ltd., Thailand). Poly(l-lactide) (MW 85,000–160,000 Da) was purchased from Sigma, Germany. HPLC grade methylene chloride was purchased from Fisher Scientific, UK and carbon dioxide was obtained from Thai Industrial Gases, Thailand. All materials were used as received.
Preparation of Microparticles
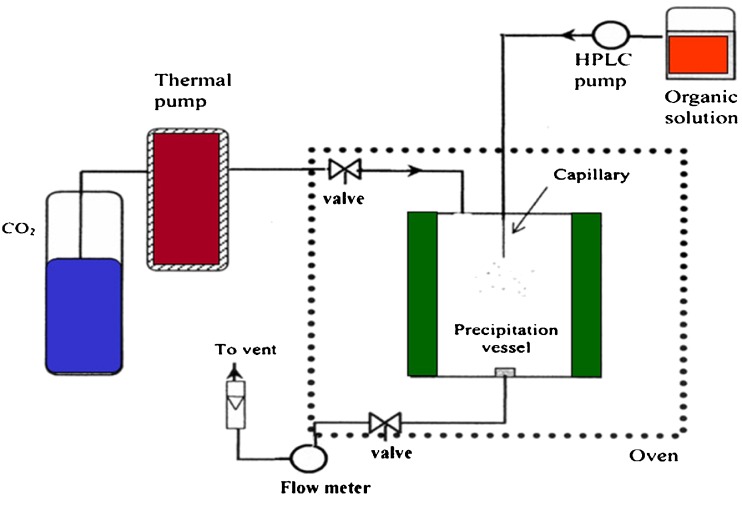
Microparticles of either pure drug or drug-biodegradable polymers were prepared by using a modified supercritical fluid extractor (SFE 400, Supelco Inc., USA) shown schematically in Fig. 1. The stainless steel precipitation vessel (250 ml) was filled with carbon dioxide and allowed to equilibrate at predetermined operating pressure and temperature. The solution of drug and polymer dissolved in methylene chloride was sprayed by a high pressure pump (MILTONROY® CM 4000 multiple solvent delivery system, USA) through a 50-μm diameter capillary at a predetermined feed rate. The flow rate of CO2 was kept constant at 1.5 g/min. The organic solvent was extracted into the supercritical fluid resulting in the formation of solid microparticles in the vessel. When spraying of organic solution was completed, the precipitation vessel was depressurized and resultant products were collected.
Fig. 1.
Schematic diagram of supercritical anti-solvent apparatus
Effect of Polymer Content
To investigate the effect of polymer content on microparticle formation, microparticles of various polymer:drug ratios in the range from 2:8 to 9:1 were prepared by using the above procedure with operating parameters as shown in Table I. Microparticles of plain drug and plain polymer were also prepared in the same manner.
Table I.
Operating Conditions Kept Constant While Varying the Others for Microparticle Preparation
| Operating condition | Level |
|---|---|
| Supercritical carbon dioxide pressure, bar | 138 |
| Temperature, °C | 40 |
| Solid content of feed solution, mg/ml | 20 |
Carbon dioxide molar fraction (
|
0.82 |
Effect of Operating Conditions
Formulation composed of 70% L-PLA and 30% rifampicin was selected for investigation of the effect of operating parameters on microparticle formation. The process parameter studied was varied in the range as presented in Table II to determine their effects on precipitation characteristic. During processing, only one processing parameter was varied according to the range specified while other operating conditions were kept unchanged according to Table I. For example, when pressure was set to 138, 172, or 207 bar, temperature, solid content solution, and carbon dioxide molar fraction ( ) were maintained at 40°C, 20 mg/ml, and 0.82, respectively.
Table II.
Various Process Parameters Used for Microparticle Preparation
| Operating condition | Level |
|---|---|
| Supercritical carbon dioxide pressure, bar | 138, 172, 207 |
| Temperature, °C | 33, 40, 50 |
| Solid content of feed solution, mg/ml | 10, 20, 30 |
Carbon dioxide molar fraction ( ) ) |
0.79, 0.82, 0.85 |
Characterization of Microparticles
Powder Morphology
Shape and surface morphology of microparticles were observed by using scanning electron microscope (SEM, JSM-5410LV, Jeol, Japan) and photographed at appropriate magnification.
Yield of Microparticles
The prepared microparticles were collected from precipitation vessel and weighted. The percent yield was calculated according to:
 |
1 |
Particle Size Measurement
The volume particle size distribution of microparticles was determined by laser diffraction method (Mastersizer 2000 Version 5.1, Malvern Instruments, UK). The microparticles were suspended in an aqueous medium with a small amount of Tween 80. The particle size distribution was measured after 90 s of sonication. The particle size of the microparticles was described by the volume mean diameter. The polydispersity of the microparticles was expressed by the span value.
 |
2 |
Where D10%, D50%, and D90% were the equivalent volume diameters at 10%, 50%, and 90% cumulative volume, respectively.
Determination of Drug Content and Loading Efficiency
An accurately weighed sample of microparticles was dissolved in 1 ml of chloroform followed by the addition of 9 ml of methanol to precipitate the polymer. The sample was then centrifuged for 30 min at 4,000 rpm and 1 ml aliquot taken from supernatant and analyzed using validated reversed phase HPLC method (Model SCL-10APV, Shimadzu, Japan) modified from Panchagnula et al. (1999) (33).
Drug incorporation efficiency was expressed both as actual drug content (% w/w) and loading efficiency (%), represented by Eqs. (3) and (4), respectively. Mean values of three determinations were reported.
 |
3 |
 |
4 |
In vitro Drug Release
Drug release of microparticles was investigated by using USP dissolution apparatus II which was operated at 37 ± 0.5°C with stirring rate of 50 rpm. The dissolution medium was 200 ml of 0.05 M phosphate buffer in saline (PBS) with 200 μg/ml ascorbic acid added as an antioxidant to prevent oxidative degradation. The powder containing 10 mg of drug was placed in dissolution medium (n = 3). Three milliliters of each sample was withdrawn after the dissolution apparatus was operated at 0.25, 0.5, 0.75, 1, 2, 3, 4, 6, 8, 10, 12, 16, 20, and 24 h. Those sampling solutions were centrifuged at 4,000 rpm for 15 min. The equivalent amount of dissolution medium was added immediately after sampling to maintain a constant volume of dissolution medium. Samples were assayed using validated spectrophotometric method at 475 nm.
RESULTS AND DISCUSSION
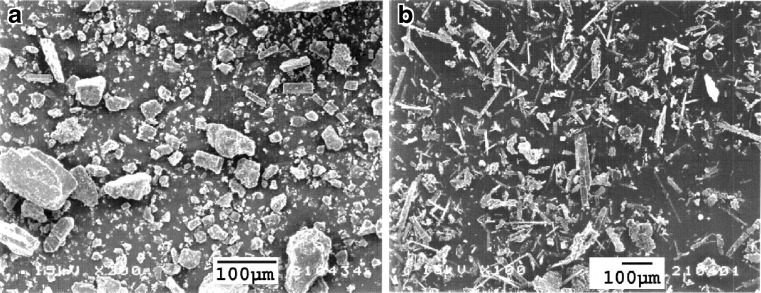
SEM photograph of pure rifampicin is shown in Fig. 2a. The unprocessed drug consisted of polygonal particles up to 100 μm in size with rather broad size range. Figure 2b shows the SEM photograph of rifampicin after supercritical anti-solvent process according the operating conditions shown in Table I, composed of smaller needle-shaped crystals.
Fig. 2.
SEM photomicrographs of a unprocessed and b processed rifampicin using operating conditions: pressure = 172 bar, temperature = 40°C, concentration of solution = 20 mg/ml, and carbon dioxide molar fraction = 0.82
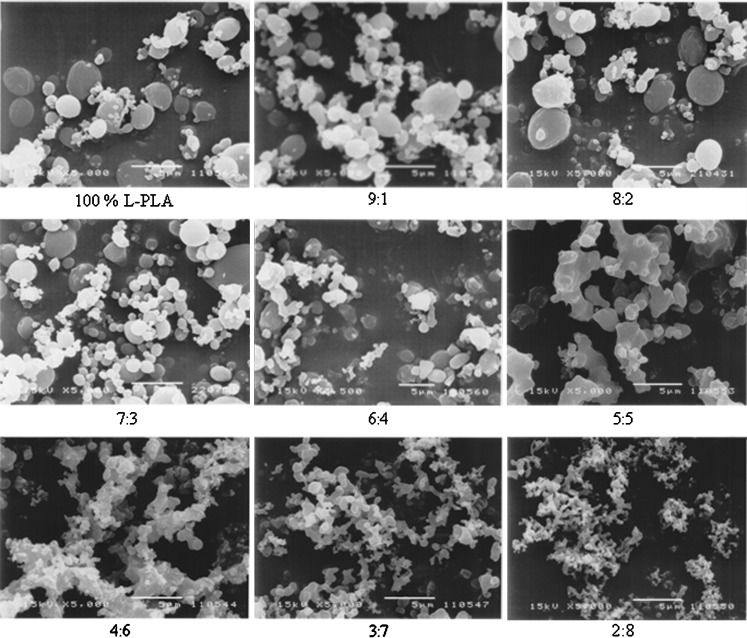
The characteristics of drug-loaded L-PLA microparticles containing various polymer:drug ratios obtained by spraying a 2% solution of rifampicin and L-PLA in methylene chloride into supercritical fluid carbon dioxide at 172 bar, 40°C, and carbon dioxide molar fraction ( ) of 0.82 are summarized in Table III. Rifampicin–L-PLA microparticles with polymer content ranging from 70% to 90% were almost spherical and the surface of these microparticles was very smooth (Fig. 3). But the microparticles of 60% polymer content were a mixture of less spherical and some irregular particles. The microparticles were more irregular in shape when drug loading was more than 50%. At 5:5 polymer:drug ratio, the spherical microparticle was not formed. Coalescing microparticles in fine microstructure were found when using 40–20% polymer content in formulations. At low polymer content, it is possible that feed solution was atomized into droplets, but the amount of polymers was not enough for hardening the droplet into spherical microparticles and provided the irregular microparticles. The morphology of microparticles significantly depended on both nature of drug and percent drug loading. In this experiment, it began to form the agglomerated and irregular microparticles at polymer:drug ratio of 5:5 or below, but Tu et al. (2002) could produce uniform and discrete microparticles of a parahydroxy benzoic acid loaded L-PLA using aerosol solvent extracting system (ASES) at polymer:drug ratio of 5:5 (34)
Table III.
Physical Properties of Rifampicin-Loaded L-PLA Microparticles Prepared Using Various Polymer:Drug Ratiosa
| Polymer:drug ratio | Morphology | Yield, % | Drug content, % average (SD) | Loading efficiency, % average (SD) |
|---|---|---|---|---|
| 100% L-PLA | Discrete microparticles | 53.99 | – | – |
| 9:1 | Discrete microparticles | 39.86 | 3.34 (1.42) | 33.40 (14.18) |
| 8:2 | Discrete microparticles | 39.68 | 8.13 (0.29) | 40.64 (1.43) |
| 7:3 | Discrete microparticles | 39.75 | 16.33 (0.21) | 54.46 (0.70) |
| 6:4 | Discrete microparticles | 39.31 | 23.30 (0.79) | 58.25 (1.97) |
| 5:5 | Irregular microparticles | 35.50 | 41.52 (2.31) | 83.03 (4.62) |
| 4:6 | Agglomerated microparticles | 42.48 | 53.80 (1.16) | 89.67 (1.93) |
| 3:7 | Agglomerated microparticles | 39.82 | 64.21 (0.98) | 91.73 (1.40) |
| 2:8 | Agglomerated microparticles | 46.13 | 66.42 (5.70) | 83.02 (7.13) |
aOperating conditions: pressure = 172 bar, temperature = 40°C, concentration of solution = 20 mg/ml, and carbon dioxide molar fraction = 0.82
Fig. 3.
SEM photomicrographs of rifampicin-loaded L-PLA microparticles prepared using different polymer:drug ratios. Operating condition: pressure = 172 bar, temperature = 40°C, concentration of solution = 20 mg/ml, and carbon dioxide molar fraction = 0.82 (=5 μm)
Percent yield, drug content, and loading efficiency of the L-PLA microparticles prepared at different polymer:drug ratios are presented in Table III. The percent yields for rifampicin-loaded L-PLA microparticles were between 35% and 46%; processing of pure polymer provided higher percent yield (54%). It was found that the polymer:drug ratio significantly affected the percent drug content of microparticles. The loading efficiency increased with the decrease in polymer:drug ratio. At low theoretical drug loadings (10–20%), the encapsulation efficiencies were relatively low. This might be attributed to, during particle formation, the polymer precipitated while rifampicin remained in solution and did not co-precipitate with the polymer until its solubility limit was reached. As the polymer:drug ratio decreased, SCO2 was gradually saturated with the drug thus increasing the loading efficiency to more than 80%. The data were in agreement with the findings in previous study (35). It was found that indomethacin was extracted from L-PLA microparticles by SCO2 due to the highly lipophilic nature of the drug. At a theoretical drug loading of 10%, only 0.73% and 3.73% of indomethacin and chlorpheniramine maleate, respectively, could be encapsulated. However, the loading efficiency obtained in this experiment was somewhat higher than those previously reported (34,35).
Figure 4 illustrates the particle size distribution by volume of rifampicin/L-PLA microparticles at polymer content in the range of 20–90%. At polymer content 20% and 30%, rifampicin–L-PLA microparticles were divided into two size ranges: the cluster of microparticles was obtained from primary microparticles tightly fused together having particle size between 0.5 and 1 μm and large agglomerates of microparticles had particle size between 1 and 1,000 μm. However, polymer content of 40% and 50% provided only large agglomerates. The amount of small cluster of microparticles increased when percent polymer content decreased. In formulations of 40% and 50% polymer content, the cluster of microparticles was not observed. The particle size distribution curves of microparticles produced from 60–100% polymer content were almost superimposed. The effect of polymer content on average particle size (D50%) with span and percentage of particles having size <5 μm are listed in Table IV. The volume mean diameter of microparticles prepared using polymer content of 20% and 30% was larger than 18 μm. The particle size of microparticles was decreased when percent polymer content was increased. The unloaded L-PLA microparticles were spherical of average size less than 3.26 μm in diameter. The particles sizes of 70% to 90% L-PLA microparticles were comparable to unloaded particles and their percent particle size less than 5 μm was over 60%. It was shown that there was no statistically significant difference of D50% (p < 0.05) of the microparticles generating from formulation 60% to 90% polymer content. The microparticles production results achieved in this and other studies indicating that the microparticle production might be dependent on the type of polymer and amount of drug in the system. However, the drug loading might depend more on the type of system such as the crystallization/precipitation behavior of both the drug and the polymer.
Fig. 4.
Particle size distribution by volume of microparticles prepared using different polymer:drug ratios. Operating condition: pressure = 172 bar, temperature 40°C, concentration of solution = 20 mg/ml, and carbon dioxide molar fraction = 0.82
Table IV.
Average Particle Size, Span, and Percent Fraction of Size Less than 5 μm for Rifampicin-Loaded L-PLA Microparticles Containing Different Polymer Contentsa
| Polymer:drug ratio | D 50% (µm) | Span | Fraction <5 μm (%) |
|---|---|---|---|
| Average (SD) | Average (SD) | Average (SD) | |
| 10:0 | 3.26 (0.18) | 1.93 (0.39) | 71.56 (4.13) |
| 9:1 | 3.65 (0.26) | 2.09 (0.03) | 63.08 (5.26) |
| 8:2 | 3.37 (0.28) | 2.26 (0.20) | 66.24 (6.05) |
| 7:3 | 3.40 (0.04) | 3.29 (0.25) | 65.20 (2.69) |
| 6:4 | 4.07 (0.21) | 5.98 (0.44) | 55.82 (1.30) |
| 5:5 | 8.05 (0.04) | 3.93 (0.07) | 31.62 (2.24) |
| 4:6 | 6.60 (1.08) | 6.04 (1.05) | 41.73 (1.07) |
| 3:7 | 30.53 (0.33) | 3.17 (0.11) | 18.12 (0.96) |
| 2:8 | 18.78 (1.02) | 5.50 (0.09) | 35.24 (0.65) |
aOperating conditions: pressure = 172 bar, temperature = 40°C, concentration of solution = 20 mg/ml, and carbon dioxide molar fraction = 0.82
Kim et al. (2006) investigated precipitation of L-PLA by SAS process and indicated that the ratio (R) of anti-solvent flow rate CO2 (l/min)/the L-PLA/methylene chloride solution flow rate (ml/min) was an important factor for fine L-PLA particles (22). It was found that the L-PLA particle size was decreased when increasing R ratio. Increasing CO2 reduced the droplet diameter by enhancing the aerodynamic force. The diameter of the droplet was also reduced owing to enhanced atomization by increased surface tension. In addition, CO2 was diffused into the droplet rapidly and the solvent in the droplet was simultaneously evaporated for CO2 circumstance by sufficient CO2. This caused accelerated supersaturation and nucleation. In our work, the solution feed rate at 0.5 ml/min was used, which was equivalent to R ratio of 1.52. So, the ratio of anti-solvent/solvent flow rate (R) was somewhat lower than the previous report. For this reason, the products from each preparation were rather large particles and particle fraction of <5 μm was less than 70%.
The formulation containing polymer:drug ratio of 7:3 was selected for investigating the effect of operating conditions because it gave spherical and discrete microparticles. In addition, the mean size of microparticles was 3.4 μm which could be used as powder inhalation and suitable for targeting drug to deep pulmonary system.
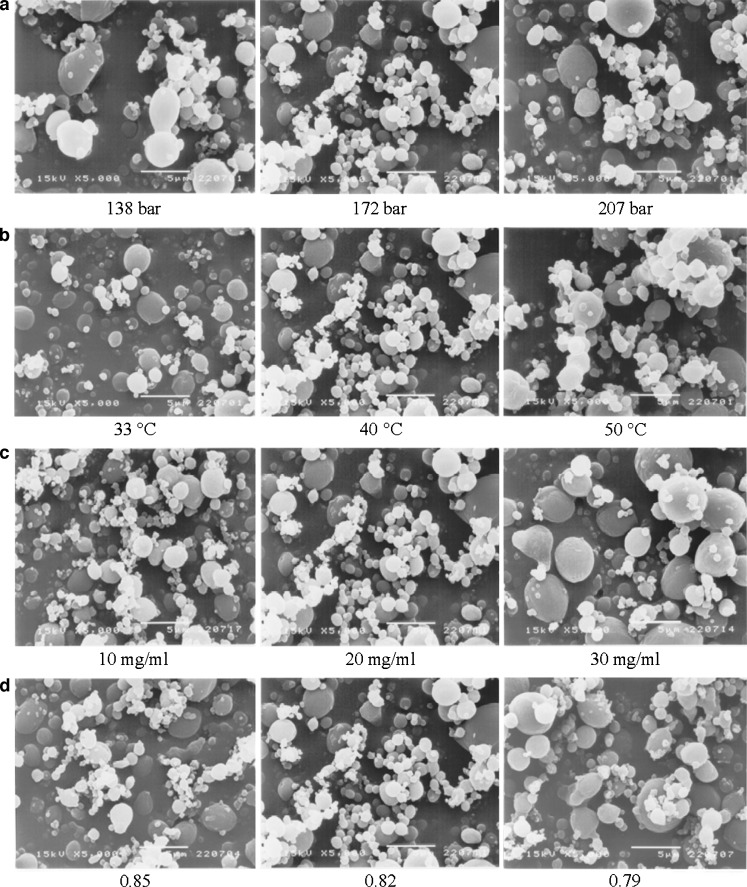
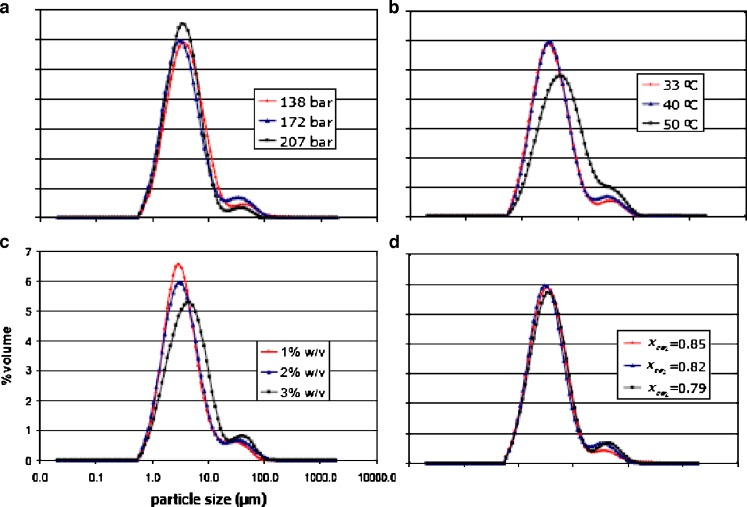
The effect of operating pressure on the precipitation of the drug and polymer mixture by the SAS process was studied at 138, 172, and 207 bar while maintaining all other variables constant as previously described in Tables II and I, respectively. The morphology of microparticles obtained from various operating pressures is illustrated in Fig. 5a. The characteristics of rifampicin–polymer microparticles were found to be insensitive to pressure changes in the system. The microparticles processed at all operating pressures were spherical. Figure 6a shows the particle size distribution curves by volume of rifampicin-loaded L-PLA microparticles prepared at various operating pressures. Summary of volumetric mean diameter with span and percent fraction <5 μm is presented in Table V. The volume particle size distribution curve of microparticles at operating pressure of 138 bar was slightly shifted toward higher values of particle size and broader than those of 172 bar. As the operating pressure was increased to 207 bar, a narrower size distribution of drug-loaded microparticles was observed. However, the volumetric mean size of all operating pressure was not statistically significantly different (p < 0.05). It was observed that the percent fraction <5 μm size using operating pressure at 138 bar was apparently lower than those prepared at 172 and 207 bar. Dixon et al. (1993) found a decrease in particle size of product prepared from the mixture of polystyrene in toluene solution and carbon dioxide if the density of the extracting gas was raised by increasing operating pressure, which was also in agreement with the report by Kim et al. (2006) (21,36).
Fig. 5.
SEM photomicrographs of microparticles containing 70% L-PLA prepared using different operating pressures a, temperatures b, solution concentrations c, and carbon dioxide molar fractions d
Fig. 6.
Particle size distribution of microparticles containing 70% L-PLA prepared using different operating pressures a, temperatures b, solution concentrations c, and carbon dioxide molar fractions d
Table V.
Average Particle Size, Span, and Percent Fraction Less than 5 μm of Microparticles Prepared Using Different Operating Conditions by Keeping Respectively the Other Constant as Reported in Table I
| Operating condition | D 50% (µm) | Span | Fraction <5 μm (%) | |
|---|---|---|---|---|
| Average (SD) | Average (SD) | Average (SD) | ||
| Pressure (bar) | 138 | 3.91 (0.39) | 2.61 (0.46) | 59.00 (3.79) |
| 172 | 3.40 (0.04) | 3.29 (0.25) | 65.20 (2.69) | |
| 207 | 3.48 (0.04) | 2.09 (0.10) | 65.83 (3.22) | |
| Temperature (°C) | 33 | 3.27 (0.02) | 2.84 (0.07) | 66.75 (2.99) |
| 40 | 3.40 (0.04) | 3.29 (0.25) | 65.20 (2.69) | |
| 50 | 5.25 (0.17) | 4.19 (0.38) | 47.96 (1.36) | |
| Concentration (% w/v) | 1 | 3.28 (0.04) | 2.88 (0.18) | 68.00 (2.87) |
| 2 | 3.40 (0.04) | 3.29 (0.25) | 65.20 (2.69) | |
| 3 | 4.50 (0.23) | 3.31 (0.48) | 51.57 (2.39) | |
| Carbon dioxide molar fraction | 0.79 | 3.75 (0.04) | 3.07 (0.13) | 60.46 (2.14) |
| 0.82 | 3.40 (0.04) | 3.29 (0.25) | 65.20 (2.69) | |
| 0.85 | 3.49 (0.14) | 2.64 (0.17) | 64.11 (2.44) |
The effect of temperature was studied by varying operating temperature at 33, 40, and 50°C while maintaining all other variables constant: operation pressure of 172 bar, 2% w/v solution with carbon dioxide mole fraction at 0.82. The comparative morphology of microparticles obtained from various operating temperatures is illustrated in Fig. 5b. The characteristics of the rifampicin-loaded L-PLA microparticles were probably affected by temperature changes in the system. Apparently, the microparticles processed at temperatures of 33 and 40°C were more spherical and smaller in size than the microparticles at 50°C. The formation of less spherical microparticles processing at 50°C and a slight increase in microparticle agglomeration at higher temperatures might be due to more polymer plasticization effect of CO2. Bleich et al. (1994) reported that the particles produced at higher temperatures lead to compact agglomerates by bridging (larger particle size) (37). It had been shown in the literature that the temperature might greatly influence the precipitation of polymers. In particular, the morphology of the solid formed might differ depending on whether the operating temperature was higher or lower than the glassy transition point. The Tg of a polymer is lowered due to CO2 sorption into the polymer/solvent matrix and the weakening of the inter- and intramolecular attractions between the polymer segments within the matrix. As a result, the Tg of the polymer is depressed in proportion to the amount of CO2 absorbed (34).
Particle size distribution curves of rifampicin-loaded L-PLA microparticles of 30 and 40°C operating condition were superimposed each other, whereas those of 50°C shifted toward higher values of particle size, lower in height, and broader (Fig. 6b). As presented in Table V, it was found that temperature did not significantly affect the D50% of powders prepared at 33 and 40°C. But D50% of microparticles produced at 33 and 40°C were significantly different from D50% of 50°C operating condition (p < 0.05). The percent of size <5 μm produced at 33 and 40°C was higher than 60% whereas at 50°C operation condition was only approximately 47% because more agglomerated microparticles formed at this temperature level.
The effect of feed solution concentration was investigated by varying the concentration in the range of 1% to 3% w/v and setting all other variables constant at 172 bar, 40°C with carbon dioxide molar fraction at 0.82. The morphology of microparticles obtained from various solution concentrations is shown in Fig. 5c. The characteristics of the rifampicin–polymer microparticles were found sensitive to solution concentration changes in the system. The microparticles produced from solution concentration of 1% to 3% w/v were spherical. Figure 6c shows the particle size distribution by volume at various solution concentrations. The volume particle size distribution curve of microparticles at operating solution concentration of 3% w/v was shifted toward higher values of particle size and broader than those of 1% and 2% w/v. The average particle sizes obtained at different solution concentrations of rifampicin and polymer are reported in Table V. It was found that, by increasing the solution concentration, the volumetric mean diameter increased and the particle size distribution enlarged as evident by an increase in span value. The mean diameter of particles produced using solution concentration of 3% w/v was significantly different from those produced at solution concentration of 1% and 2% w/v by increasing from 3.28–3.40 to 4.5 (p < 0.05). It was also observed that percent of size <5 μm of microparticles using of 1% and 2% w/v solution were more than 65%, as those of 3% w/v were less than 52%. Tu et al. (2002) reported a similar effect of increasing the solution concentration from 0.6% to 2% w/v on the slight increase in size of the precipitation of L-PLA in the ASES process (34). However, at concentrations above 2% w/v, fibers were produced. It confirmed the observations by Randolph et al. (1993) that fiber formation at solution concentrations exceeding 4% w/v L-PLA in methylene chloride was found (20). Similar observations were also reported for the polystyrene/toluene/CO2 system, where a critical composition of approximately 5% w/v was reported (36). However, in this study, the microparticles processed from the absolute concentration of 3% w/v of rifampicin and L-PLA consistently provided the discrete microparticles; their particle sizes were slightly larger than those of 1% and 2% w/v. The more concentrated solution was not processed in this experiment.
To investigate the effect of carbon dioxide molar fraction on particle formation, the solution of concentration 20 mg/ml was sprayed at 172 bar and 40°C with varying feed rate of 0.4, 0.5, and 0.6 ml/min which corresponded with carbon dioxide molar fraction of 0.85, 0.82, and 0.79, respectively. The shape of microparticles obtained from various carbon dioxide molar fractions is illustrated in Fig. 5d. The average particle size and size fraction <5 μm of microparticles obtained by using different carbon dioxide molar fractions are presented in Table V. The characteristics of the rifampicin-loaded microparticles were found unlikely to be sensitive to carbon dioxide molar fraction changes in the system. The volume particle size distributions of rifampicin-loaded L-PLA microparticles produced at different carbon dioxide molar fractions were similar (Fig. 6d). It is possible that the range of carbon dioxide molar fraction varied in this study was not much different to show the effect of this factor. Reverchon and De Marco (2006) observed larger particle and border particle size distribution of microparticles prepared when carbon dioxide molar fraction decreased (24). It was explained that, when carbon dioxide molar fraction was reduced, the fluid phase formed in the precipitator contained larger quantities of solvent and the processes of solubilization and solute precipitation were slower. Therefore, microparticle formation process was shifted towards the growth process and larger particles were produced.
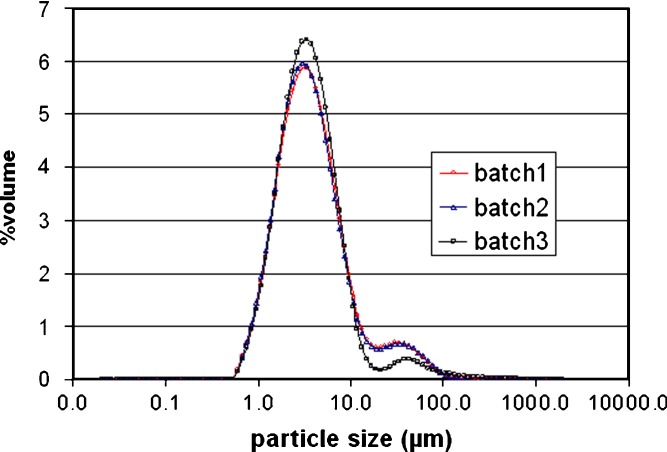
To investigate the reproducibility of the process, three consecutive batches of microparticle powder were prepared by using the following operation parameters: 2% solution of drug and polymer, pressure of 172 bar, temperature of 40°C, and carbon dioxide molar fraction at 0.82. The particle size distributions of microparticles of three consecutive preparations were reproducible (Fig. 7). The volumetric mean diameter of three consecutive batches were not significantly different (p < 0.05) (Table VI). It was observed that the percent fractions of particle size <5 μm obtained from three consecutive batches were the same about 60%.
Fig. 7.
The particle size distribution by volume of rifampicin-loaded L-PLA microparticles from three consecutive preparations. Operating condition: pressure = 172 bar, temperature = 40°C, concentration of solution = 20 mg/ml, and carbon dioxide molar fraction = 0.82
Table VI.
Average Particle Size, Span, and Percent Fraction Less than 5 μm of Microparticles of Three Consecutive Batchesa
| Batch no. | D 50% (µm) | Span | Fraction <5 μm (%) |
|---|---|---|---|
| Average (SD) | Average (SD) | Average (SD) | |
| 1 | 3.50 (0.18) | 3.21 (0.19) | 63.79 (0.55) |
| 2 | 3.40 (0.04) | 3.29 (0.25) | 65.20 (2.69) |
| 3 | 3.39 (0.13) | 2.62 (1.19) | 66.77 (0.87) |
aOperating conditions: pressure = 172 bar, temperature = 40°C, concentration of solution = 20 mg/ml, and carbon dioxide molar fraction = 0.82
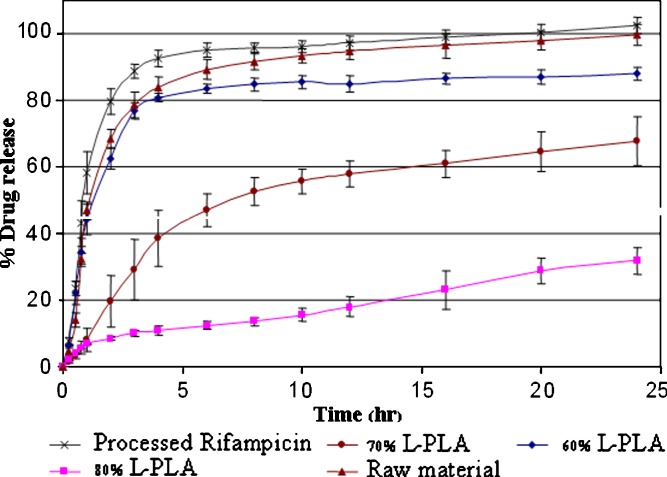
The L-PLA microparticles prepared from polymer:drug ratios of 6:4, 7:3, and 8:2 were selected for comparative drug release studies because they were discrete particles. The dissolution profiles of the microparticles in pH 7.4 PBS are shown in Fig. 8. Processed rifampicin produced by SAS technique exhibited slightly higher dissolution rate when compared to unprocessed rifampicin; this was due to a decrease in the particle size. Release rate of drug-loaded L-PLA microparticles decreased with increasing polymer content. At the polymer:drug ratio of 6:4, the initial drug release was not different from unprocessed pure drug. It might be due to the amount of drug on the surface of microparticles made from polymer:drug ratio of 6:4 was higher than those of 7:3 and 8:2. The initial burst drug release was not observed for 70% and 80% L-PLA containing microspheres. The opposite result was reported when the microparticles were prepared by spray drying method. According to the report by O’Hara and Hickey (2000), approximately 10–20% of initial burst release was found for spray dried rifampicin-loaded polymeric microparticle (6).
Fig. 8.
Release profiles of rifampicin-loaded L-PLA microparticles containing different polymer contents prepared at pressure = 172 bar, temperature = 40°C, concentration of solution = 20 mg/ml, and carbon dioxide molar fraction = 0.82
CONCLUSIONS
Successful particle engineering of rifampicin-loaded L-PLA microparticles suitable for delivery to the lung by using SAS process was demonstrated. Sustained release rifampicin-loaded L-PLA microparticles with no burst release effect could be produced by this technique. Mass ratio of drug–polymer and operating parameters have to be optimized as they might affect particle formation to yield discrete, spherical particles. The process provided consistent particle formation, including particle size, size distribution, and shape.
References
- 1.Goodman L., Gillman A. The pharmacological basis of pharmaceutics. New York: Macmillan; 1970. pp. 1208–1210. [Google Scholar]
- 2.Deol P., Khuller G. K., Joshi K. Therapeutic efficacies of isoniazid and rifampicin encapsulated in lung specific stealth liposomes against Mycobacterium tuberculosis infection induced in mice. Antimicrob. Agents Chemother. 1997;41:1211–1214. doi: 10.1128/aac.41.6.1211. [DOI] [PMC free article] [PubMed] [Google Scholar]
- 3.Quenelle D. C., Staas J. K., Winchester G. A., Barrow E. L., Barrow W. W. Efficacy of microencapsulated rifampin in Mycobacterium tuberculosis-infected mice. Antimicrob. Agents Chemother. 1999;43:1144–1151. doi: 10.1128/aac.43.5.1144. [DOI] [PMC free article] [PubMed] [Google Scholar]
- 4.Barrow E., Winchester G., Staas J., Quenelle D., Barrow W. Use of microsphere technology for targeted delivery of rifampin to Mycobacterium tuberculosis-infected macrophages. Antimicrob. Agents Chemother. 1998;42:2682–2689. doi: 10.1128/aac.42.10.2682. [DOI] [PMC free article] [PubMed] [Google Scholar]
- 5.Hickey A., Suarez S., Bhat M., Hara P., Lalor C., Atkins K., Hopfer R., McMurray D. Efficacy of rifampicin-poly (lactide-co-glycolide) microspheres in treating tuberculosis. Respir. Exch. 1998;6:201–209. [Google Scholar]
- 6.O’Hara P., Hickey A. J. Respirable PLGA microspheres containing rifampicin for the treatment of tuberculosis: manufacture and characterization. Pharm. Res. 2000;17:955–961. doi: 10.1023/A:1007527204887. [DOI] [PubMed] [Google Scholar]
- 7.Suarez S., O’Hara P., Kazantseva M., Newcomer C. E., Hopfer R., McMurray D. N., Hickey A. J. Respirable PLGA microspheres containing rifampicin for the treatment of tuberculosis: screening in an infectious disease model. Pharm. Res. 2001;18(9):1315–1319. doi: 10.1023/A:1013094112861. [DOI] [PubMed] [Google Scholar]
- 8.I. Coowanitwong, V. Arya, P. Kulvanivh, and G. (2008). Hochhaus. Slow release formulation of inhaled rifampicin. AAPS J., published online. doi:10.1028/s12248-008-9044-5. [DOI] [PMC free article] [PubMed]
- 9.Biggs D. L., Lengsfeld C. S., Hybertson B. M., Ng K.-Y., Manning M. C., Randolph T. W. In vitro and in vivo evaluation of the effects of PLA microparticle crystallinity on cellular response. J. Control. Release. 2003;92:147–161. doi: 10.1016/S0168-3659(03)00325-0. [DOI] [PubMed] [Google Scholar]
- 10.Hinds W. C. Aerosol technology: properties, behavior, and measurement of airborne particles. New York: Wiley; 1982. p. 424. [Google Scholar]
- 11.Bahrami M., Ranjbarian S. Production of micro- and nano-composite particles by supercritical carbon dioxide. J. Supercritical Fluids. 2007;40:263–283. doi: 10.1016/j.supflu.2006.05.006. [DOI] [Google Scholar]
- 12.Tom J. W., Debenedetti P. G. Particle formation with supercritical fluids—a review. J. Aerosol Sci. 1991;22:555–584. doi: 10.1016/0021-8502(91)90013-8. [DOI] [Google Scholar]
- 13.Philips E. M., Stella V. J. Rapid expansion from supercritical solutions: application to pharmaceutical processes. Int. J. Pharm. 1993;94:1–10. doi: 10.1016/0378-5173(93)90002-W. [DOI] [Google Scholar]
- 14.Debenedetti P. G., Tom J. W., Yeo S. D., Lim G. B. Application of supercritical fluids for production of sustained delivery devices. J. Control. Release. 1993;24:27–44. doi: 10.1016/0168-3659(93)90166-3. [DOI] [Google Scholar]
- 15.Tom J. W., Lim G. B., Debenedetti P. G., Prud’homme R. K. Applications of supercritical fluids in the controlled release of drugs. In: Kiran E., Brennecke J. F., editors. Supercritical Fluid Engineering Science: Fundamentals and Applications ACS Symposium Series 514. Washington DC: American Chemical Society; 1993. pp. 238–257. [Google Scholar]
- 16.Yeo S. D., Lim G. B., Debenedetti P. G. Formation of microparticulate protein powders using a supercritical fluid anti-solvent. Biotechnol. Bioeng. 1993;41:341–346. doi: 10.1002/bit.260410308. [DOI] [PubMed] [Google Scholar]
- 17.Ruchatz F., Kleinebudde P., Muller B. W. Residual solvents in biodegradable microparticles: influence of process parameters on the residual solvent in microparticles produced by the aerosol solvent extraction system (ASES) process. J. Pharm. Sci. 1997;86:101–105. doi: 10.1021/js960136o. [DOI] [PubMed] [Google Scholar]
- 18.Pasquali I., Bettini R., Giordano F. Supercritical fluid technologies: an innovative approach for manipulating the solid-state of pharmaceuticals. Adv. Drug Deliv. Rev. 2008;60:399–410. doi: 10.1016/j.addr.2007.08.030. [DOI] [PubMed] [Google Scholar]
- 19.Bleich J., Muller B. W., Wabrnus W. Aerosol system extraction system—a new microparticle production technique. Int. J. Pharm. 1993;97:111–117. doi: 10.1016/0378-5173(93)90131-X. [DOI] [Google Scholar]
- 20.Randolph T. W., Randolph A. D., Mebes M., Yeung S. Sub-micrometer-sized biodegradable particles of poly (l-lactic acid) via the gas antisolvent spray precipitation process. Biotechnol. Prog. 1993;9:429–435. doi: 10.1021/bp00022a010. [DOI] [PubMed] [Google Scholar]
- 21.Kim Y. M., Lee Y. W., Byun H.-S., Lim Jong S. Recrystallization of poly(L-lactic acid) into submicrometer particles in supercritical carbon dioxide. Ind. Eng. Chem. Res. 2006;45:3388–3392. doi: 10.1021/ie050711b. [DOI] [Google Scholar]
- 22.Reverchon E., Della Porta G., De Rosa I., Subra P., Letourneur D. Supercritical antisolvent micronization of some biopolymers. J. Supercrit. Fluids. 2000;18:239–245. doi: 10.1016/S0896-8446(00)00069-3. [DOI] [Google Scholar]
- 23.Reverchon E., Della Porta G. Production of antibiotic micro- and nano-particles by supercritical antisolvent precipitation. Powder Technol. 1999;106:23–29. doi: 10.1016/S0032-5910(99)00062-5. [DOI] [Google Scholar]
- 24.Reverchon E., De Marco I. Supercritical antisolvent precipitation of cephalosporins. Powder Technol. 2006;164:139–146. doi: 10.1016/j.powtec.2006.03.018. [DOI] [Google Scholar]
- 25.Reverchon E., De Marco I., Della Porta G. Rifampicin microparticles production by supercritical antisolvent precipitation. Int. J. Pharm. 2002;243:83–91. doi: 10.1016/S0378-5173(02)00261-2. [DOI] [PubMed] [Google Scholar]
- 26.Tandya A., Mammucaria R., Dehghani F., Foster N. R. Dense gas processing of polymeric controlled release formulations. Int. J. Pharm. 2007;328:1–11. doi: 10.1016/j.ijpharm.2006.08.016. [DOI] [PubMed] [Google Scholar]
- 27.Meyer J. D., et al. Preparation and in vitro characterization of gentamicin-impregnated bio-degradable beads suitable for treatment of osteomyelitis. J. Pharm. Sci. 1998;87:1149–1154. doi: 10.1021/js970419w. [DOI] [PubMed] [Google Scholar]
- 28.Ghaderi R., Artursson P., Carlfors J. A new method for preparing biodegradable microparticles and entrapment of hydrocortisone in DL-PLG microparticles using supercritical fluids. Eur. J. Pharm. Sci. 2000;10:1–9. doi: 10.1016/S0928-0987(99)00079-2. [DOI] [PubMed] [Google Scholar]
- 29.Bitz C., Doelker E. Influence of the preparation method on residual solvents in biodegradable microspheres. Int. J. Pharm. 1996;131:171–181. doi: 10.1016/0378-5173(95)04320-9. [DOI] [Google Scholar]
- 30.Steckel H., Thies J., Muller B. W. Micronizing of steroids for pulmonary delivery by supercritical carbon dioxide. Int. J. Pharm. 1997;152:99–110. doi: 10.1016/S0378-5173(97)00071-9. [DOI] [Google Scholar]
- 31.Reverchon E., Della Porta G. Terbutaline microparticles suitable for aerosol delivery produced by supercritical assisted atomization. Int. J. Pharm. 2003;258:1–9. doi: 10.1016/S0378-5173(03)00024-3. [DOI] [PubMed] [Google Scholar]
- 32.Kim Y. H., Shing K. S. Supercritical fluid-micronized ipratropium bromide for pulmonary drug delivery. Powder Technol. 2008;182:25–32. doi: 10.1016/j.powtec.2007.04.009. [DOI] [Google Scholar]
- 33.Panchagnula R., Sood A., Sharda N., Kaur K., Kaul C. L. Determination of rifampicin and its main metabolite in plasma and urine in presence of pyrazinamide and isoniazid by HPLC method. J. Pharm. Biomed. Anal. 1999;18:1013–1020. doi: 10.1016/S0731-7085(98)00112-5. [DOI] [PubMed] [Google Scholar]
- 34.Tu L., Dehghani F., Foster N. R. Micronisation and microencapsulation of pharmaceuticals using a carbon dioxide antisolvent. Powder Technol. 2002;126:134–149. doi: 10.1016/S0032-5910(02)00045-1. [DOI] [Google Scholar]
- 35.Bodmeier R., Wang H., Dixon D. J., Mawson S., Johnston K. P. Polymeric microspheres prepared by spray into compressed carbon dioxide. Pharm. Res. 1995;12:1211–1217. doi: 10.1023/A:1016276329672. [DOI] [PubMed] [Google Scholar]
- 36.Dixon D. J., Johnston K. P., Bodmeier R. A. Polymeric materials formed by precipitation with a compressed fluid antisolvent. AIChE J. 1993;39(1):127–139. doi: 10.1002/aic.690390113. [DOI] [Google Scholar]
- 37.Bleich J., Kleinebudde P., Muller B. W. Influence of gas density and pressure on microparticles produced with the ASES process. Int. J. Pharm. 1994;106:77–84. doi: 10.1016/0378-5173(94)90278-X. [DOI] [Google Scholar]


