

Abstract
Stress-related psychiatric disorders such as anxiety and depression involve dysfunction of the serotonin [5-hydroxytryptamine (5-HT)] system. Previous studies have found that the stress neurohormone corticotropin-releasing factor (CRF) inhibits 5-HT neurons in the dorsal raphe nucleus (DRN) in vivo. The goals of the present study were to characterize the CRF receptor subtypes (CRF-R1 and -R2) and cellular mechanisms underlying CRF–5-HT interactions. Visualized whole-cell patch-clamp recording techniques in brain slices were used to measure spontaneous or evoked GABA synaptic activity in DRN neurons of rats and CRF effects on these measures. CRF-R1 and -R2-selective agonists were bath applied alone or in combination with receptor-selective antagonists. CRF increased presynaptic GABA release selectively onto 5-HT neurons, an effect mediated by the CRF-R1 receptor. CRF increased postsynaptic GABA receptor sensitivity selectively in 5-HT neurons, an effect to which both receptor subtypes contributed. CRF also had direct effects on DRN neurons, eliciting an inward current in 5-HT neurons mediated by the CRF-R2 receptor and in non-5-HT neurons mediated by the CRF-R1 receptor. These results indicate that CRF has direct membrane effects on 5-HT DRN neurons as well as indirect effects on GABAergic synaptic transmission that are mediated by distinct receptor subtypes. The inhibition of 5-HT DRN neurons by CRF in vivo may therefore be primarily an indirect effect via stimulation of inhibitory GABA synaptic transmission. These results regarding the cellular mechanisms underlying the complex interaction between CRF, 5-HT, and GABA systems could contribute to the development of novel treatments for stress-related psychiatric disorders.
Keywords: serotonin, stress, urocortin II, antalarmin, antisauvagine-30, IPSC
Introduction
Stress-related psychiatric disorders such as depression and anxiety are frequently characterized by dysfunctions of corticotropin-releasing factor (CRF) (Nemeroff, 1988; Gold et al., 1995; Arborelius et al., 1999; Reul and Holsboer, 2002) and 5-hydroxytryptamine (5-HT) systems (Charney et al., 1990a,b; Meltzer, 1990). Stress regulates the 5-HT system in a complex stressor- and region-specific manner (Kirby et al., 1995, 1997; Adell et al., 1997). In vivo microdialysis and electrophysiology studies have shown that a particular stressor, swim stress, inhibits 5-HT release in certain targets and that this effect is mediated by the inhibition of 5-HT neuronal activity in the serotonergic dorsal raphe nucleus (DRN) by the endogenous release of CRF (Kirby et al., 1995; Price et al., 2002). Exogenous administration of CRF alters 5-HT DRN neuronal activity and 5-HT release in forebrain targets with a U-shaped dose–response function (Price et al., 1998; Kirby et al., 2000; Price and Lucki, 2001). Both CRF receptor subtypes (CRF-R1 and -R2) are found in the DRN (De Souza et al., 1985; Potter et al., 1994; Chalmers et al., 1995) and both receptors contribute to CRF effects on neuronal activity of 5-HT DRN neurons (Kirby et al., 2000; Pernar et al., 2004). CRF terminals target both 5-HT and GABA neurons in the DRN (Waselus et al., 2005) and CRF receptors are located on both GABA and 5-HT DRN neurons (Kirby et al., 2001; Roche et al., 2003; Day et al., 2004). CRF is thus anatomically poised to regulate 5-HT neurotransmission in the DRN either directly at 5-HT neurons or indirectly via GABAergic afferents to those neurons. The goal of this study was to determine at the cellular level the receptors underlying these CRF–5-HT interactions by examining the effects of receptor-selective CRF ligands on 5-HT and non-5-HT DRN neurons and their GABA synaptic activity in rats. The effect of the CRF-R1-preferring agonist ovine CRF (oCRF) [eight times more potent at the CRF-R1 than -R2 receptor (Lovenberg et al., 1995)] was compared with the CRF-R2 agonist urocortin II (UCN II). In addition, oCRF effects were examined in the presence of the CRF-R1 antagonist antalarmin or the CRF-R2 antagonist antisauvagine-30 (ASVG-30).
Materials and Methods
Subjects.
Male Sprague Dawley rats (Taconic Farms), 4–5 weeks of age, were housed two to three per cage on a 12 h light schedule (lights on at 7:00 A.M.) in a temperature-controlled (20°C) colony room. Rats were given access to standard rat chow and water ad libitum. Animal protocols were approved by the Institutional Animal Care and Use Committee and were conducted in accordance to the National Institutes of Health Guide for the Care and Use of Laboratory Animals.
Slice preparation.
Rats were rapidly decapitated and the head placed in ice-cold artificial CSF (ACSF) in which sucrose (248 mm) was substituted for NaCl. The brain was rapidly removed and trimmed to isolate the brainstem region. Slices (200 μm thick) were cut throughout the rostrocaudal extent of the DRN using a Leica microslicer (Leica) or Vibratome 3000 Plus (Vibratome) and placed in a holding vial containing ACSF with l-tryptophan (50 μm) at 35°C bubbled with 95% O2/5% CO2 for 1 h. Slices were then maintained in room temperature ACSF bubbled with 95% O2/5% CO2. The composition of the ACSF was as follows (in mm): 124 NaCl, 2.5 KCl, 2 NaH2PO4, 2.5 CaCl2, 2 MgSO4, 10 dextrose, and 26 NaHCO3.
Electrophysiological recording.
Slices were transferred to a recording chamber (Warner Instruments) and continuously perfused with ACSF at 1.5–2.0 ml/min at 32–34°C maintained by an in-line solution heater (TC-324; Warner Instruments). Only one cell was recorded per brain slice. Raphe neurons were visualized using a Nikon E600 upright microscope fitted with a 40× water-immersion objective, differential interference contrast and infrared filter (Optical Apparatus). The image from the microscope was enhanced using a CCD camera and displayed on a computer monitor. Whole-cell recording pipettes were fashioned on a P-97 micropipette puller (Sutter Instrument) using borosilicate glass capillary tubing (1.2 mm outer diameter, 0.69 mm inner diameter; Warner Instruments). The resistance of the electrodes was 4–8 MΩ when filled with an intracellular solution of the following (in mm): 70 K-gluconate, 70 KCl, 2 NaCl, 4 EGTA, 10 HEPES, 4 MgATP, 0.3 Na2GTP, 0.1% biocytin, pH 7.3.
Spontaneous IPSC recordings were made in cells located in the dorsomedial and ventromedial subdivisions of the DRN at the midcaudal levels [corresponding to −7.6 to −8.3 mm caudal to bregma in Paxinos and Watson (1998)] that contain dense clusters of 5-HT neurons. These DRN subdivisions were also chosen because previous in vivo studies of CRF effects on 5-HT DRN neuronal activity were conducted in dorsomedial/ventromedial DRN 5-HT neurons (Kirby et al., 2000). A visualized cell was approached with the electrode, a GΩ seal established, and the cell membrane ruptured to obtain a whole-cell recording using either a Multiclamp 700B (Molecular Devices), Axopatch 200B (Molecular Devices), or HEKA patch-clamp EPC-10 amplifier (HEKA Elecktronik). Series resistance was monitored throughout the experiment. If the series resistance was unstable or exceeded four times the electrode resistance, the cell was discarded. Once the whole-cell recording was obtained, IPSCs were recorded in voltage-clamp mode (Vm = −70 mV). For the Axoclamp and Axopatch amplifiers, signals were digitized by Digidata 1320 series analog-to-digital converters and stored on-line using pClamp 7/8/9 software (Molecular Devices). For the HEKA amplifier, signals were stored on-line using Pulse software. Signals were filtered at 1 kHz and digitized at 10 kHz. The liquid junction potential was ∼9 mV between the pipette solution and the ACSF and was not subtracted from the data obtained.
For evoked IPSC (eIPSC) experiments, tungsten stimulating electrodes (World Precision Instruments) were placed dorsolateral (100–200 μm distance) to the recorded cell and stimuli delivered with an IsoFlex stimulus isolator (A.M.P.I.). For these experiments, recorded cells were located in either the dorsomedial or ventromedial DRN. For each cell, a stimulus–response curve was generated and a stimulus intensity producing a half-maximal response was used for subsequent paired-pulse experiments. For paired-pulse experiments, the interpulse interval was 50 ms and the interpair interval was 10 s. The mean stimulus intensity was 3.5 ± 0.6 mA with a range of 0.7 to 9.6 mA.
Experimental protocols.
GABAergic IPSCs were isolated by addition of the non-NMDA receptor antagonist 6-cyano-7-nitroquinoxaline-2,3-dione (CNQX) (20 μm) or 6,7-dinitroquinoxaline-2,3(1H,4H)-dione (DNQX) (20 μm). Spontaneous IPSCs (sIPSCs) were recorded for 6 min. Tetrodotoxin (TTX) (1 μm) was added to block action potential-dependent events and miniature spontaneous IPSCs (mIPSCs) were recorded for 6–9 min. Ovine CRF or UCN II was then added to the perfusion bath and recorded for 9 min. All statistically significant physiological effects of oCRF were then tested for CRF receptor subtype contributions using selective CRF antagonists. For antagonist experiments, it was not possible to make within-cell comparisons of the effect of oCRF before and after the antagonist because oCRF effects were so long lasting (see Results). Therefore, after baseline mIPSC recording, antalarmin or ASVG-30 was added and data were collected for 6 min. Next, oCRF was added and data were collected for 9 min. For stimulation experiments, baseline paired-pulse data were collected for 10–20 min. Ovine CRF was then added to the perfusion bath and paired-pulse data were collected for an additional 10–20 min. In some cells (both spontaneous and evoked IPSC experiments), the GABAA receptor mediation of IPSCs was verified at the end of the experiment with the addition of the GABAA receptor antagonist bicuculline (20 μm). Under these conditions, bicuculline eliminated all IPSC activity (for example, see Fig. 2A′).
Figure 2.

Ovine CRF selectively increased amplitude of evoked IPSCs and decreased paired pulse ratio in 5-HT DRN neurons. A illustrates three traces of evoked IPSCs (averaged from 60 eIPSCs under each condition: baseline, oCRF, and bicuculline) from a 5-HT neuron. Ovine CRF (10 nm) elevated eIPSC amplitude in this cell from 163 pA (baseline) to 210 pA. Addition of GABAA antagonist bicuculline (20 μm) abolished eIPSC amplitude. A′ illustrates the finding that oCRF significantly elevated mean eIPSC amplitude above baseline values for both the first and second eIPSCs in a pair (N = 28; p < 0.01). A″ shows that both oCRF and the CRF-R1 antagonist antalarmin (300 nm) elevated eIPSC amplitude above baseline (p < 0.01), but the effect of oCRF was significantly diminished in the presence of antalarmin (p < 0.01) (N = 15). B shows paired-pulse traces from a 5-HT neuron (averaged from 60 pairs under each condition: baseline and oCRF). Ovine CRF decreased PPR from 0.68 to 0.58. B′ shows that oCRF significantly decreased the mean PPR in 5-HT DRN neurons below baseline values (N = 28; p < 0.01). B″ shows that the inhibition of eIPSC PPR by oCRF in 5-HT DRN neurons (p < 0.01) was blocked by antalarmin (p < 0.01) (N = 15). Neither eIPSC amplitude nor PPR was affected by oCRF in non-5-HT DRN neurons (data not shown). For antagonist experiments (A″, B″), in which the antagonist and oCRF were applied sequentially, a separate baseline was calculated for each drug from measures taken just before application of the drug. The asterisks indicate a significant difference from baseline values by paired t test (**p < 0.01), and the pound signs indicate a significant difference from oCRF by unpaired t test (##p < 0.01). Data are expressed as mean ± SEM.
Immunohistochemistry.
Standard immunofluorescence procedures were used to visualize the filled cell and neurotransmitter content (Beck et al., 2004). Slices were postfixed in 4% paraformaldehyde overnight. Sections were incubated in PBS containing 0.5% Triton and bovine serum albumin (30 min). Sections were then incubated in rabbit α-5-HT antibody (1:2000; ImmunoStar) for 1 week at 4°C or mouse α-tryptophan hydroxylase antibody (1:500; Sigma-Aldrich) overnight at 4°C. Subsequently, immunohistochemical labeling was visualized using an Alexa 488-conjugated donkey α-rabbit secondary antiserum (1:200; Invitrogen) or FITC-conjugated donkey α-mouse secondary antiserum (1:200; Jackson ImmunoResearch) for 60 min at room temperature. The biocytin was visualized using streptavidin-conjugated Alexa 633 or 647 (1:100 or 1:200; Invitrogen) for 60 min at room temperature. Between incubations, slices were rinsed with phosphate buffer solutions (three times for 10 min each time). Sections were mounted with ProLong Antifade Kit (Invitrogen) on Superfrost Plus slides (Fisher Scientific) and visualized and captured by digital camera using a Leica DMIRE2 with Leica confocal software (Leica Microsystems) or Olympus FV300 confocal microscope with FluoView software (Olympus America). When using the confocal microscope sequential collection (i.e., Alexa 633/647 separately from FITC/Alexa 488), images of 0.6 μm thickness were acquired at the level of the cell body of the biocytin-labeled neuron. The laser power and emission filters were adjusted for both the red and green fluorophor so that there was minimal possibility of a false-positive result. No cell was included in the study if it could not be conclusively identified as either 5-HT- or non-5-HT-containing by immunohistochemistry.
Data analysis.
MiniAnalysis software (Synaptosoft) was used to analyze mIPSC events on the basis of amplitude, rate of rise, duration, and area. Initially, noise analysis was conducted for each cell and amplitude detection thresholds set to exceed noise values. Events were automatically selected, analyzed for double peaks, and then visually inspected and confirmed. Event amplitude histograms were generated and compared with the noise histogram to ensure that they did not overlap. Synaptic activity was analyzed for frequency, amplitude, baseline holding current, rise time (calculated from 10 to 90% of peak amplitude), and decay time (calculated by averaging 200 randomly selected events and fitting a double-exponential function from 10 to 90% of the decay phase). The double-exponential function for the decay phase generates an initial fast component and a subsequent slow component of the decay phase. Data were collected in 1 min bins during the 9 min period after drug application, taking into account a 2 min lag time from drug addition to initial drug effect attributable to recording chamber volume and perfusion rate. The maximum postdrug steady-state value (1 min bin) was reported as the drug effect for each cell, typically occurring 6–9 min after drug application. Baseline synaptic activity data were compared between experimental groups by one-way ANOVA (or Kruskal–Wallis one-way ANOVA on ranks for non-normally distributed data). The effects of CRF agonists on synaptic event characteristics or holding current were analyzed by paired Student's t tests (or Wilcoxon's signed rank test for non-normally distributed data). The effects of CRF antagonists on synaptic event characteristics or holding current were presented either as a percentage change from baseline (see Figs. 2, 5) or as raw data (Table 1). For antagonist experiments in which two drugs were applied sequentially (antagonist plus oCRF), baseline for the antagonist was measured just before its application (the “no drug” condition). Baseline for the oCRF that followed was measured just before its application, when the antagonist effect had reached steady state. Raw data for CRF antagonist studies (Table 1) were analyzed by repeated-measures ANOVA (or Friedman's repeated-measures ANOVA on ranks for non-normally distributed data) with post hoc Student–Newman–Keuls tests for pairwise comparisons. In Figure 5, antagonist data presented as a percentage change from their baseline values were analyzed by two-way repeated-measures ANOVA with post hoc Student–Newman–Keuls tests for pairwise comparisons. In Figure 5, oCRF with antagonist pretreatment was compared with oCRF with “ACSF pretreatment.” These ACSF control data represent a comparison of the first to the sixth minute of baseline data during which cells were exposed only to ACSF. In Figure 2, antagonist data presented as a percentage change from their baseline values were compared with those baseline values by paired Student's t tests (or Wilcoxon's signed rank test for non-normally distributed data). In Figure 2, antagonists in combination with oCRF were also compared with oCRF alone by unpaired Student's t tests (or Mann–Whitney's rank sum test for non-normally distributed data). To determine whether presynaptic and postsynaptic effects of CRF agonists occurred in the same cells, Pearson's product moment correlation analysis was performed. The frequency and amplitude of IPSC events in individual cells were also illustrated as cumulative probability graphs for interevent interval and amplitude and control versus drug treatments compared by the Kolmogorov–Smirnov test. A probability of p < 0.05 was considered significant. Most data are reported as mean ± SEM. IPSC rise time, whose frequency distributions were not normally distributed, was presented as median ± SEM.
Figure 5.
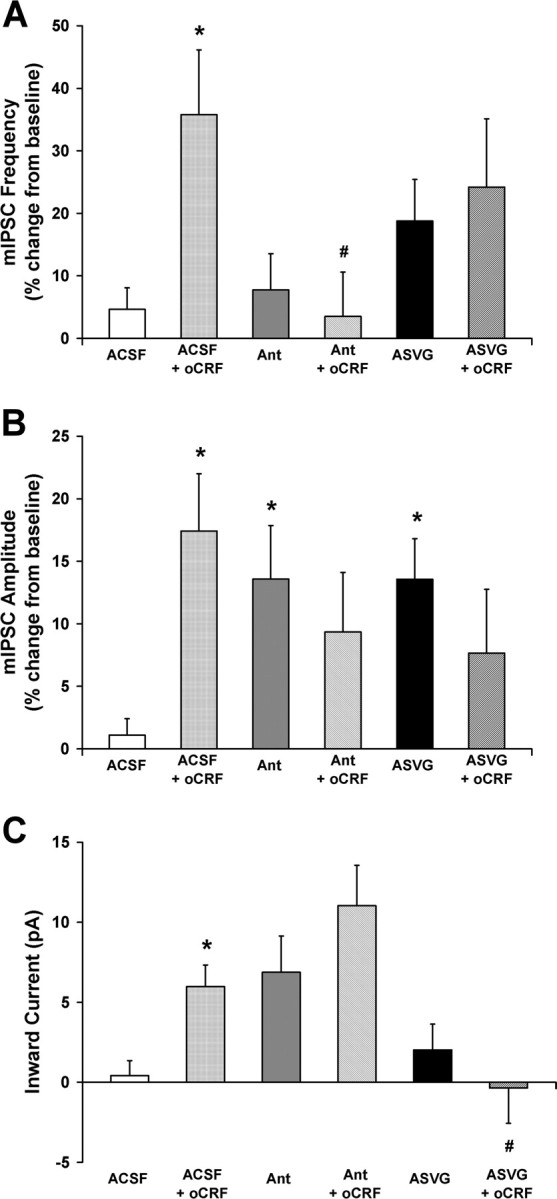
Ovine CRF effects on GABA synaptic activity and membrane characteristics in 5-HT DRN neurons were differentially mediated by CRF-R1 and CRF-R2 receptor subtypes. A illustrates oCRF effects (10 nm) on mean mIPSC frequency (expressed as a percentage of baseline) in the presence of ACSF or the CRF-R1-selective antagonist antalarmin (300 nm) or the CRF-R2-selective antagonist ASVG-30 (100 nm). The significant elevation of mIPSC frequency by oCRF (A) was blocked by antalarmin but not by ASVG-30, indicating that this effect was mediated by the CRF-R1 receptor subtype. B illustrates oCRF effects on mean mIPSC amplitude (expressed as a percentage of baseline) in the presence of ACSF or the receptor-selective antagonists. The significant elevation of mIPSC amplitude by oCRF (B) was blocked by both antalarmin and ASVG-30, indicating that this effect was mediated by both the CRF-R1 and CRF-R2 receptor subtypes. C illustrates oCRF effects on mean inward current in the presence of ACSF or the receptor-selective antagonists. The significant change in mean inward current by oCRF (C) was blocked by ASVG-30 but not by antalarmin, indicating that this effect was mediated by the CRF-R2 receptor subtype. Intrinsic effects of antalarmin and ASVG-30 on mIPSC amplitude are also demonstrated. For these experiments in which the antagonist and oCRF were applied sequentially, a separate baseline was calculated for each drug from measures taken just before application of the drug. Post hoc Student–Newman–Keuls tests show significant group differences indicated by asterisk (*) (vs ACSF) or pound sign (#) (vs ACSF + oCRF) (p < 0.05). Data are expressed as mean ± SEM.
Table 1.
Effect of CRF and CRF receptor-selective agonists and antagonists on mIPSC characteristics and inward current in DRN neurons
| mIPSC frequency (Hz) |
mIPSC amplitude (pA) |
mIPSC rise time (ms) |
mIPSC fast decay time (ms) |
mIPSC slow decay time (ms) |
Inward current (pA) |
|||||||
|---|---|---|---|---|---|---|---|---|---|---|---|---|
| 5-HT | Non-5-HT | 5-HT | Non-5-HT | 5-HT | Non-5-HT | 5-HT | Non-5-HT | 5-HT | Non-5-HT | 5-HT | Non-5-HT | |
| Control | 6.7 ± 0.6 | 6.0 ± 1.0 | 16.2 ± 0.8 | 29.3 ± 3.8 | 1.3 ± 0.1 | 1.0 ± 0.1 | 3.6 ± 0.2 | 3.8 ± 0.4 | 30.4 ± 11.7 | 23.5 ± 6.3 | −30.9 ± 3.8 | −23.2 ± 8.7 |
| + oCRF | 8.7 ± 0.8 | 5.8 ± 1.1 | 18.6 ± 1.3 | 29.0 ± 4.1 | 1.4 ± 0.1 | 1.1 ± 0.9 | 4.4 ± 0.5 | 4.2 ± 0.5 | 36.7 ± 16.1 | 42.9 ± 18.0 | −36.9 ± 3.9 | −33.0 ± 9.1 |
| (N = 26, 13) | ** | ** | * | ** | ** | |||||||
| Control | 8.3 ± 0.9 | 4.7 ± 0.7 | 18.5 ± 1.2 | 19.0 ± 2.0 | 1.1 ± 0.1 | 1.0 ± 0.1 | 3.3 ± 0.2 | 3.5 ± 0.4 | 30.2 ± 8.3 | 14.9 ± 2.4 | −18.8 ± 2.7 | −23.6 ± 5.0 |
| + UCN II | 8.9 ± 1.0 | 5.6 ± 0.7 | 22.9 ± 1.6 | 20.8 ± 1.7 | 1.1 ± 0.1 | 1.1 ± 0.1 | 4.1 ± 0.3 | 3.8 ± 0.4 | 32.6 ± 7.3 | 17.9 ± 3.0 | −28.4 ± 4.1 | −26.5 ± 6.4 |
| (N = 16, 14) | ** | * | ** | |||||||||
| Control | 9.4 ± 1.0 | 18.0 ± 2.2 | 1.3 ± 0.1 | 3.6 ± 0.2 | 15.8 ± 2.0 | −27.6 ± 4.3 | −13.4 ± 14.9 | |||||
| + Antalarmin | 9.8 ± 1.1 | 20.3 ± 2.4 | 1.3 ± 0.1 | 4.4 ± 0.3 | 50.0 ± 20.1 | −34.4 ± 3.9 | −22.1 ± 18.9 | |||||
| # | # | # | ||||||||||
| + oCRF | 9.5 ± 1.0 | 21.2 ± 2.1 | 1.3 ± 0.1 | 4.4 ± 0.4 | 37.0 ± 9.3 | −45.5 ± 4.1 | −27.4 ± 17.6 | |||||
| (N = 20, 6) | # | # | #, † | |||||||||
| Control | 6.3 ± 1.0 | 18.1 ± 1.4 | 1.1 ± 0.1 | 3.5 ± 0.2 | 17.1 ± 4.0 | −25.8 ± 4.1 | ||||||
| + ASVG-30 | 7.4 ± 1.1 | 20.6 ± 1.8 | 1.1 ± 0.1 | 3.6 ± 0.2 | 15.9 ± 3.0 | −27.8 ± 4.0 | ||||||
| + oCRF | 8.8 ± 1.5 | 21.7 ± 1.7 | 1.1 ± 0.1 | 3.8 ± 0.3 | 17.0 ± 3.6 | −27.4 ± 3.7 | ||||||
| (N = 17) | #, † | # | ||||||||||
Data are expressed as mean (frequency, amplitude, decay time, and inward current) or median (rise time) ± SEM.
The asterisks indicate a significant difference from mIPSC controls (*p < 0.05,
**p < 0.01) by paired Student's t test. Antagonist experiments were analyzed by repeated-measures ANOVA.
The pound sign (#) indicates a significant difference from mIPSC controls and the dagger
(†) indicates a significant difference from the antagonist baseline by post hoc Student–Newman–Keuls test (p < 0.05).
Evoked IPSC amplitude was calculated by subtracting the peak current from the current obtained during a 5 ms window immediately preceding the stimulus artifact. Baseline eIPSC amplitude was averaged from at least 60 consecutive trials calculated over at least 10 min before drug application. Stimulus pairs had a 50 ms interstimulus interval with a 10 s interval between pairs. Paired-pulse ratio (PPR) was calculated as the amplitude of the second eIPSC divided by the amplitude of the first eIPSC. Ovine CRF effects were determined from the average of at least 60 consecutive trials after drug application. The effect of oCRF on eIPSC amplitude or PPR was analyzed by comparing pre- and post-oCRF values by paired Student's t test.
Drugs.
Most chemicals for making the ACSF and electrolyte solution, as well as antalarmin and ASVG-30, were obtained from Sigma-Aldrich. DNQX was purchased from Tocris, and TTX was purchased from Calbiochem. Antalarmin and DNQX were dissolved in DMSO (final DMSO concentration in bath, 0.015%). Ovine CRF and UCN II were generously supplied by Dr. Jean Rivier (Clayton Foundation Laboratories for Peptide Biology, The Salk Institute, La Jolla, CA). Ovine CRF, UCN II, and ASVG-30 were stored as 10 μg samples (−80°C) and dissolved in ACSF on the day of the experiment to make a 1.0 mg/ml solution. The final drug concentrations were as follows: oCRF, 10 nm; UCN II, 10 nm; antalarmin, 300 nm; ASVG-30, 100 nm.
Results
Basal IPSC characteristics
Basal IPSC characteristics were examined in 5-HT and non-5-HT DRN neurons. Total sIPSC frequency (5-HT cells, 5.7 ± 1.3 Hz, N = 6; non-5-HT cells, 5.0 ± 1.1 Hz, N = 6) was not statistically different from mIPSC frequency (5-HT cells, 5.9 ± 1.0 Hz, N = 6; non-5-HT cells, 5.5 ± 1.4 Hz, N = 6). This finding indicates that the majority of spontaneous IPSCs in the DRN are non-action potential-dependent, representing spontaneous fusion of GABA vesicles with the presynaptic membrane. As a consequence, sIPSC data are not shown in any of the figures. Basal mIPSC frequency, amplitude, rise time, decay time, and membrane holding current were also compared between 5-HT and non-5-HT neurons. For this comparison, baseline data from all experimental groups (oCRF, UCN II, antalarmin, ASVG-30) were pooled because ANOVA demonstrated that there were no significant differences in baseline values for mIPSC frequency, mIPSC amplitude, mIPSC rise time, mIPSC fast or decay times, or membrane holding current between these experimental groups (5-HT cells, N = 79; non-5-HT cells, N = 41). The amplitude of mIPSCs was significantly smaller in 5-HT than non-5-HT neurons (5-HT mIPSC amplitude, 17.5 ± 0.7 pA; non-5-HT mIPSC amplitude, 22.3 ± 1.8 pA; p < 0.01). Median rise time was greater in 5-HT than non-5-HT cells (5-HT, 1.21 ± 0.04; non-5-HT, 1.01 ± 0.05; p < 0.01). No other mIPSC characteristics differed between the groups, indicating that resting membrane potential and presynaptic GABA release are similar, whereas postsynaptic GABA receptors and receptor kinetics differ between the 5-HT- and non-5-HT-containing neurons in the basal state.
Ovine CRF, but not UCN II, has presynaptic actions on spontaneous GABA release: increasing mIPSC frequency selectively in 5-HT DRN neurons
Ovine CRF effects on mIPSC frequency were examined in 5-HT and non-5-HT DRN neurons (Fig. 1). The majority of these recordings were in ventromedial DRN neurons. Data (basal synaptic activity and oCRF responses) from the dorsomedial DRN neurons did not differ from ventromedial DRN neurons by unpaired Student's t test; therefore, data from both subdivisions were pooled. These effects were examined in 26 5-HT neurons recorded from 23 subjects and in 13 non-5-HT neurons recorded from 13 subjects. Figure 1, A and A′, shows mIPSC activity recordings and the effect of oCRF (10 nm) in two neurons that were subsequently identified to be 5-HT-containing [tryptophan hydroxylase-immunoreactive (IR) positive] (Fig. 1C) and non-5-HT-containing (tryptophan hydroxylase-IR negative) (Fig. 1C′) by immunohistochemistry. IPSC frequency was increased from 6.7 to 8.45 Hz (26%) in response to oCRF in the 5-HT but not the non-5-HT neuron. Cumulative probability graphs of interevent interval for each cell (Fig. 1B,B′) illustrate a significant shift to the left in the 5-HT but not the non-5-HT neuron as IPSC frequency was stimulated by oCRF (5-HT, Z = 2.45, p < 0.01; non-5-HT, Z = 0.89, NS). IPSCs are mediated by GABAA receptors because mIPSC frequency was completely suppressed by the GABAA receptor antagonist bicuculline (20 μm) under these conditions (data not shown). UCN II did not alter mIPSC frequency in either 5-HT- or non-5-HT-containing neurons (N = 16 and 14 neurons recorded from 15 and 11 subjects, respectively).
Figure 1.
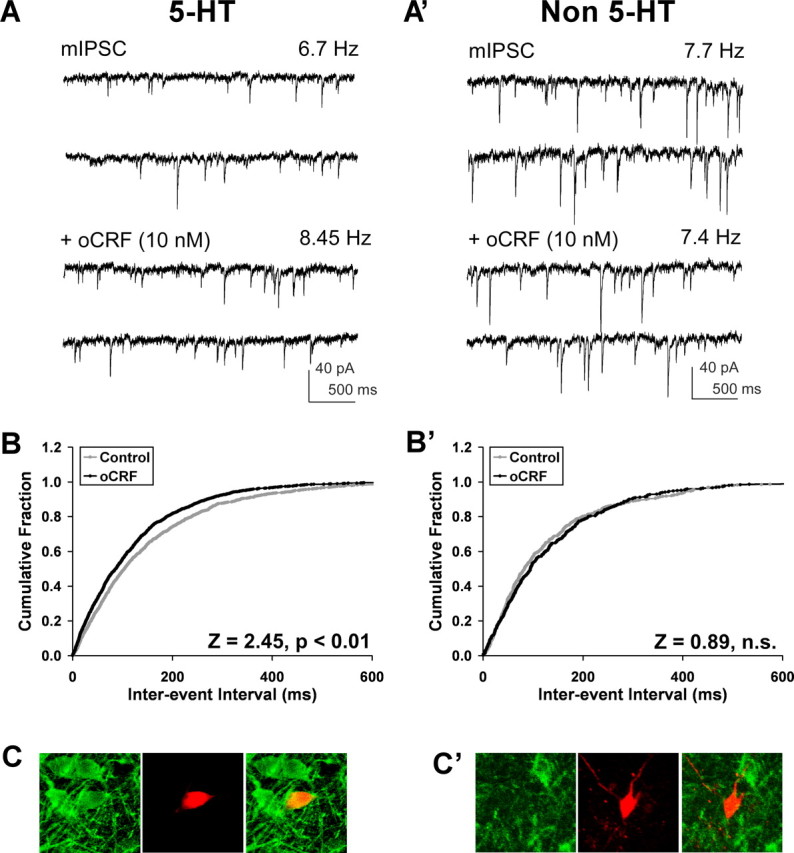
Ovine CRF enhanced GABAergic mIPSC frequency selectively in 5-HT DRN neurons. A and A′ show raw traces of mIPSCs (recorded in the presence of 1 μm TTX) and mIPSCs plus oCRF (10 nm) recorded from a 5-HT (A) and non-5-HT (A′) cell. Ovine CRF elevated mIPSC frequency from 6.7 to 8.45 Hz in the 5-HT cell but had no effect in the non-5-HT cell. The cumulative interevent interval graph for the 5-HT cell (B), but not for the non-5-HT cell (B′), illustrates a significant shift to the left (by the Kolmogorov–Smirnov test, p < 0.01) as mIPSC frequency was stimulated by oCRF. C and C′ are fluorescent photomicrographs demonstrating the neurochemical identity of the recorded cells as 5-HT (C) and non-5-HT (C′). The recorded biocytin-filled cells are shown in red, tryptophan hydroxylase-IR is shown in green, and the merged panels demonstrate either a double-labeled (yellow) (C) or non-double-labeled cell (red) (C′). Miniature IPSCs were mediated by GABAA receptors as they were completely suppressed by the GABAA receptor antagonist bicuculline (20 μm) under these conditions (data not shown).
Data for all the cells are summarized in Table 1. There was a significant increase in mean mIPSC frequency produced by oCRF selectively in 5-HT neurons (p < 0.01). These effects of oCRF were produced by a 10 nm concentration. Most previous studies with CRF in brain slices have found effects with this and higher concentrations of CRF (0.01–1 μm) (Liu et al., 2004; Nie et al., 2004; Tan et al., 2004; Kash and Winder, 2006). We tested a higher concentration of oCRF (100 nm) in 12 5-HT neurons recorded from eight subjects and found that it produced a small (4.0–5.0 Hz) but nonsignificant increase in mIPSC frequency. This higher concentration also did not significantly affect any other aspects of GABA synaptic activity examined (data not shown) and may reflect the U-shaped dose–effect function of oCRF on 5-HT neurotransmission that has previously been observed in vivo. Whereas low concentrations of oCRF significantly inhibit DRN neuronal activity and 5-HT release in forebrain, higher concentrations produce only marginal or slightly excitatory effects (Price et al., 1998; Kirby et al., 2000).
Ovine CRF has presynaptic actions on evoked GABA release: increasing eIPSC amplitude and decreasing paired-pulse ratio selectively in 5-HT DRN neurons
The results from mIPSC data indicating an oCRF-induced increase in presynaptic GABA release were confirmed with eIPSC experiments. Ovine CRF effects on eIPSC amplitude and paired-pulse ratio were examined in 5-HT and non-5-HT DRN neurons (Fig. 2). Evoked IPSCs were recorded in 5-HT neurons in the dorsomedial (N = 14) as well as the ventromedial subdivision of the DRN (N = 14). Basal eIPSC amplitude, basal PPR, eIPSC response to oCRF, and PPR response to oCRF did not differ between cells in these two DRN subdivisions, as determined by unpaired Student's t test. For this reason, data from all 5-HT DRN cells were pooled (N = 28 neurons recorded from 17 subjects) in Figure 2, A′ and B′. Figure 2A shows eIPSCs averaged from 60 events before (baseline) and after oCRF administration (29% increase) in a 5-HT DRN neuron. Figure 2A′ shows that oCRF significantly elevated mean eIPSC amplitude in 5-HT DRN neurons for both the first and second eIPSCs in a pair (p < 0.01). In contrast, oCRF had no significant effect on mean eIPSC amplitude in non-5-HT DRN neurons (N = 7 neurons recorded from seven subjects; eIPSC1 baseline values, 157 ± 29 pA; eIPSC1 oCRF values, 179 ± 21 pA; eIPSC2 baseline values, 121 ± 27 pA; eIPSC2 oCRF values, 136 ± 23 pA). Bicuculline completely suppressed eIPSC amplitude, indicating that eIPSCs were mediated by the GABAA receptor (Fig. 2A). Figure 2B shows paired-pulse data averaged from 60 pairs before (baseline) and after oCRF administration in a 5-HT DRN neuron. Ovine CRF decreased the PPR by 15% in this neuron. Figure 2B′ shows that oCRF significantly reduced mean PPR in 5-HT DRN neurons (p < 0.01). In contrast, oCRF had no significant effect on mean PPR in non-5-HT neurons (N = 7; baseline values, 0.75 ± 0.06; oCRF values, 0.74 ± 0.06). Antagonism experiments (Fig. 2A″) demonstrated that, whereas both oCRF and the CRF-R1 antagonist antalarmin individually produced significant elevations of eIPSC amplitude above baseline (p < 0.01), the effect of oCRF was significantly diminished in the presence of antalarmin (p < 0.01). Figure 2B″ also shows that the inhibition of eIPSC PPR by oCRF in 5-HT DRN neurons (p < 0.01) was blocked by antalarmin (p < 0.01). These data indicate that both of the effects of oCRF on eIPSC amplitude and PPR were mediated by the CRF-R1 receptor subtype. We also tested the washout of oCRF effects. In the majority of cells tested, oCRF effects failed to completely reverse, persisting despite waiting as long as 60 min. We further tried to reverse the effect of oCRF with a subsequent application of an antagonist, with only limited success. Similar difficulties have been observed with bath application of CRF ligands onto brain slices in other studies (Rainnie et al., 1992; Ungless et al., 2003; Jedema and Grace, 2004; Kash and Winder, 2006; Ugolini et al., 2008). The persistence of this CRF receptor-mediated effect has been suggested to reflect slow kinetics of dissociation of CRF from its receptors in the brain slice preparation (Ugolini et al., 2008).
Ovine CRF and UCN II have postsynaptic actions on GABA receptors: increasing mIPSC amplitude selectively in 5-HT DRN neurons
Ovine CRF and UCN II (10 nm) effects on mIPSC amplitude were examined in 5-HT and non-5-HT DRN neurons (Fig. 3). Figure 3, A and B, are mIPSC traces averaged from 200 events before (control) and at the maximal steady-state effect of oCRF in a 5-HT-containing and a non-5-HT-containing DRN neuron. In agreement with the eIPSC results, oCRF elevated mIPSC amplitude by 17% in the 5-HT but not the non-5-HT neuron. This effect is further illustrated as a significant shift to the right of the cumulative probability graph of amplitude for the 5-HT (Fig. 3A′) (Z = 1.70; p < 0.01) but not the non-5-HT neuron (Fig. 3B′) (Z = 0.89; NS). UCN II effects were recorded in 16 5-HT neurons recorded from 15 subjects and in 14 non-5-HT neurons recorded from 11 subjects. Figure 3, C and D, are mIPSC traces averaged from 200 events before (control) and at the maximal steady-state effect of UCN II in a 5-HT-containing (C) and a non-5-HT-containing DRN neuron (D). UCN II elevated mIPSC amplitude by 21% in the 5-HT but not the non-5-HT neuron. This effect is further illustrated as a significant shift to the right of the cumulative probability plot of amplitude for the 5-HT (Fig. 3C′) (Z = 2.46; p < 0.01) but not the non-5-HT neuron (Fig. 3D′) (Z = 1.26; NS). The data for all of the cells recorded with oCRF and UCN II are summarized in Table 1. The increase in amplitude produced by oCRF and UCN II in 5-HT-containing neurons was significant (p < 0.01) as shown in Table 1. In contrast, there was no significant change in mIPSC amplitude in non-5-HT-containing neurons.
Figure 3.
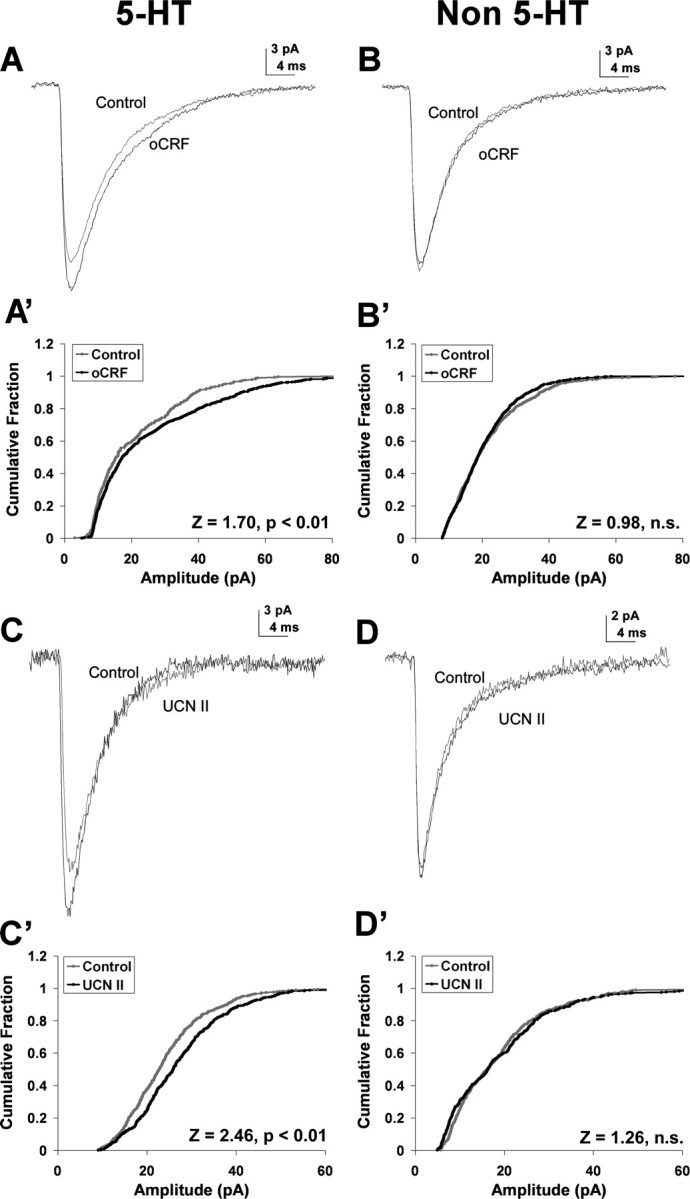
Ovine CRF and UCN II enhanced GABAergic mIPSC amplitude selectively in 5-HT DRN neurons. A and B show averaged mIPSCs (from 200 events) recorded in a 5-HT (A) and non-5-HT (B) cell: the gray line represents mIPSCs before and the black line represents mIPSCs after oCRF administration. Ovine CRF (10 nm) increased mIPSC amplitude from 19.9 to 23.3 pA in the 5-HT cell but had no effect in the non-5-HT cell. The cumulative probability plot of amplitude was shifted to the right by oCRF administration for the 5-HT cell (A′) (Kolmogorov–Smirnov test, p < 0.01) but not for the non-5-HT cell (B′). C and D show averaged mIPSCs (from 200 events) recorded in a 5-HT (C) and non-5-HT (D) cell: the gray line represents mIPSCs before and the black line represents mIPSCs after UCN II administration. UCN II (10 nm) increased mIPSC amplitude from 24 to 27 pA in the 5-HT cell but had no effect in the non-5-HT cell. The cumulative probability graph of amplitude was shifted to the right by UCN II administration for the 5-HT cell (C′) (Kolmogorov–Smirnov test, p < 0.01) but not for the non-5-HT cell (D′).
A correlation analysis was performed to determine whether the presynaptic and postsynaptic actions of CRF agonists were observed in the same cells. There was a significant positive correlation between oCRF effects on mIPSC frequency and amplitude in individual 5-HT DRN neurons (r = 0.59; p < 0.01). Although UCN II did not have a significant effect on mIPSC frequency, there was a significant positive correlation between UCN II effects on mIPSC frequency and amplitude (r = 0.80; p < 0.01).
Ovine CRF and UCN II have direct postsynaptic effects on 5-HT neurons
Ovine CRF and UCN II effects on inward current were examined in 5-HT and non-5-HT DRN neurons (Fig. 4). Figure 4A shows oCRF (100 nm) increasing the inward current by 15 pA in a 5-HT DRN neuron from an initial holding current of −9 pA to a maximal steady-state effect of oCRF at −24 pA. Ovine CRF (10 nm) significantly increased inward current by 7–10 pA in both 5-HT and non-5-HT neurons (p < 0.01), as shown in Table 1 and Figure 4B. Figure 4B further shows that the effect in 5-HT neurons is dose-dependent with a higher 100 nm dose producing an increase of inward current (p < 0.05) of greater magnitude. Whereas oCRF produced an inward current in all DRN cells, UCN II was more selective, significantly increasing inward current in 5-HT (p < 0.01) but not non-5-HT neurons (Table 1). This is further illustrated in Figure 4C because UCN II produced a 10 pA mean inward current in 5-HT neurons (p < 0.01) compared with a 3 pA inward current in non-5-HT neurons (NS).
Figure 4.
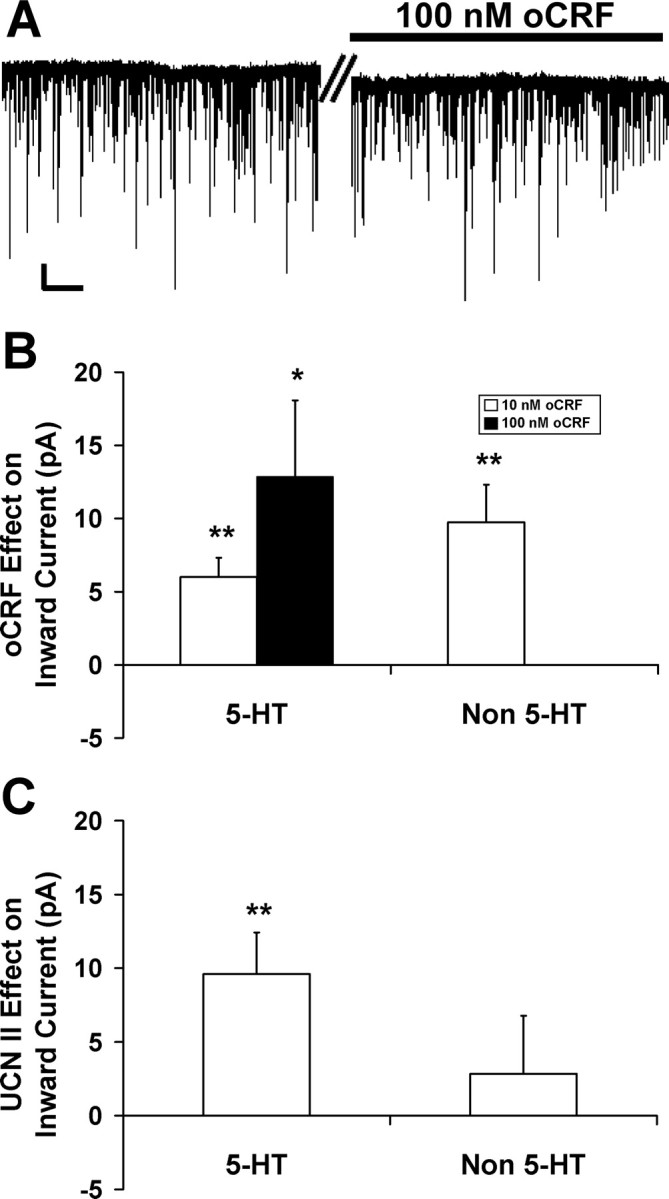
Ovine CRF and UCN II enhanced inward current in DRN neurons. A shows that 100 nm oCRF increased the inward current by 15 pA in a 5-HT DRN neuron from an initial holding current of −9 pA to a maximum of −24 pA. B shows that oCRF dose-dependently increased mean inward current in 5-HT neurons (10 nm: 7 pA, N = 26; 100 nm: 13 pA, N = 12), and 10 nm oCRF also increased mean inward current in non-5-HT neurons (10 pA; N = 13). In contrast, UCN II (10 nm) only increased inward current in 5-HT-containing neurons. C shows that UCN II significantly increased mean inward current by 10 pA in 5-HT-containing neurons (N = 16) compared with 3 pA in non-5-HT cells (N = 14). In A, the time break (double bar) represents 2 min. Calibration: vertical, 20 pA; horizontal, 10 s. The asterisks indicate a significant inward current (*p < 0.05; **p < 0.01). Data are expressed as mean ± SEM.
Ovine CRF and UCN II alter GABA receptor kinetics: increasing mIPSC fast decay time in 5-HT DRN neurons
Ovine CRF and UCN II effects on mIPSC fast decay time were examined in 5-HT and non-5-HT DRN neurons (Table 1). Both ligands produced a similar significant (p < 0.05) increase in fast decay in 5-HT neurons (see examples in Fig. 3A,C) but not in non-5-HT neurons (see examples in Fig. 3B,D). Rise time as well as the slow component of the mIPSC decay time were unaffected by any drug treatments in 5-HT and non-5-HT DRN neurons (Table 1).
CRF-R1 and CRF-R2 antagonists selectively block the effects of oCRF
Ovine CRF effects on GABA synaptic activity [mIPSC frequency (Fig. 5A), amplitude (Fig. 5B)], and inward current (Fig. 5C) were examined in the presence of the CRF-R1-selective antagonist antalarmin (300 nm) or the CRF-R2-selective antagonist ASVG-30 (100 nm) in 5-HT DRN neurons (Fig. 5). Antagonist effects were also examined on mIPSC rise and decay times (Table 1). These concentrations of antagonist were ∼100 times their affinity for their respective receptors (Webster et al., 1996; Rühmann et al., 1998; Higelin et al., 2001). Antalarmin effects were examined in 20 5-HT neurons recorded from 13 subjects; ASVG-30 effects were examined in 17 5-HT neurons recorded from 15 subjects.
In the absence of an antagonist, oCRF significantly elevated mIPSC frequency (Fig. 5A, Table 1) (p < 0.01), amplitude (Fig. 5B, Table 1) (p < 0.01), fast decay time (Table 1) (p < 0.05), and inward current (Fig. 5C, Table 1) (p < 0.01). Table 1 shows that antalarmin blocked the effect of oCRF on mIPSC frequency, amplitude, and fast decay time, but not on inward current [χ2(2) = 18.9; p < 0.01]. ASVG-30 blocked the oCRF effect on mIPSC amplitude, fast decay time, and inward current, but not on mIPSC frequency [χ2(2) = 8.94; p < 0.05]. The data are presented in a different manner as percentage change from baseline in Figure 5. Antalarmin blocked the effect of oCRF on mIPSC frequency (Fig. 5A) [significant main effect of antalarmin: F(1,44) = 5.47, p < 0.05; and significant interaction of antalarmin by oCRF: F(1,44) = 4.40, p < 0.05; post hoc comparisons show oCRF significantly elevated mIPSC frequency in the absence (p < 0.05) but not the presence of antalarmin, and the effect of oCRF was significantly reduced in the presence of antalarmin compared with its effect in the presence of ACSF (p < 0.05)]. However, antalarmin did not block the effect of oCRF on inward current (Fig. 5C) (significant main effects of antalarmin: F(1,44) = 10.08, p < 0.01; oCRF: F(1,44) = 8.24, p < 0.01; but no interaction between these factors). In contrast to antalarmin, ASVG-30 blocked the effect of oCRF on inward current (Fig. 5C) [significant interaction of ASVG-30 by oCRF: F(1,41) = 5.73, p < 0.05; post hoc comparisons show that oCRF significantly elevated inward current in the absence (p < 0.05) but not the presence of ASVG-30 and the effect of oCRF was significantly reduced in the presence of ASVG-30 compared with its effect in the presence of ACSF (p < 0.05)]. However, ASVG-30 did not block the effect of oCRF on mIPSC frequency (Fig. 5A) (no significant interaction between ASVG-30 and oCRF). While in the presence of ACSF, oCRF significantly elevated mIPSC amplitude (p < 0.05), and in the presence of either antagonist, oCRF was unable to significantly elevate mIPSC amplitude above its baseline, indicating that both antagonists block this effect as well (Fig. 5B) (significant interaction of antalarmin by oCRF, F(1,44) = 5.90, p < 0.05; significant interaction of ASVG-30 by oCRF, F(1,41) = 7.72, p < 0.01). Based on these data, we conclude that the actions of oCRF on mIPSC frequency are mediated by CRF-R1, the actions on mIPSC amplitude and decay time by both CRF-R1 and CRF-R2, and the actions on inward current by CRF-R2.
Interestingly, we found that both antagonists had intrinsic effects indicating the possibility that these antagonists had partial agonist activity (see Discussion) (Fig. 5, Table 1). Both antalarmin and ASVG-30 increased mIPSC amplitude (Fig. 5B) (p < 0.05 by post hoc Student–Newman–Keuls test) (Table 1) (ANOVA, antalarmin: F(2,38) = 8.29, p < 0.01; ASVG-30: F(2,32) = 9.18, p < 0.01; p < 0.05 by post hoc Student–Newman–Keuls test). Antalarmin increased mIPSC fast decay time (Table 1) (ANOVA: F(2,35) = 6.48, p < 0.01; p < 0.05 by post hoc Student–Newman–Keuls test). Antalarmin also had an effect on inward current (Table 1) (χ2(2) = 18.9, p < 0.01; p < 0.05 by post hoc Student–Newman–Keuls test). The one significant effect produced by oCRF in non-5-HT neurons was an increase in inward current (Table 1) (p < 0.01). In contrast to what was found in 5-HT neurons in which the increase in inward current was blocked by ASVG-30 and also produced by UCN II, this effect in non-5-HT neurons was blocked by antalarmin (F(2,10) = 0.97; NS) and not produced by UCN II, indicating that the effect is mediated by CRF-R1 receptors.
Discussion
CRF, a neuromodulator, regulates stress-induced behaviors through participation in neural circuitries that are still being defined. Our data provide important new information regarding the effects of CRF in the DRN. We conclude, based on our data, that CRF modulates 5-HT DRN neurons in a direct as well as indirect manner on GABAergic synaptic activity and that it does so via different CRF receptor subtypes. Whereas CRF effects on presynaptic GABA release were mediated by CRF-R1, its direct postsynaptic effects on inward current were mediated by CRF-R2 and on GABA receptors were mediated by both receptor subtypes. In contrast, CRF induced inward current by CRF-R1 receptor activation in non-5-HT neurons. The selectivity of CRF effects further suggest that there are distinct GABAergic afferents targeting different neurochemical populations of DRN neurons and that these afferents are differentially responsive to CRF.
Direct effects of CRF on DRN neurons
Ovine CRF induced an increase in inward current in DRN neurons. Interestingly, this effect was mediated by different CRF receptor subtypes on different neurochemical populations (i.e., 5-HT neurons by the CRF-R2 receptor and non-5-HT neurons by the CRF-R1 receptor). In support of our findings, anatomical data show CRF-R2 receptors at midlevels of the DRN located almost exclusively on 5-HT neurons (Day et al., 2004), the same area in which we recorded. Unfortunately, the neurochemical identity of the non-5-HT neurons is unknown. Approximately one-half of DRN neurons are non-5-HT (Steinbusch et al., 1980; Descarries et al., 1982; Köhler and Steinbusch, 1982; Jacobs and Azmitia, 1992; Baumgarten and Grozdanovic, 1997). One prominent population of non-5-HT DRN neurons is GABAergic (Allers and Sharp, 2001, 2003). These GABA neurons express CRF-R1 receptors (Roche et al., 2003). If at least some of the recorded non-5-HT neurons were GABAergic, our data indicate that postsynaptic CRF-R1 receptors increase inward current in GABA neurons.
Presynaptic effects of oCRF on GABA synaptic activity
Converging evidence from both spontaneous and evoked IPSC experiments indicate that oCRF elevated presynaptic GABA release at 5-HT DRN neurons. Ovine CRF increased mIPSC frequency, indicating enhanced probability of GABA release from presynaptic terminals. There was large variance in mean basal mIPSC frequency of 5-HT neurons in different drug experiments (Table 1). The lack of drug-induced increases of mIPSC frequency in the antalarmin and UCN II experiments could theoretically be produced by a “ceiling effect” attributable to their higher basal mIPSC frequencies. However, linear regression analysis, both within and between groups, showed that there was no relationship between basal mIPSC frequency and subsequent oCRF or UCN II response, making this interpretation unlikely. An additional indication of enhanced presynaptic neurotransmitter release (Zucker, 1989; Dobrunz and Stevens, 1997; Melis et al., 2002) was that oCRF also increased eIPSC amplitude while decreasing eIPSC PPR.
An increase in GABA release by CRF-R1 presynaptic receptor activation would lead to a decrease in DRN neuronal activity, an effect that is consistent with previous studies. In vivo studies show that certain stressors inhibit 5-HT release via endogenous CRF (Price et al., 2002) and activation of CRF-R1 by low doses of oCRF inhibits 5-HT DRN neuronal activity (Kirby et al., 2000) and 5-HT release (Price et al., 1998; Price and Lucki, 2001). Ultrastructural studies show greater contacts of CRF terminals with GABA-labeled than with 5-HT-labeled dendrites and also CRF terminals in contact with GABA terminals (Waselus et al., 2005). Functional neuroanatomy studies using c-fos demonstrate that swim stress engages a population of CRF-R1 receptor-expressing GABAergic DRN neurons (Roche et al., 2003). Our data provide electrophysiological evidence for this circuitry at a single-cell level: CRF-R1 activation elevates presynaptic GABA release at 5-HT DRN neurons and increases inward current in non-5-HT putative GABA neurons.
Postsynaptic effects of oCRF on GABA synaptic activity
In addition to increasing the release of GABA onto 5-HT DRN neurons, oCRF increased mIPSC amplitude and fast decay time, indicating an increase in the sensitivity, number, or open time of the activated GABAA receptor-ionophore. These effects were mediated by both CRF-R1 and CRF-R2 subtypes. A correlation analysis demonstrated that the presynaptic and postsynaptic actions of CRF agonists were observed in the same cells. Potentially, if mIPSC amplitude is increased, it is more likely to be detected above noise levels, thus artificially elevating mIPSC frequency. However, noise histograms and amplitude histograms were clearly separated for each recorded cell, and presynaptic and postsynaptic effects were mediated by different receptor subtypes, making this technical argument unlikely. For example, ASVG-30 blocked oCRF-induced elevation of mIPSC amplitude but spared the oCRF effect on mIPSC frequency in the same cell population. Another potential interpretation is that CRF agonist-induced elevations of mIPSC amplitude reflect an increase in neurotransmitter release, driven by the changes in mIPSC frequency (Behrends and ten Bruggencate, 1998). This would not explain the CRF-R2-mediated increase in amplitude, but we cannot rule out this possibility for the CRF-R1 receptor-mediated actions. Nonetheless, the net effect of either increased postsynaptic receptor sensitivity or increased neurotransmitter release would enhance GABAergic inhibition of the postsynaptic neuron. Therefore, our interpretation of mIPSC frequency and amplitude data are that oCRF enhanced GABAergic inhibition of the target 5-HT DRN neuron by multiple mechanisms. These data agree with studies conducted in other brain regions demonstrating that CRF enhances GABAergic synaptic activity at the presynaptic or postsynaptic level and is mediated by different CRF receptors (Nie et al., 2004; Kash and Winder, 2006). In sum, an emerging theme is that CRF enhances GABA synaptic transmission by different CRF receptor subtypes acting at presynaptic or postsynaptic sites, often in the same cell.
Intrinsic antagonist effects
Both CRF receptor antagonists had intrinsic effects on several physiological measures in this preparation. Antalarmin increased mIPSC amplitude, mIPSC fast decay time, and inward current, whereas ASVG-30 increased mIPSC amplitude. These intrinsic effects indicate that the antagonists may have partial agonist activity. Minimal partial agonist activity has been reported for these antagonists in other preparations (Rühmann et al., 1998; Lawrence et al., 2002).
Neurochemical selectivity of oCRF effects
All of the effects of oCRF on GABAergic synaptic activity occurred selectively in recordings from 5-HT, and not non-5-HT, DRN neurons. These data indicate that select GABA afferents target distinct neurochemical populations of DRN neurons and these select afferents are differentially responsive to oCRF. This finding complements recent data from our laboratory demonstrating distinct glutamatergic afferents to neurochemically distinct populations of DRN neurons that are also differentially responsive to stress (Kirby et al., 2007). Therefore, the anatomical design of the DRN enables stressors and stress hormones to selectively modulate distinct populations of DRN neurons via both excitatory and inhibitory afferents. This arrangement may contribute to the complex stressor-specific and region-specific responses of the 5-HT system to stress (Kirby et al., 1995, 1997; Adell et al., 1997).
Functional implications
These data provide functional evidence for the cellular mechanisms and circuitry underlying the interactions between the stress neurohormone CRF and the 5-HT system. Previous studies characterizing oCRF effects on 5-HT neurotransmission in vivo indicated a U-shaped dose–response curve for oCRF: inhibiting 5-HT neuronal activity and release at low doses, stimulating 5-HT neuronal activity and release at higher doses (Price et al., 1998; Kirby et al., 2000; Price and Lucki, 2001). Because oCRF is eight times more potent at CRF-R1 than CRF-R2 receptors (Lovenberg et al., 1995), low doses act primarily at CRF-R1 receptors, whereas higher doses activate CRF-R2 receptors. Our data support a model (Fig. 6) whereby activation of CRF-R1 receptors by low doses of oCRF stimulates presynaptic GABA release and enhances postsynaptic GABA receptor sensitivity at 5-HT neurons, indirectly inhibiting their activity and 5-HT release. Higher doses of oCRF activate CRF-R2 receptors on 5-HT neurons, resulting in their depolarization, increased activity and release of 5-HT. This model is supported by our finding that CRF-R1 receptor-mediated increases in presynaptic GABA release are observed maximally at the lower dose of oCRF tested, whereas the CRF-R2-receptor-mediated inward current is dose dependent, with the greatest effect produced by the higher dose of oCRF tested. Additional support for this model comes from studies of the CRF-R2-selective agonist urocortin II, which, at higher doses, activates 5-HT DRN neuronal activity (Pernar et al., 2004) and 5-HT release in terminal fields (Amat et al., 2004). Previous studies identified inhibitory actions of particular stressors on the 5-HT system (Kirby et al., 1995, 1997; Adell et al., 1997) that were mediated by CRF (Price et al., 2002). In this way, particular stressors initiate the release of CRF in the DRN that stimulates both presynaptic GABA release and postsynaptic GABA receptor sensitivity on 5-HT DRN neurons, resulting in inhibition of 5-HT neuronal activity and forebrain 5-HT release. This raphe circuitry provides a framework for understanding how exposure to stress can lead to 5-HT dysfunction, potentially contributing to stress-related psychopathology such as anxiety and depression. The findings from our studies add important information to the understanding of the complex neural circuitries underlying stress regulation and stress-mediated mood disorders. Novel compounds directed at the CRF or GABA receptors identified to be key within this neural circuitry may be useful in the treatment of mood and anxiety disorders.
Figure 6.

Model of CRF actions in the DRN. This schematic models the effects of low and high doses of CRF on 5-HT, non-5-HT, and GABA neurons in the DRN. At 5-HT neurons, low doses of CRF activate CRF-R1 receptors, enhancing presynaptic GABA release and postsynaptic GABA receptor sensitivity, which result in the net inhibition of 5-HT neurons. High doses of CRF act also at CRF-R2 receptors on 5-HT neurons, resulting in the net excitation of 5-HT neurons. CRF also increases the excitability of non-5-HT neurons via CRF-R1 receptors.
Footnotes
This work was supported by a Young Investigator Award from the National Alliance for Research on Schizophrenia and Depression, National Institute of Mental Health Grant MH 63301, and National Institute on Drug Abuse Grant DA 20126 (L.G.K.), and by National Institute of Mental Health Grant MH 60773 and Office of Naval Research Grant N00014-03-1-0311 (S.G.B.). We thank Dr. Jean Rivier of the Clayton Foundation Laboratories for Peptide Biology at The Salk Institute (La Jolla, CA) for his generous donations of oCRF and UCN II for use in these studies. We thank Dr. Yu-Zhen Pan for her technical assistance and contributions to electrophysiological studies. We also thank Dr. Rita Valentino (Division of Stress Neurobiology, Children's Hospital of Philadelphia, Philadelphia, PA) for her valuable input and advice for this project and all of our previous studies with CRF.
References
- Adell A, Casanovas JM, Artigas F. Comparative study in the rat of the actions of different types of stress on the release of 5-HT in raphe nuclei and forebrain areas. Neuropharmacology. 1997;36:735–741. doi: 10.1016/s0028-3908(97)00048-8. [DOI] [PubMed] [Google Scholar]
- Allers KA, Sharp T. Identification of 5-HT containing neurones in the dorsal raphe nucleus (DRN) using juxtacellular labeling methods in vivo. Soc Neurosci Abstr. 2001;27:806–13. [Google Scholar]
- Allers KA, Sharp T. Neurochemical and anatomical identification of fast- and slow-firing neurones in the rat dorsal raphe nucleus using juxtacellular labelling methods in vivo. Neuroscience. 2003;122:193–204. doi: 10.1016/s0306-4522(03)00518-9. [DOI] [PubMed] [Google Scholar]
- Amat J, Tamblyn JP, Paul ED, Bland ST, Amat P, Foster AC, Watkins LR, Maier SF. Microinjection of urocortin 2 into the dorsal raphe nucleus activates serotonergic neurons and increases extracellular serotonin in the basolateral amygdala. Neuroscience. 2004;129:509–519. doi: 10.1016/j.neuroscience.2004.07.052. [DOI] [PubMed] [Google Scholar]
- Arborelius L, Owens MJ, Plotsky PM, Nemeroff CB. The role of corticotropin-releasing factor in depression and anxiety disorders. J Endocrinol. 1999;160:1–12. doi: 10.1677/joe.0.1600001. [DOI] [PubMed] [Google Scholar]
- Baumgarten GG, Grozdanovic Z. Anatomy of central serotonergic projection systems. In: Baumgarten HG, Gothert M, editors. Serotonergic neurons and 5-HT receptors in the central nervous system. Berlin: Springer; 1997. pp. 41–89. [Google Scholar]
- Beck SG, Pan YZ, Akanwa AC, Kirby LG. Median and dorsal raphe neurons are not electrophysiologically identical. J Neurophysiol. 2004;91:994–1005. doi: 10.1152/jn.00744.2003. [DOI] [PMC free article] [PubMed] [Google Scholar]
- Behrends JC, ten Bruggencate G. Changes in quantal size distributions upon experimental variations in the probability of release at striatal inhibitory synapses. J Neurophysiol. 1998;79:2999–3011. doi: 10.1152/jn.1998.79.6.2999. [DOI] [PubMed] [Google Scholar]
- Chalmers DT, Lovenberg TW, De Souza EB. Localization of novel corticotropin-releasing factor receptor (CRF2) mRNA expression to specific subcortical nuclei in rat brain: comparison with CRF1 receptor mRNA expression. J Neurosci. 1995;15:6340–6350. doi: 10.1523/JNEUROSCI.15-10-06340.1995. [DOI] [PMC free article] [PubMed] [Google Scholar]
- Charney DS, Krystal JH, Delgado PL, Heninger GR. Serotonin-specific drugs for anxiety and depressive disorders. Annu Rev Med. 1990a;41:437–446. doi: 10.1146/annurev.me.41.020190.002253. [DOI] [PubMed] [Google Scholar]
- Charney DS, Woods SW, Krystal JH, Heninger GR. Serotonin function and human anxiety disorders. Ann N Y Acad Sci. 1990b;600:558–572. doi: 10.1111/j.1749-6632.1990.tb16910.x. discussion 572–573. [DOI] [PubMed] [Google Scholar]
- Day HE, Greenwood BN, Hammack SE, Watkins LR, Fleshner M, Maier SF, Campeau S. Differential expression of 5HT-1A, alpha 1b adrenergic, CRF-R1, and CRF-R2 receptor mRNA in serotonergic, gamma-aminobutyric acidergic, and catecholaminergic cells of the rat dorsal raphe nucleus. J Comp Neurol. 2004;474:364–378. doi: 10.1002/cne.20138. [DOI] [PMC free article] [PubMed] [Google Scholar]
- Descarries L, Watkins KC, Garcia S, Beaudet A. The serotonin neurons in nucleus raphe dorsalis of adult rat: a light and electron microscope radioautographic study. J Comp Neurol. 1982;207:239–254. doi: 10.1002/cne.902070305. [DOI] [PubMed] [Google Scholar]
- De Souza EB, Insel TR, Perrin MH, Rivier J, Vale WW, Kuhar MJ. Corticotropin-releasing factor receptors are widely distributed within the rat central nervous system: an autoradiographic study. J Neurosci. 1985;5:3189–3203. doi: 10.1523/JNEUROSCI.05-12-03189.1985. [DOI] [PMC free article] [PubMed] [Google Scholar]
- Dobrunz LE, Stevens CF. Heterogeneity of release probability, facilitation, and depletion at central synapses. Neuron. 1997;18:995–1008. doi: 10.1016/s0896-6273(00)80338-4. [DOI] [PubMed] [Google Scholar]
- Gold PW, Licinio J, Wong ML, Chrousos GP. Corticotropin releasing hormone in the pathophysiology of melancholic and atypical depression and in the mechanism of action of antidepressant drugs. Ann N Y Acad Sci. 1995;771:716–729. doi: 10.1111/j.1749-6632.1995.tb44723.x. [DOI] [PubMed] [Google Scholar]
- Higelin J, Py-Lang G, Paternoster C, Ellis GJ, Patel A, Dautzenberg FM. 125I-Antisauvagine-30: a novel and specific high-affinity radioligand for the characterization of corticotropin-releasing factor type 2 receptors. Neuropharmacology. 2001;40:114–122. doi: 10.1016/s0028-3908(00)00105-2. [DOI] [PubMed] [Google Scholar]
- Jacobs BL, Azmitia EC. Structure and function of the brain serotonin system. Physiol Rev. 1992;72:165–229. doi: 10.1152/physrev.1992.72.1.165. [DOI] [PubMed] [Google Scholar]
- Jedema HP, Grace AA. Corticotropin-releasing hormone directly activates noradrenergic neurons of the locus ceruleus recorded in vitro. J Neurosci. 2004;24:9703–9713. doi: 10.1523/JNEUROSCI.2830-04.2004. [DOI] [PMC free article] [PubMed] [Google Scholar]
- Kash TL, Winder DG. Neuropeptide Y and corticotropin-releasing factor bi-directionally modulate inhibitory synaptic transmission in the bed nucleus of the stria terminalis. Neuropharmacology. 2006;51:1013–1022. doi: 10.1016/j.neuropharm.2006.06.011. [DOI] [PubMed] [Google Scholar]
- Kirby LG, Allen AR, Lucki I. Regional differences in the effects of forced swimming on extracellular levels of 5-hydroxytryptamine and 5-hydroxyindoleacetic acid. Brain Res. 1995;682:189–196. doi: 10.1016/0006-8993(95)00349-u. [DOI] [PubMed] [Google Scholar]
- Kirby LG, Chou-Green JM, Davis K, Lucki I. The effects of different stressors on extracellular 5-hydroxytryptamine and 5-hydroxyindoleacetic acid. Brain Res. 1997;760:218–230. doi: 10.1016/s0006-8993(97)00287-4. [DOI] [PubMed] [Google Scholar]
- Kirby LG, Rice KC, Valentino RJ. Effects of corticotropin-releasing factor on neuronal activity in the serotonergic dorsal raphe nucleus. Neuropsychopharmacology. 2000;22:148–162. doi: 10.1016/S0893-133X(99)00093-7. [DOI] [PubMed] [Google Scholar]
- Kirby LG, Cryan JF, Page ME, Bello NT, Kung M-P, Kung HF, Lucki I, Valentino RJ. Substantial reduction in corticotropin-releasing factor (CRF) binding sites in the dorsal raphe nucleus (DRN) of rats administered 5,7-dihydroxytryptamine (5,7-DHT) Soc Neurosci Abstr. 2001;27:414–9. [Google Scholar]
- Kirby LG, Pan YZ, Freeman-Daniels E, Rani S, Nunan JD, Akanwa A, Beck SG. Cellular effects of swim stress in the dorsal raphe nucleus. Psychoneuroendocrinology. 2007;32:712–723. doi: 10.1016/j.psyneuen.2007.05.001. [DOI] [PMC free article] [PubMed] [Google Scholar]
- Köhler C, Steinbusch H. Identification of serotonin and non-serotonin-containing neurons of the mid-brain raphe projecting to the entorhinal area and the hippocampal formation. A combined immunohistochemical and fluorescent retrograde tracing study in the rat brain. Neuroscience. 1982;7:951–975. doi: 10.1016/0306-4522(82)90054-9. [DOI] [PubMed] [Google Scholar]
- Lawrence AJ, Krstew EV, Dautzenberg FM, Rühmann A. The highly selective CRF(2) receptor antagonist K41498 binds to presynaptic CRF(2) receptors in rat brain. Br J Pharmacol. 2002;136:896–904. doi: 10.1038/sj.bjp.0704783. [DOI] [PMC free article] [PubMed] [Google Scholar]
- Liu J, Yu B, Neugebauer V, Grigoriadis DE, Rivier J, Vale WW, Shinnick-Gallagher P, Gallagher JP. Corticotropin-releasing factor and Urocortin I modulate excitatory glutamatergic synaptic transmission. J Neurosci. 2004;24:4020–4029. doi: 10.1523/JNEUROSCI.5531-03.2004. [DOI] [PMC free article] [PubMed] [Google Scholar]
- Lovenberg TW, Liaw CW, Grigoriadis DE, Clevenger W, Chalmers DT, De Souza EB, Oltersdorf T. Cloning and characterization of a functionally distinct corticotropin-releasing factor receptor subtype from rat brain. Proc Natl Acad Sci U S A. 1995;92:836–840. doi: 10.1073/pnas.92.3.836. [DOI] [PMC free article] [PubMed] [Google Scholar]
- Melis M, Camarini R, Ungless MA, Bonci A. Long-lasting potentiation of GABAergic synapses in dopamine neurons after a single in vivo ethanol exposure. J Neurosci. 2002;22:2074–2082. doi: 10.1523/JNEUROSCI.22-06-02074.2002. [DOI] [PMC free article] [PubMed] [Google Scholar]
- Meltzer HY. Role of serotonin in depression. Ann N Y Acad Sci. 1990;600:486–499. doi: 10.1111/j.1749-6632.1990.tb16904.x. discussion 499–500. [DOI] [PubMed] [Google Scholar]
- Nemeroff CB. The role of corticotropin-releasing factor in the pathogenesis of major depression. Pharmacopsychiatry. 1988;21:76–82. doi: 10.1055/s-2007-1014652. [DOI] [PubMed] [Google Scholar]
- Nie Z, Schweitzer P, Roberts AJ, Madamba SG, Moore SD, Siggins GR. Ethanol augments GABAergic transmission in the central amygdala via CRF1 receptors. Science. 2004;303:1512–1514. doi: 10.1126/science.1092550. [DOI] [PubMed] [Google Scholar]
- Paxinos G, Watson C. The rat brain in stereotaxic coordinates. New York: Academic; 1998. [DOI] [PubMed] [Google Scholar]
- Pernar L, Curtis AL, Vale WW, Rivier JE, Valentino RJ. Selective activation of corticotropin-releasing factor-2 receptors on neurochemically identified neurons in the rat dorsal raphe nucleus reveals dual actions. J Neurosci. 2004;24:1305–1311. doi: 10.1523/JNEUROSCI.2885-03.2004. [DOI] [PMC free article] [PubMed] [Google Scholar]
- Potter E, Sutton S, Donaldson C, Chen R, Perrin M, Lewis K, Sawchenko PE, Vale W. Distribution of corticotropin-releasing factor receptor mRNA expression in the rat brain and pituitary. Proc Natl Acad Sci U S A. 1994;91:8777–8781. doi: 10.1073/pnas.91.19.8777. [DOI] [PMC free article] [PubMed] [Google Scholar]
- Price ML, Lucki I. Regulation of serotonin release in the lateral septum and striatum by corticotropin-releasing factor. J Neurosci. 2001;21:2833–2841. doi: 10.1523/JNEUROSCI.21-08-02833.2001. [DOI] [PMC free article] [PubMed] [Google Scholar]
- Price ML, Curtis AL, Kirby LG, Valentino RJ, Lucki I. Effects of corticotropin-releasing factor on brain serotonergic activity. Neuropsychopharmacology. 1998;18:492–502. doi: 10.1016/S0893-133X(97)00197-8. [DOI] [PubMed] [Google Scholar]
- Price ML, Kirby LG, Valentino RJ, Lucki I. Evidence for corticotropin-releasing factor regulation of serotonin in the lateral septum during acute swim stress: adaptation produced by repeated swimming. Psychopharmacology (Berl) 2002;162:406–414. doi: 10.1007/s00213-002-1114-2. [DOI] [PubMed] [Google Scholar]
- Rainnie DG, Fernhout BJ, Shinnick-Gallagher P. Differential actions of corticotropin releasing factor on basolateral and central amygdaloid neurones, in vitro. J Pharmacol Exp Ther. 1992;263:846–858. [PubMed] [Google Scholar]
- Reul JM, Holsboer F. Corticotropin-releasing factor receptors 1 and 2 in anxiety and depression. Curr Opin Pharmacol. 2002;2:23–33. doi: 10.1016/s1471-4892(01)00117-5. [DOI] [PubMed] [Google Scholar]
- Roche M, Commons KG, Peoples A, Valentino RJ. Circuitry underlying regulation of the serotonergic system by swim stress. J Neurosci. 2003;23:970–977. doi: 10.1523/JNEUROSCI.23-03-00970.2003. [DOI] [PMC free article] [PubMed] [Google Scholar]
- Rühmann A, Bonk I, Lin CR, Rosenfeld MG, Spiess J. Structural requirements for peptidic antagonists of the corticotropin-releasing factor receptor (CRFR): development of CRFR2beta-selective antisauvagine-30. Proc Natl Acad Sci U S A. 1998;95:15264–15269. doi: 10.1073/pnas.95.26.15264. [DOI] [PMC free article] [PubMed] [Google Scholar]
- Steinbusch HW, van der Kooy D, Verhofstad AA, Pellegrino A. Serotonergic and non-serotonergic projections from the nucleus raphe dorsalis to the caudate-putamen complex in the rat, studied by a combined immunofluorescence and fluorescent retrograde axonal labeling technique. Neurosci Lett. 1980;19:137–142. doi: 10.1016/0304-3940(80)90184-6. [DOI] [PubMed] [Google Scholar]
- Tan H, Zhong P, Yan Z. Corticotropin-releasing factor and acute stress prolongs serotonergic regulation of GABA transmission in prefrontal cortical pyramidal neurons. J Neurosci. 2004;24:5000–5008. doi: 10.1523/JNEUROSCI.0143-04.2004. [DOI] [PMC free article] [PubMed] [Google Scholar]
- Ugolini A, Sokal DM, Arban R, Large CH. CRF1 receptor activation increases the response of neurons in the basolateral nucleus of the amygdala to afferent stimulation. Front Behav Neurosci. 2008;2:2. doi: 10.3389/neuro.08.002.2008. [DOI] [PMC free article] [PubMed] [Google Scholar]
- Ungless MA, Singh V, Crowder TL, Yaka R, Ron D, Bonci A. Corticotropin-releasing factor requires CRF binding protein to potentiate NMDA receptors via CRF receptor 2 in dopamine neurons. Neuron. 2003;39:401–407. doi: 10.1016/s0896-6273(03)00461-6. [DOI] [PubMed] [Google Scholar]
- Waselus M, Valentino RJ, Van Bockstaele EJ. Ultrastructural evidence for a role of gamma-aminobutyric acid in mediating the effects of corticotropin-releasing factor on the rat dorsal raphe serotonin system. J Comp Neurol. 2005;482:155–165. doi: 10.1002/cne.20360. [DOI] [PubMed] [Google Scholar]
- Webster EL, Lewis DB, Torpy DJ, Zachman EK, Rice KC, Chrousos GP. In vivo and in vitro characterization of antalarmin, a nonpeptide corticotropin-releasing hormone (CRH) receptor antagonist: suppression of pituitary ACTH release and peripheral inflammation. Endocrinology. 1996;137:5747–5750. doi: 10.1210/endo.137.12.8940412. [DOI] [PubMed] [Google Scholar]
- Zucker RS. Short-term synaptic plasticity. Annu Rev Neurosci. 1989;12:13–31. doi: 10.1146/annurev.ne.12.030189.000305. [DOI] [PubMed] [Google Scholar]