Abstract
The Mouse Cochlea Database (MCD) provides an interactive, image database of the mouse cochlea for learning its anatomy and data mining of its resources. The MCD website is hosted on a centrally maintained, high-speed server at the following URL: http://mousecochlea.umn.edu. The MCD contains two types of image resources, serial 2D image stacks and 3D reconstructions of cochlear structures. Complete image stacks of the cochlea from two different mouse strains were obtained using Orthogonal Plane Fluorescence Optical Microscopy (OPFOS). 2D images of the cochlea are presented on the MCD website as: viewable images within a stack, 2D atlas of the cochlea, orthogonal sections, and direct volume renderings combined with isosurface reconstructions. In order to assess cochlear structures quantitatively, “true” cross sections of the scala media along the length of the basilar membrane were generated by virtual resectioning of a cochlea orthogonal to a cochlear structure, such as the centroid of the basilar membrane or the scala media. 3D images are presented on the MCD website as: direct volume renderings, movies, interactive QuickTime VRs, flythrough, and isosurface 3D reconstructions of different cochlear structures. 3D computer models can also be used for solid model fabrication by rapid prototyping and models from different cochleas can be combined to produce an average 3D model. The MCD is the first comprehensive image resource on the mouse cochlea and is a new paradigm for understanding the anatomy of the cochlea, and establishing morphometric parameters of cochlear structures in normal and mutant mice.
Keywords: mice, cochlea, atlas, 3D Reconstruction, OPFOS
1. Introduction
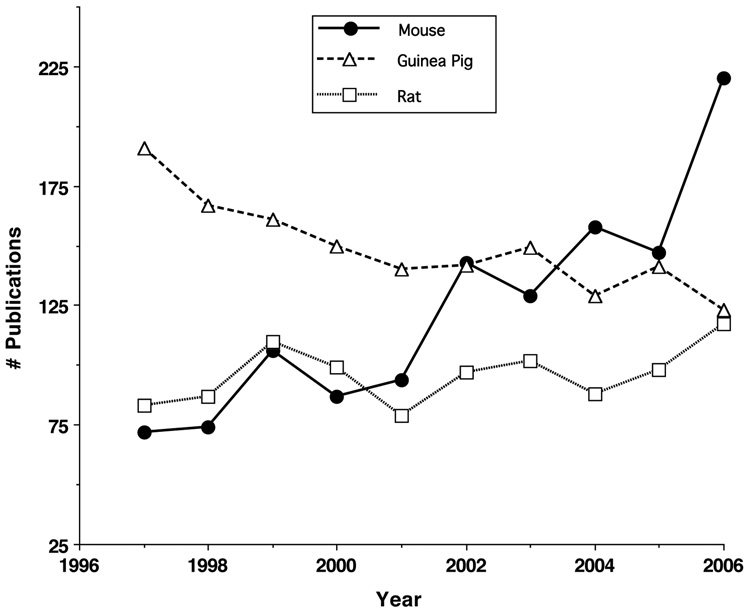
The mouse has been designated by the NIH as one of the model organisms for biomedical research in the Trans-NIH Mouse Initiative (Battey and Peterson, 1998). Although the mouse presents some difficulties in regard to functional studies of hearing, information on its genetics and the development of mutant strains is a compelling justification for many investigators to use this animal for hearing research. As noted by Bohne and Harding (2004) the mouse presents advantages, in regard to microdissection, as its cochlea has a thin otic capsule, short basilar membrane of (~6 mm), and fewer numbers of hair cells to assess (~700 inner hair cells, ~2400 outer hair cells) compared to other animal models. Its disadvantages are the small size of its cochlea and its cells, high frequency hearing range (1–100) kHz, and technical difficulties presented in testing high frequency, auditory thresholds. However, in the last 10 years it appears that hearing research investigators are choosing the mouse over other animal models (Fig. 1). These data were generated using PubMed with the search terms “cochlea” and “mouse”, “rat”, or “guinea pig”. Thus, it is reasonable to develop a new research tool, such as the MCD, to efficiently manage the growth of information on the mouse cochlea.
Fig. 1.
A plot from PubMed searches of the literature for a 10-year period (1996–2006) of the number of publications/year using the search terms: "cochlea" and "mouse" or "guinea pig" or "rat". These data suggest that investigators are more rapidly and increasingly using the mouse model for hearing research, compared with the guinea pig and rat animal models.
In addition to the MCD, there are a number of websites that contain digital images of the cochlea; however, no comprehensive image database of the cochlea yet exists, for any species. A basic understanding of the structure and function of the inner ear can be obtained from several websites that use diagrams and a limited number of digital images (Brownell, 2005; Brugge et al., 1996; Mammano and Nobili, 2005; and Pujol, 2007). In addition, there are four websites that provide a “research level” of information on the inner ear. The EarLab at Boston University (Mountain and Hubbard, 2008) is a digital warehouse of models, software, and data on the auditory system. EarLab focuses on functional studies of hearing by creating a web-based resource of computational models and a data repository of auditory information from different species. The anatomy section of EarLab uses diagrams and digital images and contains three stacks of cochlear images from the mouse, gerbil, and guinea pig. Sections in the stack can be viewed and an axis scale indicates image magnification. Another notable website is the Cochlear Fluids Research Laboratory at Washington University (Salt, 2006). This website contains anatomical images of the inner ear including 3D images from Magnetic Resonance Microscopy (MRM) and Orthogonal-Plane Fluorescence Optical Sectioning Microscopy (OPFOS), a cochlear fluids simulator, and dimensions of the fluid compartments of the cochlea for several different species. The Vertebrate Ear and Temporal Bone website (Henson and Henson, 2000) also provides 3D reconstructions of the inner ear from six species of animals using MRM. 3D reconstructions of the human temporal bone are featured in the 3D Virtual Model of the Human Temporal Bone and Related Structures, at the Eaton-Peabody Lab of the Massachusetts Eye and Ear Infirmary (Wang and Merchant, 2008). This website provides a number of 3D reconstructions of the human temporal bone, 3D viewer software, and a ImageJ plug-in that estimates frequency on an image of a surface preparation of organ of Corti, similar to the digital cytocochleogram we previously developed (Santi et al., 2004).
Unfortunately, websites on the structure and function of the inner ear are not nearly as comprehensive, standardized, and usable as the brain image databases, such as the Allen Brain Atlas (Jones, 2008) or Mouse Atlas Project of LONI (Toga, 2008). These brain atlases and associated NIH initiatives and resources (e.g., NIH Neuroscience Blueprint; National Center for Research Resources; Biomedical Informatics Research Network; and the Cell Centered Database) will be used as a guide for development of the MCD in order to effectively share, analyze, and present data on the mouse cochlea. The purpose of this communication is to provide an introduction to the resources that available on the MCD and encourage its use by other investigators.
2. Methods and Results
Development of the MCD was modeled on brain image databases in which the fundamental component was a complete stack of well-aligned, serial images of the whole organ. During initial development of the MCD, several methods for preparing complete image stacks of the mouse cochlea were explored. Image stacks and 3D reconstructions of the mouse cochlea that were prepared by Henson and Henson (2000) using Magnetic Resonance Microscopy (MRM) were examined, but it was determined that MRM did not produce sufficiently high resolution for 3D reconstruction of cochlear structures. In addition MRM and microCT cannot be use with immunohistochemical methods to selectively label cochlear structures. Celloidin sectioning of the cochlea is another method that can be used to produce a serial stack of images, but due to sectioning and mounting artifacts this methods appears unsuitable for reliable 3D reconstruction.
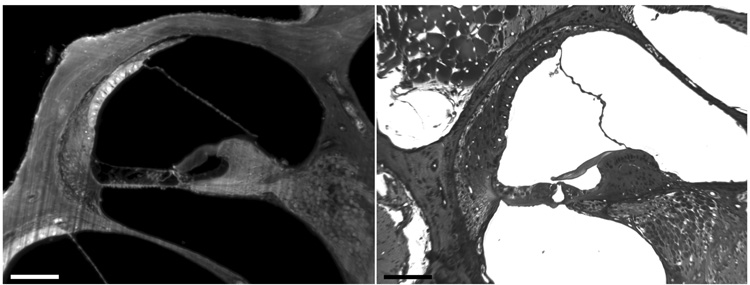
A relatively new method has been described that produces well-aligned optical sections of the whole cochlea, but has a resolution lower than brightfield microscopy. Voie and coworkers (1993) called this method Orthogonal-Plane Fluorescence Optical Sectioning Microscopy (OPFOS) and have applied it to imaging the guinea pig cochlea (Voie, 2002). We compared cross sections from a mouse cochlea that were imaged from celloidin sections and OPFOS (Fig. 2). Subcellular resolution of cochlear structures is clearly superior in the celloidin sections, but OPFOS imaging provides sufficient resolution for recognition of at least 16 different cochlear structures and OPFOS produces a well-aligned stack of images.
Fig. 2.
Two cross-sections through the scala media of the mouse cochlea. The left panel is an optical section using OPFOS imaging, and the right panel is a brightfield image from a Toluidine blue stained celloidin section. Resolution is better in the celloidin section but OPFOS imaging resolves many cochlear structures, which can be segmented for 3D isosurface reconstruction. (celloidin section courtesy of Dr. Douglas B. Webster). Bars = 100 µm.
The MCD contains images from a number of different animals; however, this paper presents data from only two animals (CBA and C57BL6 Col4A5). A complete image stack of 72 images was obtained from the cochlea of the CBA mouse using OPFOS with a voxel (x, y, z) size of (5.435, 5.435, 20 µm). A high magnification image stack of 24 OPFOS images was also obtained from the C57 mouse (collagen type IV alpha 5 knockout) with a voxel size of (1.205, 1.205, 10 µm).
OPFOS imaging begins with the euthanasia of the mouse and harvesting of its cochleas. Cochleas were chemically fixed by immersion in 4% paraformaldehyde for 24 hr, decalcified in EDTA for three days, dehydrated in ascending concentrations of ethanol, and cleared to transparency using methyl salicylate/benzyl benzoate. Cochleas were stained en block with rhodamine isothiocyanate and sent to Spencer Technologies for OPFOS imaging. Complete image stacks of the cochlea were returned to the University of Minnesota for segmentation of cochlear structures, 3D reconstruction, morphometry, and depositing of the data in the MCD.
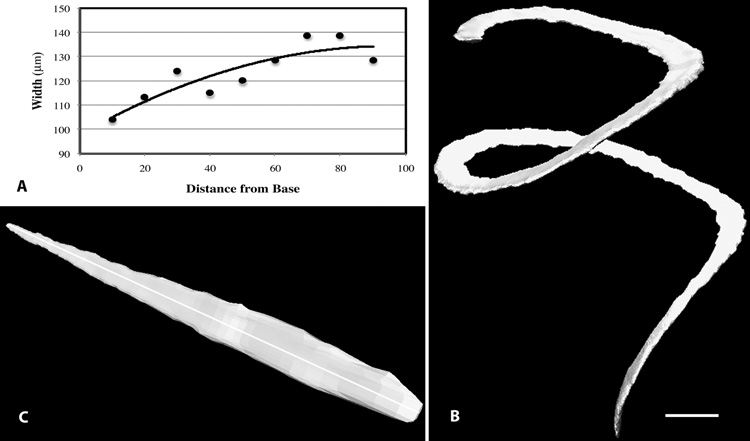
The MCD website contains several 2D image stacks that can be viewed using custom designed software that was written in PHP, Java applets and Dreamweaver (Adobe). In addition, complete, image stacks (in TIFF format) with metadata, are available as a file download. Images within the stacks can be interactively viewed on the Web using the stackviewer program. Using the stackviewer program each image in the stack can be examined at different magnifications and in different formats. Since these serial images are aligned to an OPFOS sectioning plane, and not to a cochlear plane, morphometric measurements of cochlear structures on these images are not possible. Therefore, we are developing a 3D geometric coordinate system of the cochlea and virtual resectioning to produce orthogonal sections that are suitable for accurate morphometry of cochlear structures. This process begins with fitting of a B-spline curve to a 3D isosurface reconstruction of basilar membrane to determine its total length and distance along its length. A new stack of images is generated that is aligned orthogonal to a cochlear structure, such as the centroid of the basilar membrane or the scala media. Thus, each new image contains a single "true" cross-section of the scala media in which cochlear structures can be reliably measured. For example, one can determine basilar membrane width along its length by measuring its width at known locations along its length using the measuring tools in the stackviewer program. The traditional representation of these data is a graph (e.g., scatter plot) of basilar membrane width as a function of its length (Fig. 3A). Measurements of basilar membrane width as a function of its length in this cochlea is similar to that previously reported by other investigators (Ehret and Frankenreister, 1977; Burda et al., 1988; Keiler and Richter, 2001) for the mouse cochlea. This graphic method of presenting width change along the length of the basilar membrane is effective but removes an observer from the true geometry of the structure. If one examines a 3D isosurface reconstruction of the spirally shaped basilar membrane, its change in width as a function of its length is not readily apparent (Fig. 3B). However, transformation of its spiral shape to a linear model (Fig. 3C) results in an effective visualization of its increasing width from its basal to near apical end. This transformation is possible by virtual resectioning of the cochlea in a 3D coordinate system, and is an effective visualization tool that can be used to show changes in morphology of other cochlear structures along their spiral length. However, further work is necessary to verify the reliability of orthogonal sectioning, and determine the accuracy of the morphometric results obtained from virtual, orthogonal sections.
Fig. 3.
A. A graph showing basilar membrane width along its length as estimated from the orthogonal image stack from OPFOS imaging. Data were collected at 10% intervals and a 2nd order polynomial trend line is shown on the graph. B. A 3D isosurface reconstruction of the basilar membrane showing its spiral shape but its change in width is not easily detected in this image. Bar = 500 µm. C. The spiral-shaped basilar membrane was transformed from the orthogonal sections into a linear model in perspective, where its increasing width from its base to its near apex is readily apparent. The total length of the basilar membrane (5.83mm) was estimated from orthogonal sections at the middle of its width (indicated by a white line).
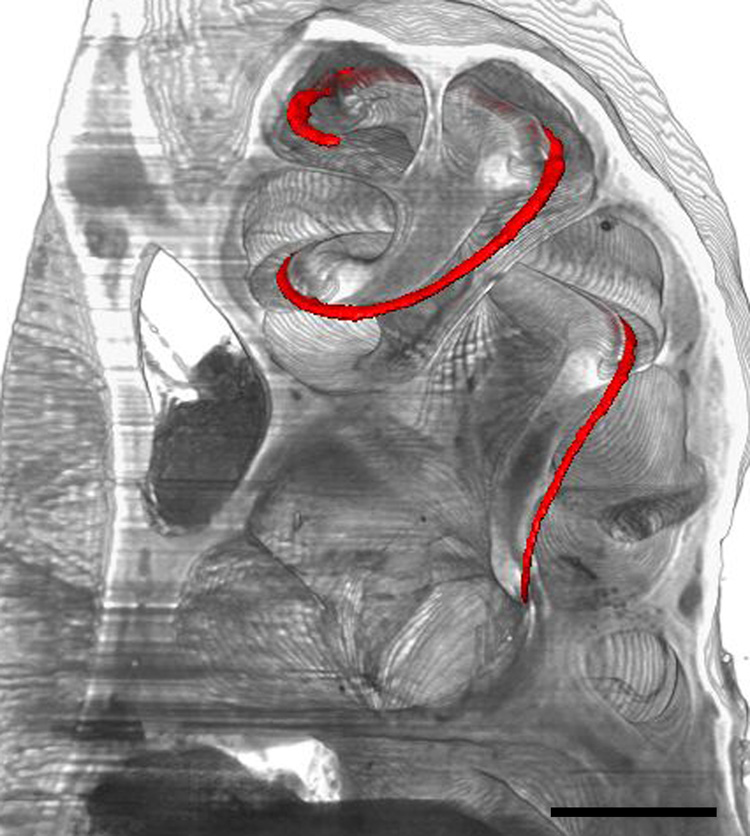
A primary requirement for accurate 3D reconstruction of cochlear structures is the generation of a well-aligned, complete 2D image stack of the cochlea. As a first step in 3D reconstruction, our software (i.e., Amira) can automatically produce a 3D impression of the whole cochlea using a process called direct volume rendering. The algorithm is based upon the emission/absorption of light projected through a volume. In a direct volume rendered stack, optical sections can be selectively removed to expose 3D internal structures of the cochlea using the stackviewer program on the MCD website. In addition, a user can also display individual, 3D isosurface rendered cochlear structures within the direct volume rendering of the whole cochlea. For example, the organ of Corti can be displayed in relationship to the other structures within the cochlea (Fig. 4) using the stackviewer program.
Fig. 4.
Sections 33–71 of a direct volume rendering using the CBA image stack. A 3D isosurface reconstruction of the organ of Corti (red) is visualized within the direct volume rendering of the stack using the stackviewer program. Bar = 500 µm.
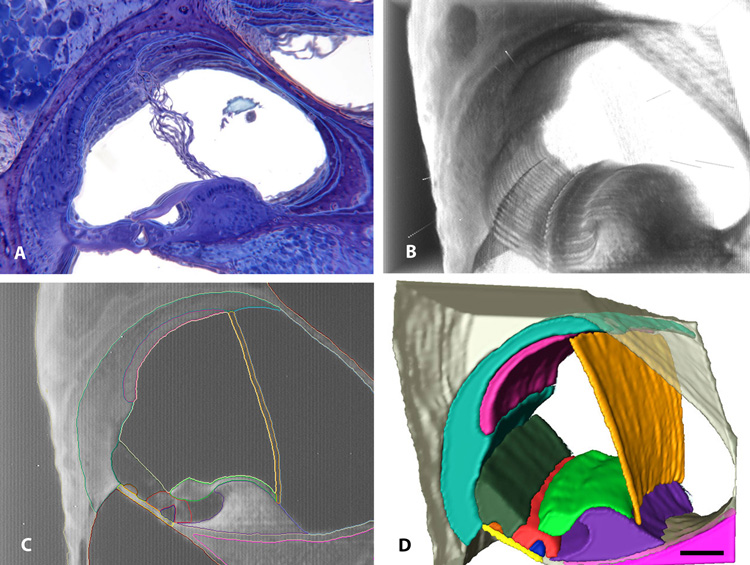
In order to prepare 3D isosurface reconstructions of individual cochlear structures, a process called segmentation is used. Although Amira provides several tools to automate this process, it is labor-intensive, as the border of each structure in each section of the stack must be outlined in a different color. Fig. 5A shows why we chose to use OPFOS imaging for 3D reconstruction compared with imaging from celloidin serial sections. Due to mechanical sectioning artifacts 13 serial images from celloidin sections could not be aligned and registered well using Amira. Fig. 5B shows excellent alignment of 24 images from OPFOS optical sectioning. The quality in the alignment of these images can also be observed in a looping movie of these 24 images that is available for download from the MCD website and from the Supplementary Materials of this paper. This movie shows that the tectorial membrane appears to be tightly applied to the reticular lamina of the organ of Corti, and regular appearance of other cochlear structures including a straight Reissner’s membrane the 24 image sequence. This movie also shows recognition of the root processes of the outer sulcus cells and continuity of the blood vessels which are not easily seen in a single, optical section.
Fig. 5.
A four-panel figure showing serial sections of a mouse cochlea from celloidin sections (A), and OPFOS sections in which segmentation and 3D reconstruction of cochlear structures was performed. (A movie of the OPFOS sections is also available in the Supplementary Materials of this paper and on the MCD website). A. Amira alignment and registration of 13 images from the celloidin serial sections which show poor alignment of cochlear structures due to mechanical sectioning artifacts of the tissue. B. Direct volume rendering of 24 OPFOS images shows excellent alignment of the sections using Amira. C. At least 14 different cochlear structures could be outlined (i.e., segmented) using different colors. D. Eleven of the 14 different structures were prepared as 3D isosurface renderings. Bar = 100 µm in all four panels.
In order to segment individual cochlear structures, they must be outlined using different colors (Fig. 5C) using Amira’s segmenting and border correction tools. Tissue borders are determined and outlined by a human observer based upon their definition and visual recognition. For example, the border of the scala media, and even its name (e.g., cochlear duct, endolymphatic space) may not be uniformly agreed upon among different investigators. We defined the scala media to include the endolymphatic space bounded by, but not including, the tectorial membrane, organ of Corti/Henson’s cells, Claudius’ cells, spiral prominence cells, endolymphatic surface of the marginal cells of the stria vascularis, and Reissner’s membrane (Fig. 5C). Other investigators (e.g., Salt, 2008) include the tectorial membrane and the inner sulcus to be within the scala media for fluid transport reasons. However, we have excluded these structures from our definition as within the scala media so that they may be segmented separately and prepared as individual, 3D isosurface reconstructions. After each structure is segmented, Amira generates isosurface 3D reconstructions of the structure and displays each one in the color of the border (Fig. 5D). Following structure segmentation, Amira estimates their volume and other morphometric parameters. As a sample of data obtained from our CBA/JCr mouse, the volume estimates for the scala vestibuli, media, and tympani are respectively (0.367, 0.284, 0.311 µl) and compare favorably with Salt's (2008) estimate (0.30, 0.19, 0.32 µl) even though very different methods were used to estimate these volumes.
The MCD contains several complete image stacks of the cochlea in which a number of different cochlear structures were segmented and their 3D isosurface reconstructions prepared. Fig. 6 shows 2D images of some of these structures (e.g., spiral ligament, stria vascularis, scala vestibuli, tympani, and media, stapes, annular ligament, ductus reuniens, cochlear aqueduct, and round window membrane). However, it is a challenge to effectively display 3D isosurface reconstructions of cochlear structures on a website. Therefore, 3D reconstructions are available for examination and downloading in a variety of formats, including: 2D images, movies, and Apple QuickTime VR interactive files. A flythrough movie is also available on the MCD website which takes a viewer through the stapes and travels through the scala vestibuli and helicotrema, and exits the cochlea through the round window.
Fig. 6.
Five views showing 3D isosurface reconstructions of primary cochlear structures that can be segmented and displayed after OPFOS imaging and Amira reconstruction. A. The spiral ligament (turquoise) and portions of the scala tympani (red), and scala vestibuli (blue) are visible. B. By decreasing transparency of the spiral ligament the stria vascularis (mauve) and a portion of the underlying scala media (gold) is revealed. C. The scala vestibuli (blue) is shown with the annular ligament (magenta) and stapes (orange). D. The scala media (gold) with a portion of the ductus reuniens (green). E. The scala tympani (red) with the cochlear aqueduct (yellow) and the round window membrane (purple). Bar = 100 µm.
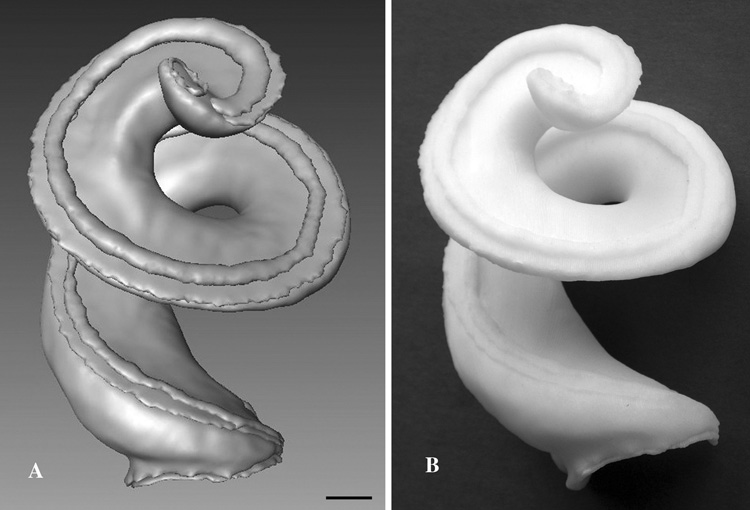
Although 3D isosurface reconstructions of cochlear structures can be viewed and manipulated on a computer screen, a significantly better understanding the 3D anatomy of the cochlea can be obtained by examining an enlarged, solid model. Conversion of a 3D computer model generated by Amira to a solid model is simply a matter of exported the file as stereolithography CAD file. Solid models can be fabricated using a number of different rapid prototyping devices. However, one must first decide which, and how many structures, in the cochlear model to fabricate. For example, several structures (e.g., scala tympani, media, and vestibuli) can be modeled together, or one key structure can be removed (e.g. Reissner’s membrane) to reveal other underlying structures (e.g., tectorial membrane or organ of Corti, Claudius’ cells, and stria vascularis). In addition, solid models may be fabricated based upon functional anatomical considerations. For example, the traditional idea of the organ of Corti as attached to the basilar membrane and sitting on the “floor” of the scala media, can be thought of in relation to the cochlear implant, and fabricated as attached to the basilar membrane on the “roof” of the scala tympani. Fig. 7 shows a computer (A) and a solid model (B) showing the basilar membrane and organ of Corti attached to the "roof" of the scala tympani. This solid model was fabricated in ABS plastic at a 50X enlargement using a Stratasys Fusion Deposition printer (http://www.stratasys.com/) at a reasonable cost and in a few hours. We are developing an interactive program for the MCD that will allow other users to construct solid models (by showing and hiding) different cochlear structures and then export and download stereolithography files (STL), which could be sent to a rapid prototyping vendor or even to a desktop 3D printer (e.g., Desktop Factory (http://www.desktopfactory.com/ ).
Fig. 7.
Rapid prototyping and solid model fabrication of the mouse cochlea from 3D computer models. A. Amira 3D isosurface reconstruction of the scala tympani with the basilar membrane, organ of Corti, and helicotrema applied and prepared for export as a stereolithography file. B. A fusion deposition, solid model enlarged 50X of the 3D computer model shown in A. The solid model was constructed in durable ABS plastic. Bar = 100 µm.
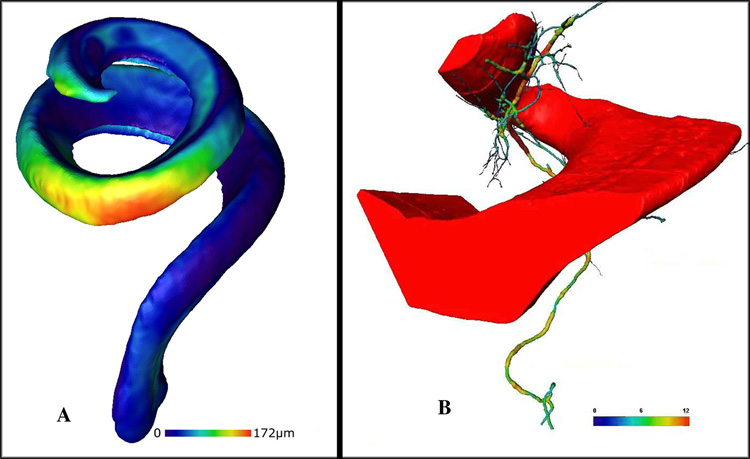
Another benefit of producing 3D computer models of the cochlea is for data reduction and visualization. 3D computer models contain all of the resolvable data in a normal or pathological cochlea, but complex anatomical features are difficult to understand, especially across a number of animals in a group. 3D isosurface models can be combined and averaged across animals, experimental treatments, or to show the time course of development or pathological events in an efficient and visually striking manner. Amira has tools to combine polygons between 3D isosurface reconstructions using the Procrustes method, which minimizes the root mean square distance between the points of the surface model to corresponding points on the reference surface using an iterative process. Maximum polygon displacement in a composite 3D rendering (i.e., the Hausdorff distance) can be expressed in the 3D models using a color map. Panel A of Fig. 8 shows an averaged 3D image of the scala media from two different mice. Scala media dimensions and geometry appear similar along most of their length, but one scala media appears larger at the apex and, by approximately 172 µm, at a location that is 70% of the distance from the cochlear base. Generation of these average, 3D isosurface models of certain cochlear structures in pathological animals will be a useful new tool to visualize cochlear abnormalities, similar to color mapped 3D reconstructions of the brain that are currently being used to show pathologies across animals in a group. Furthermore, Amira offers another quantitative tool (skeletonization) for 3D models that can be used to reduce and visualize information about the complex, vascular anatomy of the cochlea. Panel B shows a 3D isosurface reconstruction of a portion of the scala tympani with vessels of the modiolus that have been skeletonized and their size differences color mapped. Statistical analysis can be performed on these skeletonized data, and visual models would clearly convey quantitative differences among the vessels. Vascular pathologies in the cochlea have been discussed in the literature for many years; however, many of these observations have been qualitative and speculative.
Fig. 8.
A. Averaging of 3D isosurface reconstructions of the scala media in two different animals. The average model shows the location and amount of difference (by a color map) between the two computer models. One scala media appears to be larger at the extreme apex and greatest (by 172 um (red)) at a region approximately 70% from the cochlear base. B. A portion of a 3D reconstruction of the scala tympani (red) and blood vessels within the modiolus that have been segmented, rendered, and skeletonized. Blood vessel size has been color mapped and ranges from 0 (blue) to 12 µm (red).
The Institutional Animal Care and Use Committee of the University of Minnesota approved the care and use of mice for this research.
3. Discussion
Successful development of the MCD depends upon the quality and quantity of its resources and software tools, and whether MCD users find the website efficient and useful for learning the anatomy of the mouse cochlea and for the data mining of its resources for research. Specifically, development of the MCD will provide website users with comprehensive 2D anatomical atlases of the cochlea in normal and selected mutant mice, and 3D isosurface reconstructions of individual cochlear structures from 2D image stacks. The MCD provides the first comprehensive anatomical atlases of the mouse cochlea. We plan to add complete, serial 2D stacks of the cochlea from a number of normal (CBA) and mutant mice. In addition, we are developing and testing a 3D coordinate system for the cochlea that can be used to transform image sections of the cochlea into orthogonal sections of the cochlea for accurate morphometric analysis of cochlear structures along the length of the basilar membrane. Morphometric data of different cochlear structures from these stacks will be deposited in a searchable database of cochlear morphometry on the MCD website. The MCD will also provide interactive tools for noncommercial construction of solid cochlear models using a rapid prototyping process.
Although the educational value for learning cochlear anatomy from the numerous high quality images of the mouse cochlea on the MCD website is readily apparent, there is no specific tool such as a cochlear anatomy tutorial on the website. This is due to NIH funding for the development of the MCD as a research resource, rather than as an educational site. However, it is obvious that the MCD contains many images of the cochlea that are useful for education and many of these images have been downloaded, presumably to supplement lectures on the cochlea. The feedback that we have received on MCD resources from users has been very positive, and website statistics reveal extensive downloading of MCD images from worldwide locations. Although the goal of the MCD is to provide community-wide distribution and use, there needs to be a mechanism to evaluate the quality and usefulness of the MCD resources for its sustainability and growth. The MCD provides a new paradigm for learning and performing anatomical research on the mouse cochlea that is different than the peer-reviewed journal article. Perhaps the best mechanism to insure peer-reviewed verification and citability of the MCD resources is to publish some of its resources in scientific journals. Open access copyright issues that are currently being promulgated that will make the process of data sharing, especially from NIH funded studies more manageable. In order to make MCD resources useful to others it is no longer sufficient to provide representative images in a printable publication but to make available complete collections of images in electronically accessible files. This could be accomplished in some journals as supplementary information, as long as the journal did not require ownership of the data. In addition, to establish permanency of these data they should exist in several electronic sources. Although MCD resources are currently hosted on a mainframe computer at the University of Minnesota, we have also obtained permission (Martone, 2008) to mirror some of the MCD resources at the NIH CellCentered Database (CCDB) at the following URL: http://ccdb.ucsd.edu/CCDBWebSite/index.html.
We hope that the MCD will grow to serve the research community as an easily accessible, organized, and comprehensive archive of information on the mouse cochlea and that the MCD will make the task of reviewing the current knowledge on the anatomy of this important structure more efficient. In addition, the MCD has the potential to become a new research tool by the data mining of its resources and the generation of new knowledge. Complete image stacks will be available on the MCD website for other investigators to analyze. Although we will analyze and report information from MCD resources, opportunities exist for further analysis by other investigators by their access to complete data sets. We welcome and will host image datasets of the mouse cochlea from other investigators. Please contact us for the details regarding the format and metadata that are necessary for contributing images to the MCD and CCDB. Due to its extensive resources, the MCD may also help investigators avoid unnecessary replication of studies that seek to determine normal morphometric values or relationships among different cochlear structures in the mouse.
Supplementary Material
Acknowledgements
The authors thank the following students who have worked on the initial development of the MCD: Viet Pham, Jodi Lukkes, and Ann Schrafnagle, who did a great deal of structure segmentation. We also thank Tom Forsythe for work on the Stack Viewer program, and John Purdy for his excellent work on preliminary development of the 3D coordinate system of the cochlea. We also thank Dr. Douglas B. Webster of Louisiana State University the celloidin sections of the mouse cochlea and Dave Hultman for assistance with the rapid prototyping. Authorship credit follows ICMJE guidelines (http://www.icmje.org/index.html). Funding for this research has been provided by the: NIDCD (R21 DC005482 ; R01 DC007588), Capita Foundation, and University of Minnesota resources including the: Digital Technology Center, Supercomputing Institute, and Biomedical Engineering Institute. P.S. designed the MCD, wrote grants to fund the project, prepared the images, and wrote the manuscript. A.V. performed the OPFOS imaging and reviewed the manuscript. A.V. is an employee of Spencer Technologies (http://www.spencertechnologies.com).
Abbreviations
- 2D
two-dimensional
- 3D
three-dimensional
- CCDB
Cell Centered Database
- ICMJE
International Council of Medical Journal Editors
- LONI
Laboratory of NeuroImaging
- MCD
Mouse Cochlea Database
- MicroCT
Microcomputed Tomography
- MRM
Magnetic Resonance Microscopy
- NIDCD
National Institute on Deafness and Other Communication Disorders
- NIH
National Institutes of Health
- OPFOS
Orthogonal Plane Fluorescence Optical Microscopy
- VR
Virtual Reality
Footnotes
Publisher's Disclaimer: This is a PDF file of an unedited manuscript that has been accepted for publication. As a service to our customers we are providing this early version of the manuscript. The manuscript will undergo copyediting, typesetting, and review of the resulting proof before it is published in its final citable form. Please note that during the production process errors may be discovered which could affect the content, and all legal disclaimers that apply to the journal pertain.
References
- Battey J, Peterson J. Trans-NIH mouse initiative. 1998 http://www.nih.gov/science/models/mouse/
- Bohne B, Harding G. Microscopic anatomy of the mouse cochlea. 2nd. Washington: University School of Medicine; 2004. [Google Scholar]
- Brownell W. Cochlear biophysics laboratory. 2005 http://www.bcm.tmc.edu/oto/research/cochlea/
- Brugge J, Geisler D, Hind J, Rose D, Greenberg S. EarWorks auditory tour. 1996 http://www.physiology.wisc.edu/h&b/auditory/auditorymain.html.
- Burda H, Ballast L, Bruns V. Cochlea in old world mice and rats (Muridae) J Morphol. 1988;198:269–285. doi: 10.1002/jmor.1051980303. [DOI] [PubMed] [Google Scholar]
- Ehret G, Frankenreiter M. Quantitative analysis of cochlear structures in the house mouse in relation to mechanisms of acoustical information processing. J. Comp. Physiol. 1977;122:1432–1351. 1979. [Google Scholar]
- Henson O, Henson M. The vertebrate ear and temporal bone. 2000 http://www-cellbio.med.unc.edu/henson_mrm/
- Jones A. Allen brain atlas. 2008 http://brain-map.org/welcome.do.
- Keiler S, Richter C-P. Cochlear dimensions obtained in hemicochleae of four different strains of mice: CBA/CaJ, 129/CD1, 129/SvEv and C57BL/6J. Hear Res. 2001;162:91–104. doi: 10.1016/s0378-5955(01)00374-4. [DOI] [PubMed] [Google Scholar]
- Kraus HJ, Aulbach-Kraus K. Morphological changes in the cochlea of the mouse after the onset of hearing. Hear. Res. 1981;4:89–102. doi: 10.1016/0378-5955(81)90038-1. [DOI] [PubMed] [Google Scholar]
- Mammano F, Nobili R. The cochlea. 2005 http://147.162.36.50/cochlea/
- Salt AN. Cochlear fluids research laboratory. 2006 http://oto.wustl.edu/cochlea/
- Martone M, Gupta A, Elisman M. Cell centered database of the national center for microscopy and imaging research. 2008 http://ccdb.ucsd.edu/CCDBWebSite/index.html.
- Mountain DC, Hubbard AE. EarLab at Boston University. 2008 http://earlab.bu.edu.
- Pujol R. Promenade ‘round the cochlea. 2007 http://www.iurc.montp.inserm.fr/cric51/audition/english/index_gb.htm.
- Santi PA, Blair A, Bohne BA, Lukkes J, Nietfeld J. The digital Cytocochleogram. Hearing Res. 2004;192:75–82. doi: 10.1016/j.heares.2004.01.017. [DOI] [PubMed] [Google Scholar]
- Toga AW. Mouse atlas project. 2008 http://www.loni.ucla.edu/MAP/
- Wang H, Merchant S. 3D virtual models of the human temporal bone and related structures. 2008 http://research.meei.harvard.edu/Otopathology/3dmodels//3Dviewer.html.
- Voie AH, Burns DH, Spelman FA. Orthogonal-Plane Fluorescence Optical Sectioning: three-dimensional imaging of macroscopic biological specimens. J. Microsc. 1993;170:229–236. doi: 10.1111/j.1365-2818.1993.tb03346.x. [DOI] [PubMed] [Google Scholar]
- Voie AH. Imaging intact guinea pig tympanic bulla by Orthogonal-Plane Fluorescence Optical Sectioning Microscopy. Hear. Res. 2002;171:119–128. doi: 10.1016/s0378-5955(02)00493-8. [DOI] [PubMed] [Google Scholar]
Associated Data
This section collects any data citations, data availability statements, or supplementary materials included in this article.


