

Abstract
Glioblastomas are notorious for their resistance to ionizing radiation (IR) and chemotherapy. We hypothesize that this resistance to IR is due, in part, to alterations in antioxidant enzymes. Here, we show that rat and human glioma cells overexpress the antioxidant enzyme, peroxiredoxin II (Prx II). Glioma cells in which Prx II is decreased using shRNA exhibit increased hyper-oxidization of the remaining cellular Prxs suggesting that the redox environment is more oxidizing. Of interest, decreasing Prx II does not alter other antioxidant enzymes (i.e. catalase, GPx, Prx I, Prx III, CuZnSOD, and MnSOD). Analysis of the redox environment revealed that decreasing Prx II increased intracellular ROS in 36B10 cells; extracellular levels of H2O2 were also increased in both C6 and 36B10 cells. Treatment with H2O2 led to a further elevation in intracellular ROS in cells where Prx II was decreased. Decreasing Prx II expression in glioma cells also reduced clonogenic cell survival following exposure to IR and H2O2. Furthermore, lowering Prx II expression decreased intracellular glutathione and resulted in a significant decline in glutathione reductase activity, suggesting a possible mechanism for the observed increased sensitivity to oxidative insults. Additionally, decreasing Prx II expression increased cell cycle doubling times with less cells distributed to S-phase in C6 glioma cells and more cells redistributed to the most radiosensitive phase of cell cycle, G2/M, in 36B10 glioma cells. These findings support the hypothesis that inhibiting Prx II sensitizes glioma cells to oxidative stress presenting Prxs as potential therapeutic targets.
Keywords: peroxiredoxin II, glioma, radiation, oxidative stress, glutathione, cell cycle
Introduction
Gliomas account for > 60% of primary brain tumors in which glioblastoma multiforme (GBM) represents the most common and aggressive of these tumors (1). Despite technological advances in anti-glioma therapies including surgery, radiation, and chemotherapy, the median survival for these patients remains 14.6 months (2). Resistance of gliomas to radiation and chemotherapy is responsible for poor patient prognosis. Intrinsic radioresistance (3), enhanced DNA repair mechanisms (4), and hypoxia (5) are contributing factors to this resistance. We hypothesize that this resistance is due also, in part, to altered expression of antioxidant enzymes. A growing body of evidence points to alterations in the levels of antioxidant enzymes in gliomas and other solid tumors (6–18). We and others have shown that catalase, a hydrogen peroxide (H2O2)-reducing antioxidant enzyme, is overexpressed in glioma cells and contributes to their resistance to ionizing radiation (IR) (6, 8–10). Indeed, we have demonstrated that inhibiting catalase expression in glioma cells results in sensitization to radiation and oxidative stress (6).
Oxidative stress is defined as an imbalance between cellular oxidants and antioxidants/antioxidant enzymes which favors the accumulation of the former. Reactive oxygen species (ROS), such as superoxide (O2•−) and H2O2 are constitutively generated during normal cellular metabolism. At physiological levels, ROS play an important role in signaling pathways regulating cell proliferation, differentiation, and activation of transcription factors (19–27). However, lower levels of ROS may lead to aberrant signaling while higher levels have been associated with cell death and pathological conditions induced by oxidative stress in which excessive ROS inflict damage by oxidizing DNA, lipids, proteins, and cellular macromolecules. Due to its small molecular size and diffusibility, H2O2 is well equipped to serve as an intracellular and extracellular signaling molecule. Although a mild oxidant, H2O2 reacts readily with transition metals such as Cu1+ and Fe2+ producing the deleterious hydroxyl radical (OH•) via the Fenton reaction. Endogenous antioxidants, such as glutathione (GSH) and the antioxidant enzymes i.e. superoxide dismutase (SOD), catalase, glutathione peroxidase (GPx), and the more recently identified peroxiredoxins (Prxs), are responsible for reducing cellular ROS. We hypothesize that alterations in levels of antioxidant enzymes may offer a survival advantage for cancer cells by reducing the efficacy of anti-cancer therapies such as IR and chemotherapeutics that work via generation of ROS.
Peroxiredoxins are elevated in numerous malignancies such as lung, thyroid, mesothelioma, breast, and GBM (11–18, 28, 29). Peroxiredoxins are encoded by distinct genes and consist of six isoforms (Prx I-Prx VI) in mammals which are classified into three “mechanistic” subgroups (2-Cys, atypical 2-Cys, and 1-Cys) (30–33). All Prxs contain a conserved NH2-terminal cysteine residue which serves as the active site for catalysis in which 2-Cys Prxs exist as homodimers in a head-to-tail conformation (34–36). 2-Cys Prxs (Prx I- Prx IV) have an additional conserved C-terminal cysteine residue responsible for resolving the oxidized active site cysteine. Atypical 2-Cys Prx (Prx V) requires an additional resolving cysteine in a different position for intrasubunit disulfide bond formation and catalytic activity; the 1-Cys Prx (Prx VI) requires only the conserved NH2-terminal cysteine for catalytic activity (30, 37, 38). Peroxiredoxins exhibit variable cellular distributions; Prx I, Prx II, and Prx VI are localized predominantly in the cytoplasm but have also been found in the nucleus (31, 33, 39, 40). Peroxiredoxin III contains a localization sequence targeting the enzyme to the mitochondria (41). Peroxiredoxin IV contains an NH2-terminal secretion signal sequence and is found in the extracellular space as well as the endoplasmic reticulum (32, 38). Peroxiredoxin V consists of several splice variants with the short spliced variant harboring a C-terminal signal sequence targeting Prx V to peroxisomes while the long variant has an NH2-terminal signal sequence targeting Prx V to the mitochondria (37). Peroxiredoxin V has also been reported to contain a nuclear localization sequence (15, 37). Peroxiredoxins protect cells by removing constitutive levels of H2O2, hydroperoxides, and peroxynitrite. In the process, the conserved NH2-terminal cysteine residue becomes oxidized forming a cysteine sulfenic acid (Cys-SOH) which subsequently forms a cysteine disulfide bond with the resolving cysteine of the dimer (30, 34, 42, 43). The cysteine disulfide bond is reduced to the cysteine sulfhydryl (Cys-SH) by thioredoxin (Trx) for Prx I- Prx V while Prx VI uses other reducing equivalents such as GSH (30, 31, 44). However, under high levels of oxidant stress, the cysteine residues become hyper-oxidized to either a cysteine sulfinic acid (Cys-SO2H) or oxidized further to a cysteine sulfonic acid (Cys-SO3H), both of which inactivate the enzyme (42, 43). Until recently, the paradigm was that hyper-oxidation of Prxs was irreversible but it has been shown recently that hyper-oxidized Prxs are reduced by sulfiredoxins and sestrins, thereby reactivating the enzyme (45, 46).
Numerous studies have revealed that Prxs are important regulators of intracellular H2O2 which governs a variety of processes including cell proliferation, differentiation, cell death, and intracellular signaling (30, 31, 42). Importantly, Prxs have been shown to protect cells from IR. Zhang et al. demonstrated that IR-induced expression of Prx I in colon carcinoma cells and knocking down Prx I expression increased radiosensitivity (47). Furthermore, Park et al. showed that i] IR increased expression of Prx II in head-and-neck cancer cell lines, and ii] antisense oligonucleotides against Prx II sensitized these cells to IR (48). Since GBM is refractory to IR and chemotherapy, altering the redox environment of these cells may sensitize them to anti-cancer therapies mediated via oxidative stress. Here, we show that Prx II is overexpressed in glioma cells when compared to their normal cell counterpart, the astrocyte. Moreover, knocking down Prx II sensitizes gliomas to oxidative stress. Mechanistic studies indicate that this increased sensitivity is due, in part, to a decline in glutathione reductase activity lowering intracellular GSH, as well as alterations in cell cycle distribution leading to either a decreased proportion of cells in S-phase, the proliferative phase of cell cycle, or an increase in the proportion of cells in the G2/M phase, the most radiosensitive phase of the cell cycle.
Materials and methods
Materials
All chemicals and reagents were purchased from Sigma-Aldrich (St. Louis, MO) unless stated otherwise. Medium and media components were purchased from Invitrogen (Carlsbad, CA).
Cell cultures
Primary rat astrocytes were isolated from the cerebral cortex of 2 to 3 day old Sprague-Dawley rat pups as described previously (6). Type II astrocytes were maintained in MEM supplemented with 10% fetal bovine serum (FBS), 4 mM L-glutamine, and 38.9 mM glucose. Medium was changed every two days and cells were used upon reaching 90–95% confluence. 36B10 rat glioma cells, a gift from Dr. Vincent Traynelis (Department of Neurosurgery, University of Iowa, Iowa City, IA), were maintained in DMEM/F12 medium supplemented with 10% FBS, 4 mM L-glutamine, and 38.9 mM glucose and used when they reached 70–75% confluence. The rat glioma cells lines, C6, RG2, and RT2, purchased from the America Type Culture Collection (ATCC, Manassas, VA), were maintained in Ham’s F12, DMEM, and DMEM/F12, respectively, containing 10% FBS, 4 mM L-glutamine, and 38.9 mM glucose. SVGp12, an immortalized human glial cell line, was purchased from ATCC while the human glioma cell lines, U118, U373, and U251, were a generous gift from Dr. Waldemar Debinski (Brain Tumor Center of Excellence, WFUSM). All cells were maintained at 37°C in a humidified atmosphere of 5% CO2.
Molecular inhibition of Prx II (shRNA)
Inhibition of Prx II expression was accomplished using the Ambion pSilencer™ 4.1 CMV-puro vector kit (Ambion, Inc., Austin, TX). Complementary 55-mer oligonucleotides (sense: 5’-ATCCAAATC AAGCTTTCAGACTATTCAAGAGATAGTCTGAAAGCTT GATTTCCA-3’) consisting of a 19-mer target sequence, a hairpin loop sequence, and 5’ BAMHI and 3’ Hind III nucleotide overhangs were purchased from Integrated DNA Technologies (IDT, Coralville, IA). The complementary oligonucleotides were annealed, ligated into the pSilencer™ 4.1 CMV-puro vector, and transformed into DH5α E. coli cells (Invitrogen). Plasmids were amplified under ampicillin selection, and purified using a maxi-prep kit (Qiagen, Valencia, CA). Control and shRNA plasmid vectors were transfected into glioma cells using Lipofectamine 2000 transfection reagent (Invitrogen). Stable cell lines were generated and maintained in 200 ng/mL puromycin. The control sequence, denoted as shNeg, provided with the Ambion pSilencer™ 4.1 CMV-puro vector kit, does not share homology with any known sequences in the human, mouse, or rat genomes.
Western blot analysis
Cells were grown to 75% confluence in 100-mm tissue culture plates. Cells were harvested by aspirating off the medium and washing twice in phosphate-buffered saline (PBS: 137 mM NaCl, 2.7 mM KCl, 1 mM CaCl2, 0.5 mM MgCl2, 1.5 mM KH2PO4, 8 mM NaHPO4; pH 7.0). Cells were then suspended in 1 mL of PBS and centrifuged. Isolated cell pellets were lysed and sonicated in M-PER mammalian lysis buffer (Pierce Biotechnology, Inc., Rockford, IL) containing 1 mM phenylmethylsulfonyl fluoride (PMSF), 1 mM sodium vanadate (Na3VO4), 5 µg/mL leupeptin, and 1 µg/mL aprotinin. Protein was quantified using the Bradford protocol (49). Twenty-50 µg of protein were then separated on 10–15% acrylamide gels by SDS-PAGE and transferred to polyvinylidene fluoride (PVDF) membranes. Membranes were blocked in 5% skim milk in TBST (0.02 M Tris, 0.15 M NaCl, 0.05% Tween-20; pH 7.5). Membranes then were analyzed with primary antibodies against the following proteins: Prx I, Prx III, Prx-SO3 (LabFrontier, Seoul, Korea), Prx II (a gift from Leslie Poole, WFUSM), β-actin (Sigma-Aldrich), catalase (CalBiochem, San Diego, CA), MnSOD (LabFrontier), CuZnSOD (Abcam, Cambridge, MA), phospho-Cdc2,Cdc2 (Cell Signaling Technologies, Boston, MA), phospho-γ-H2AX, and γ-H2AX (Cell Signaling Technologies). Blots were then scanned and analyzed using the Scion Image Software (National Institute of Health).
Measurement of intracellular ROS
Intracellular ROS were detected using the cell permeable probe, 2’7’-dichlorofluorescein diacetate (DCFH-DA; Invitrogen/Molecular Probes, Eugene, OR) as described previously (6). Cells were treated with either 10 µM DCFH or 1 µM of the non-oxidizable control probe, carboxy-DCFDA for 45 minutes. Fluorescence was detected using an excitation of 485 nm and an emission of 538 nm.
Measurement of extracellular H2O2
Extracellular H2O2 was determined using the Amplex Red H2O2 assay kit (Invitrogen/Molecular Probes) as described previously (6). Cells were seeded in 96-well tissue culture plates such that cells reached 70–75% confluence 24 h following plating. The medium was removed and cells were washed twice with Krebs Ringer phosphate buffer (KRPB: 145 mM NaCl, 5.7 mM sodium phosphate, 4.86 mM KCl, 1.22 mM MgSO4, 5.5 mM glucose; pH 7.3). One hundred µL of KRPB containing 50 µM Amplex Red reagent and 0.1 Unit/mL HRP were added and the cells incubated at 37°C. Absorbance was measured over an extended time course (0–24 h) at 560 nm.
Catalase enzymatic activity assay
Catalase enzymatic activity was determined using a modified method by Beers and Sizer (50). Cell extracts containing 100 µg of protein were combined with 30 mM H2O2 (Fisher Scientific, Suwanee, GA) in 1 mL volume of 50 mM Potassium phosphate buffer PPB (pH 7.0). Hydrogen peroxide reduction was measured as absorbance at 240 nm for 120 s and recorded over 15-s intervals. Catalase enzymatic activity was expressed in k units per µg protein per second (k units/µg); k = 1/60 × ln(A0/A60) where A0 is the initial absorbance and A60 is the absorbance at 60 s.
Glutathione peroxidase enzymatic activity assay
Glutathione peroxidase (GPx) activity was measured using a method described by Lawrence and Burk (51). Cell extracts containing 200 µg of protein were added to 1 mL volume of 50 mM PPB (pH 7.8) containing 1 mM ethylenediaminetetraacetic acid (EDTA), 1 mM sodium azide, 1 Unit glutathione reductase, 1 mM reduced glutathione (GSH) for 10 min at 30°C. Then, 1.5 mM reduced nicotinamide adenine dinucleotide phosphate (NADPH) and 15 mM cumene hydroperoxide (Fisher Scientific) were added to the solution and absorbance was measured at 340 nm, recorded over 30-s intervals for 5 min. Glutathione peroxidase activity was expressed as mUnit /mg protein, where one unit of GPx is equal to the amount of protein required to oxidize 1 µM NADPH/min.
Superoxide dismutase enzymatic activity assay
Superoxide dismutase (SOD) activity was determined using a competitive inhibition assay developed by Spitz and Oberley (52) in which xanthine and xanthine oxidase are used to generate O2•−. The rate of reduction of nitroblue tetrazolium (NBT) indicates O2•− production while inhibition of the rate of NBT reduction indicates SOD activity. Increasing amounts of protein from cell extracts (0–500 µg) were added to the reaction mixture containing 0.05 M PPB, 1 mM diethylenetriaminepentaacetic acid (DETAPAC), 0.13 mg/mL BSA, 1 Unit/mL catalase, 0.13 mM xanthine, 56 µM NBT, and 50 µM bathocuproine disulfonic acid (BCS). The rate of NBT reduction was measured spectrophotometrically at 560 nm. Inhibition curves were generated by plotting % inhibition (% inhibition = rate of blank-rate of sample / rate of blank × 100) versus ug of protein added to the reaction and 50% of maximum inhibition was determined. One unit of SOD activity was defined as that amount of protein added to the reaction to reach 50% of maximum inhibition. Specific activity data are presented as units of SOD activity per mg of protein.
Measurement of intracellular and extracellular glutathione
Intracellular and extracellular glutathione were determined as described previously (6). Reduced glutathione (GSH) and oxidized glutathione (GSSG) were differentiated by the addition of 2-vinylpyridine in ethanol and assayed according to a method described by Griffith (53). Cell pellets or 5 mL of media were thawed and homogenized in 50 mM PPB (pH 7.8) containing 1.34 mM DETAPAC and protein was quantified according to the Lowry method (54). Glutathione measurements were normalized to protein concentration.
Detection of glutathione reductase activity
Glutathione reductase (GR) activity was determined using a modified method described previously (55). Cell extracts were incubated in a reaction mixture containing 100 mM PPB (pH 7.0), 1 mM EDTA, 1 mM GSSG, and 0.2 mM NADPH. The decrease in absorbance as a result of the oxidation of NADPH was measured at 340 nm. Glutathione reductase activity was calculated using the extinction coefficient of NADPH (ε = 6.22 mM−1 cm−1) and expressed as nmol/(min mg protein).
Cell Viability
Cell viability was determined according to the method described by Denizot and Lang (56). Cells were plated in 24-well plates at a density that would allow cells to reach 70–75% confluence within 96 h. Cells were then either treated with H2O2 or IR and then allowed to grow for 96 h. The reagent 3-(4,5-dimethyl-2-yl)-2,5-diphenyltetraolium bromide (MTT) was added to the cells for 2 h and cells were then lysed in a solution containing 20% sodium dodecyl sulfate (SDS) and 50% N, N-dimethyl formamide (Fisher Scientific). One hundred µL of solution were transferred to 96-well plates and absorbance was measured at 570 nm.
Clonogenic survival
Clonogenic survival assays were used to determine the sensitivity of cells to IR and H2O2 as described previously (57). Cells seeded in 60-mm tissue culture plates for 24 h were either irradiated with a range of single doses of 1–8 Gy using a 137Cs γ irradiator (dose rate of 4 Gy/min) or treated with 0–100 µM H2O2. Twenty-four hours following treatment, fresh medium was added and the cells were maintained for another 10–14 days. Colonies were stained with a solution containing 0.1% crystal violet and 2.1% citric acid added directly to the medium for 1 h. Colonies containing ≥50 cells were scored as surviving clonogens. Surviving fraction (SF) was determined as the number of colonies formed divided by the number of cells seeded multiplied by the plating efficiency (PE). PE was calculated as the number of colonies formed divided by the number of cells seeded × 100.
Cell cycle analysis by flow cytometry
Cell cycle analysis was determined by propidium iodide staining analyzed by flow cytometry. Approximately 2 × 10⁶ cells were fixed in ethanol and resuspended in 1 mL of a solution containing 3.8 mM sodium citrate, 50 µg/mL of propidium iodide, and 0.5 µg RNAse A and analyzed at WFUSM Flow Cytometry Core Lab. Data were evaluated using the ModFit software program (Verity Software House, Topsham, ME).
Measurement of cell growth and doubling time
Cell growth and proliferation were determined using a doubling time assay which determines the time it takes for cells to complete one round of the cell cycle. Cells were seeded at 2.5 × 10⁵ cells/plate, grown for 72 h, and collected every 48 h. Cells were trypsinized and viable cells counted with a hemocytometer. Doubling time was calculated as td= Log 2 × dt/(Log N-Log N0); where td = doubling time, dt = time point of counting (h), N = number of cells counted, N0 = initial number of cells seeded.
Statistical analysis
GraphPad Prism 4 software (GraphPad Software Inc., San Diego, CA) was used for statistical analyses. Data are represented as mean ± standard error (SE) for the indicated number of experiments. The Student unpaired t test was used to determine differences between means, and the F test was used to compare variances; a p value of < 0.05 was considered significantly different. Comparisons between groups were performed using Two-Way analysis of variance (ANOVA) followed by Bonferroni post test for pair-wise comparison; p < 0.05 was considered significantly different. Three independent experiments were performed unless otherwise stated.
Results
Prx II is overexpressed in human and rat glioma cell lines
Since astrocytes, the normal counterpart of glioma cells, express low levels of Prx II, overexpression of Prx II may be important for protecting glioma cells from endogenous and exogenous sources of oxidative stress. Therefore, several rat and human glioma cell lines were examined for expression of Prx II (Fig. 1A and B). When compared to primary rat astrocytes, Prx II levels were at least 4-fold higher in the rat glioma cell lines (Fig. 1A). Similarly, when human glioma cells were compared to an immortalized glial cell line, SVGp12, Prx II protein levels were 5-fold higher for U118 and U251 glioma cells, and 2.5-fold higher for U373 glioma cells (Fig. 1B). To begin to test the hypothesis that knocking down Prx II would sensitize glioma cells to oxidative stress, C6 and 36B10 rat glioma cell lines stably expressing a non-targeted control shRNA sequence (shNeg) or Prx II shRNA (shPrx2) were established. C6 shPrx2 and 36B10 shPrx2 cells showed a 50.0 ± 2.8 % (p < 0.001) and a 49.0 ± 11.1 % (p = 0.0102) reduction, respectively, in Prx II immunoreactive protein (Fig. 1C). Antioxidant enzymes exhibit dynamic regulation, compensating for a deficiency or overexpression of another by modulating the expression of others to maintain the cellular redox environment. To determine whether reductions in Prx II altered other Prxs, the cytosolic Prx I and the mitochondrial Prx III were examined. Decreasing Prx II in C6 and 36B10 rat glioma cells did not significantly alter levels of Prx I or Prx III protein (Fig. 1C). Moreover, decreasing Prx II did not alter enzymatic activity of the peroxide scavenging antioxidant enzymes GPx or catalase (Table 1). Similarly, protein and activity levels of mitochondrial MnSOD or cytosolic CuZnSOD were not affected by Prx II modulation as shown in Supplementary Fig 1SA–B.
Fig. 1.

Prx II immunoreactive protein is increased in human and rat glioma cell lines compared with their normal cell counterparts. Western blots showing that Prx II is overexpressed in (A) rat and (B) human glioma cell lines compared with levels seen in normal cells are representative of three independent experiments. Densitometric analysis revealed a significant increase in Prx II protein levels in rat and human glioma cells compared with normal cells. (C) Representative Western blot and densitometric analysis revealed that Prx I and Prx III were not significantly altered when Prx II was knocked down.(■) represent shNeg and open squares (□) represent shPrx2 cells for the respective cell lines. Mean ± SE; n = 3. Statistical significance was determined using the Students t-test where p < 0.05 (*), p ≤ 0.01 (**), p ≤ 0.001 (***).
Table 1.
The Effect of Knocking Down Prx II on H2O2 Scavenging Antioxidant Ezymes
| Group | Catalase Units/mg |
GPx mUnits/mg |
|---|---|---|
| C6 shNeg | 158 × 10−5±0.04 | 244.4±26.14 |
| C6 shPrx2.3 | 153 × 10−5±0.04 | 246.7±8.91 |
| 36B10 shNeg | 66.2 × 10⁻⁴±0.03 | 250.2±47.87 |
| 36B10shPrx2.2 | 67.5 × 10⁻⁴±0.02 | 295±53.71 |
Decreasing Prx II expression alters intracellular ROS and extracellular H2O2
Hydrogen peroxide is generated constitutively during metabolic processes. Experimental evidence suggests that intracellular H2O2 levels are tightly controlled due to their involvement in vital cellular processes such as growth, differentiation, and cell death. We hypothesized that decreasing Prx II would lead to elevated levels of intracellular ROS. To test this hypothesis, the oxidizable probe, DCFH-DA, was used to examine the redox environment of the glioma cells. C6 cells in which Prx II was decreased (shPrx2.3) did not exhibit increased DCF fluorescence when compared to control cells, shNeg (Fig. 2A). However, 36B10 cells in which Prx II was knocked down (shPrx2.2) demonstrated a significant (p<0.05) 1.3–fold increase in intracellular ROS (Fig. 2B). The nonoxidizable control probe, carboxy-DCF (C-369) did not show differences in fluorescence (Fig. 2A–B). Since H2O2 is a diffusible molecule and readily crosses cellular membranes, extracellular H2O2 was determined by oxidation of the Amplex Red reagent to resorufin. A time-dependent increase in formation of resorufin was detected in both C6 and 36B10 cells. There was a significant difference (p<0.001) in resorufin formation between shNeg and shPrx2 cell lines at 24 h in C6 and 36B10 cells (Fig. 2C). These data suggest that decreasing Prx II expression is associated with increased extracellular levels of H2O2.
Fig. 2.

Decreasing Prx II expression alters intracellular ROS and extracellular H2O2. Intracellular ROS generation was examined using the oxidizable probe, DCFH-DA in C6 shPrx2.3 and 36B10 shPrx 2.2 cells. C6 shPrx2.3 cells did not exhibit significant alteration in DCF fluorescence (A). 36B10 glioma cells exhibited increased DCF fluorescence when compared to control cells (B). The control non-oxidizable probe, C-369, was not altered for any of the cells (A and B). Extracellular H2O2 was determined using the Amplex Red reagent which is oxidized to resorufin and examined every 3 h over a period of 24 h. Data were normalized to their respective 1 h values. Closed squares (■) represent shNeg and open squares (□) represent shPrx2 cells for the respective cell lines. Significant increases in resorufin formation were detected at 24 h in C6 shPrx2.3 cells and 36B10. Significance was determined using student’s t-test (A–B) and Two-Way ANOVA (C) where p < 0.05 (*), p ≤ 0.01 (**), p ≤ 0.001 (***).
Exogenous H2O2 increases intracellular ROS
To determine the effect of exogenous H2O2 on the redox environment following Prx II knockdown, cells were treated with 100 µM of H2O2. Both C6 shPrx2.3 cells and 36B10 shPrx2.2 cells showed significant increases in DCF fluorescence when compared to control cells (Fig. 3A and 3B, p <0.01 and p < 0.05, respectively). No differences in fluorescence were found using the control probe, C-369 (Fig. 3A–B). These results show evidence of increased intracellular ROS; we hypothesized that elevated H2O2 levels would oxidize the cellular Prxs. To determine whether this occurred, cells expressing control or Prx II shRNA were either sham-irradiated or irradiated with 10 Gy of 137Cs γ rays and analyzed by western blot for hyperoxidized Prxs. Cells expressing shPrx2 had constitutively higher levels of hyperoxidized Prxs when compared to control cell lines (Fig. 3C). Moreover, the radiation-induced increase in hyperoxidized Prxs appeared to be greater in the shPrx2 expressing cells than that seen in the shNeg cells. Collectively, these data indicate that decreasing Prx II expression in glioma cells results in a more oxidized environment.
Fig. 3.

Exogenous H2O2 increases intracellular ROS generation. Cells were treated with 100 µM H2O2 and intracellular ROS generation was examined by DCF fluorescence in C6 (A) and 36B10 (B) cells; increases were observed in the shPrx2 cell lines. No alterations were detected using the non-oxidizable probe (A–B) for C6 and 36B10 cell lines, respectively. Western blot analysis was used to detect inactive hyperoxidized Prxs. Cells were either sham irradiated or irradiated with 10 Gy and probed for protein expression 24 h following IR. Immunoblots show an elevation in hyperoxidized Prxs in shPrx2 cells when compared to shNeg controls and levels were furthered elevated following IR (C). Representative blot of two independent experiments. Significance was determined using the student’s t-test where p < 0.05 (*), p ≤ 0.01 (**), p ≤ 0.001 (***).
Knocking down Prx II expression sensitizes glioma cells to oxidative stress
To determine whether inhibition of Prx II would sensitize glioma cells to oxidative stress, clonogenic survival was assessed following exposure to IR and H2O2. Cells where Prx II was decreased exhibited increased radiosensitivity to doses as low as 1 Gy. The dose enhancement ratio (DER) at 10% survival was 1.4 for C6 cells (Fig. 4A) and 1.3 for 36B10 glioma cells (Fig. 4B). Exogenous treatment with (0–100 µM) H2O2 revealed a dose-dependent reduction in cell survival that was more pronounced for both C6 (Fig. 4C) and 36B10 cells (Fig. 4D) in which Prx II expression was reduced. Thus, these data suggest that decreasing Prx II expression does indeed sensitize glioma cells to oxidative stress.
Fig. 4.
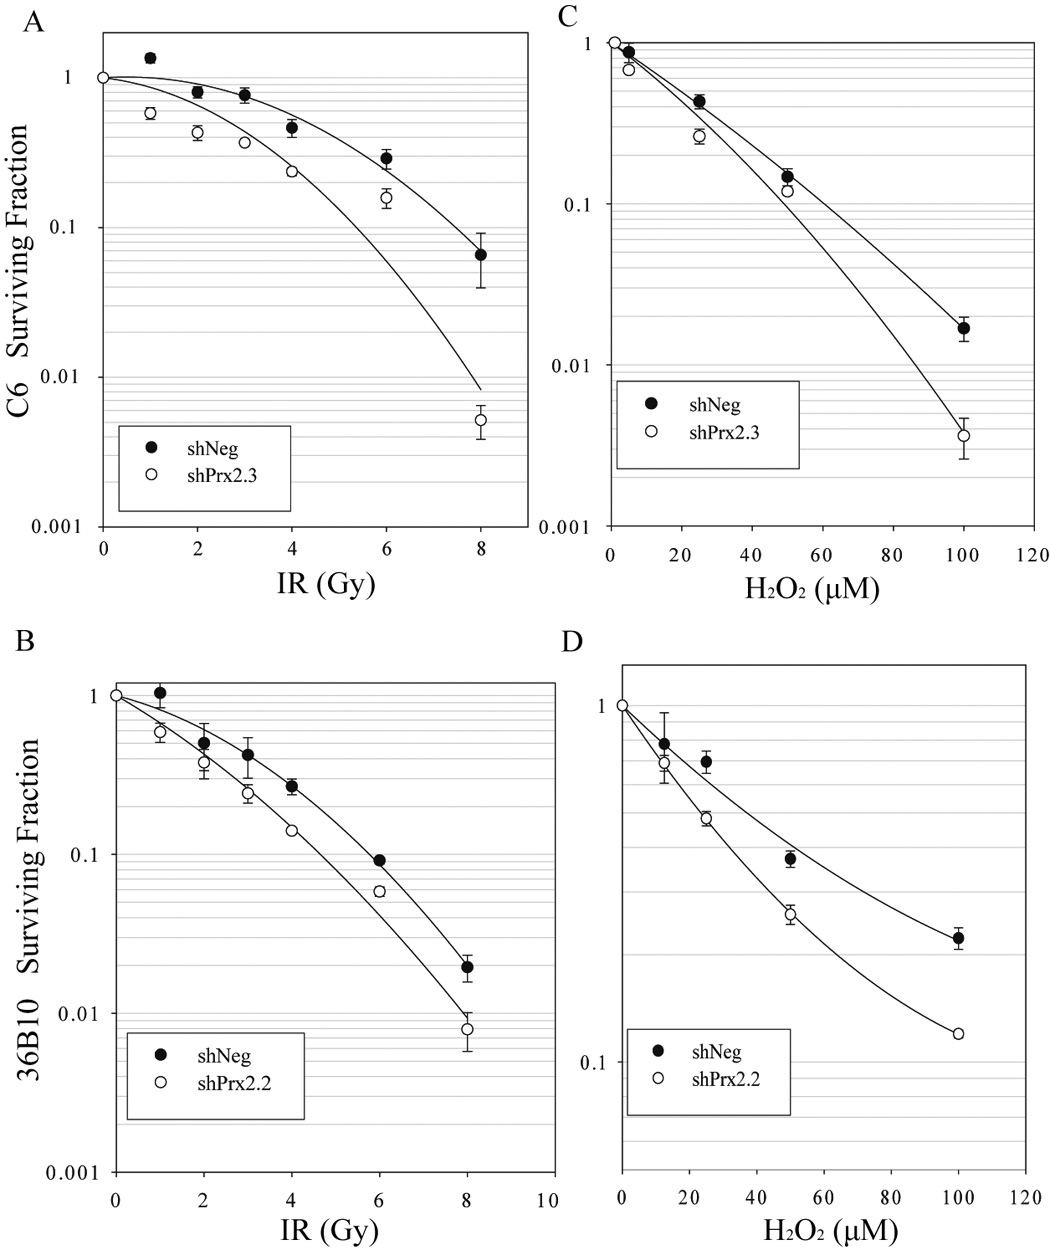
Knocking down Prx II expression sensitizes glioma cells to oxidative stress. Sensitivity to oxidative stress was determined using clonogenic cell survival assays following treatment with 0–8 Gy doses of radiation or 0- 100 µM H2O2. Knocking down Prx II in C6 (A) and 36B10 (B) revealed increased glioma cell sensitivity to radiation. Increased sensitivity to H2O2 was also demonstrated in C6 (C) and 36B10 cells (D). Data are mean ± SE, n = 3
Knocking down Prx II does not alter DNA repair kinetics
Enhanced DNA repair is partly responsible for glioma radioresistance. We set out to determine whether increased oxidative stress engendered by inhibition of Prx II alters repair kinetics leading to glioma sensitization to IR by examining phosphorylation and dephosphorylation of γ-H2AX. DNA damage elicited by either IR or chemotherapy produces double strand breaks (DSBs) in DNA. At these loci, γ-H2AX becomes phosphorylated on Serine 319; when the DNA DSBs have been resolved, γ-H2AX is dephosphorylated. To test whether knocking down Prx II expression affected repair kinetics, cells were treated with a single dose of 5 Gy and collected at various times following IR. Phosphorylation of γ-H2AX was detected within 30 minutes following treatment; dephosphorylation of γ-H2AX was evident 6 h after IR indicating that DSBs had been repaired. No significant differences in repair kinetics were observed between cells expressing control shRNA or Prx II shRNA in 36B10 (Fig. 5) and C6 cells (data not shown). These data suggest that changes in DNA repair kinetics are not responsible for the reduction in clonogenic cell survival seen in Prx II knockdowns following IR.
Fig. 5.
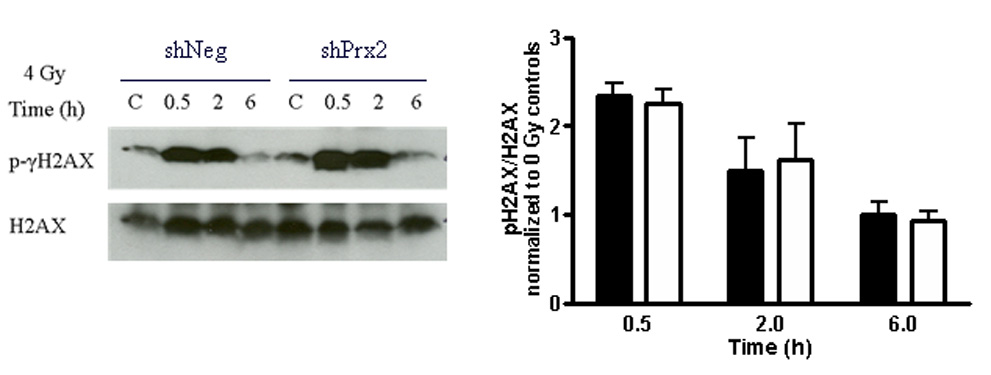
Knocking down Prx II does not alter DNA repair kinetics. 36B10 glioma cells were treated with 0 or 5 Gy and collected at 0.5, 2, and 6 h. Controls denoted as “C” were sham irradiated. Western blot analyses were performed using antibodies to detect phosphorylation of γ-H2AX; total H2AX was used as a loading control. Densitometry was performed and plotted comparing pH2AX to total H2AX. Closed squares (■) represent shNeg and open squares (□) represents shPrx2 cells. Mean ± SE n = 3.
Decreasing Prx II decreases intracellular glutathione and glutathione reductase activity
Intracellular glutathione is traditionally used as an indicator of the cellular redox environment; high GSH/GSSG ratios are indicative of a reduced environment while low ratios are indicative of more oxidizing environments (58). To test whether inhibition of Prx II and the concomitant increase in intracellular and extracellular ROS influenced glutathione content, reduced and oxidized glutathione were analyzed. Intracellular levels of reduced GSH were significantly lower in C6 shPrx2.3 (p<0.05) and in 36B10 shPrx2.2 cells (p<0.001) when compared to their respective shNeg controls (Fig. 6A–B). In contrast, intracellular levels of oxidized GSSG levels were essentially the same in the C6 shPrx2.3 cells (0.17 ± 0.01) when compared to shNeg cells (0.18 ± 0.03) (Supplementary Fig. 2A). The intracellular GSH:GSSG ratio was lower in C6 shPrx2.3 glioma cells when compared to shNeg controls, but not significantly different (p= 0.06; Supplementary Fig. 2B). However, intracellular levels of oxidized GSSG were below detection capacity in 36B10 cell lines. Since oxidized GSSG is often exported from cells keeping intracellular GSSG levels low (59, 60), extracellular GSH and GSSG in the media was analyzed. No difference in extracellular GSH (shNeg: 6.06 ± 1.18; shPrx2.3: 5.89 ± 0.32) or GSSG (shNeg: 4.95 ± 0.72; shPrx2.3: 4.35 ± 0.15) was observed in the C6 cell lines (Supplementary Fig 2C). Again, extracellular GSH and GSSG were not detected in the media of 36B10 cell lines. These data show that inhibiting Prx II leads to decreased levels of intracellular GSH. Oxidized GSSG is reduced to GSH by the antioxidant enzyme, GR. To determine whether GR activity was responsible for the decreased levels of intracellular GSH, GR activity assays were performed. Data revealed a 1.8-fold decrease in GR activity in C6 shPrx2.3 (p<0.001; Fig. 6C) and a 1.6-fold decrease in 36B10 shPrx2.2 (p<0.05; Fig. 6D) cells when compared to their respective controls. These data provide a potential mechanistic explanation for the lower intracellular GSH.
Fig. 6.

Decreasing Prx II decreases intracellular glutathione and glutathione reductase activity. Alterations in intracellular levels of reduced (GSH) glutathione were determined in 36B10 and C6 glioma cell lines (A–B respectively). Intracellular GSSG was not detectable in 36B10 glioma cells. A decrease in GR activity was detected in C6 shPrx 2.3 (C) and 36B10 shPrx2.2 (D) when compared to their respective controls. Significance was determined using the student’s t-test where p < 0.05 (*), p ≤ 0.01 (**), p ≤ 0.001 (***).
Decreasing Prx II increases glioma cell cycle doubling times and alters cell cycle distribution
Regulation of the cell cycle is intricately linked to cellular redox status. Of interest, qualitative differences in proliferation were noted during cell culture maintenance of the Prx II knockdown glioma cells. Therefore, to determine whether decreasing Prx II alters cell proliferation, a doubling time assay was employed. In C6 cells, the mean doubling times for shNeg controls were 27.5 ± 1.4 h and 36 ± 4.6 h for shPrx2.3 cells (Fig. 7A; p <0.05). Similarly, doubling times for 36B10 cells were 26 ± 1.9 for shNeg and 34.5 ± 4.5 h for shPrx2.2 cells (Fig. 7A; p < 0.001). To determine whether knocking down Prx II altered proliferation, flow cytometry was performed to examine cell cycle distribution. Knocking down Prx II in C6 glioma cells resulted in significant differences in the proportion of cells in the G1 (p < 0.001) and S phases (p<0.01) of the cell cycle when compared to controls cells. C6 shPrx2.3 cells had 65.0 ± 0.4% and 30.2 ± 0.5% of cells distributed in G1 and S phase compared to 57.5 ± 0.1% and 37.1 ± 1.0% of control cells, respectively. There were no significant differences in the G2 phase of cell cycle. In contrast, cell cycle analysis showed that the percentage of cells in S-phase was similar for both 36B10 shNeg and shPrx2.2 cell lines (Fig 7B–C). However, there were significantly fewer cells in G1 (38 % ± 1.03) and significantly more cells in G2 (45% ± 4.12) in the shPrx2.2 cells compared to shNeg cells (G1: 63% ± 0.9 S: 17 % ± 2.45 G2/M: 20% ± 2.28). The control cell line, shNeg, displayed a similar distribution of cells in all phases of the cell cycle as that of the parental cell line (data not shown). Thus, knocking down Prx II in C6 and 36B10 altered cell cycle distribution which appears to be mediated by different mechanisms in the two cell lines. To further evaluate whether knocking down Prx II expression synchronizes 36B10 cells in G2/M phase of the cell cycle, activation of Cdc2 (Cdk1) was determined using antibodies detecting phosphorylation of Cdc2 at Thr 161. We observed that shPrx2.2 cells exhibited increased phosphorylation at Thr 161 when compared to shNeg controls cells indicating that more cells were in the G2 phase of the cell cycle (Fig. 7D). These findings suggest that knocking down Prx II is associated with alterations in cell cycle kinetics.
Fig. 7.

Decreasing Prx II increases glioma cell cycle doubling times and alters cell cycle distribution. Cell cycle times were determined using doubling time assays and found to be longer in C6 shPrx2.3 and 36B10 shPrx2.2 cells when compared to their shNeg controls. Knocking down Prx II expression alters cell cycle distribution (A). Cell cycle distribution was analyzed by flow cytometry of propidium iodide stained nuclei and displayed as representative histograms of C6 and 36B10 stable cell lines expressing shNeg and shPrx2 (B–C). As an indicator of cell cycle distribution, activation of Cdc2 in 36B10 cells was assessed by western blot analysis detecting phosphorylation of Cdc2 on Thr 161 (D). Significance was determined using the student’s t-test where p < 0.05 (*), p ≤ 0.01 (**), p ≤ 0.001 (***)
Discussion
Gliomas are extremely refractory to IR and chemotherapy. Despite significant advances, median patient survival remains only 14.6 months with optimal therapy (1, 2, 61). We hypothesized that this resistance is due, in part, to altered levels of antioxidant enzymes. We have previously shown that catalase is overexpressed in glioma cells and that this overexpression contributes to their radioresistance; inhibiting catalase expression sensitized glioma cells to oxidative stress (6). We now report that Prx II, a cytosolic peroxide and peroxynitrite-scavenging antioxidant enzyme, is also overexpressed in human and rat glioma cell lines, and that knocking down Prx II expression leads to an increase in radiosensitivity.
Peroxiredoxins appear overexpressed in numerous solid tumors (11–17). Moreover, Prx I and Prx II expression is induced following irradiation of colon and head-and-neck cancer cell lines, respectively, contributing to their resistance to IR (47). These data suggest that overexpression of Prxs protects cancer cells from oxidative stress. Since cancer cells have elevated ROS production, overexpression of Prx II may provide additional protection against ROS generated from the increased metabolism of glioma cells. Importantly, several studies indicate that expression of Prxs contributes to resistance to IR and chemotherapy (47, 48, 62). Proteomic analysis by Odreman et al. showed that both Prx I and Prx VI expression were further increased in high grade gliomas when compared to low grade gliomas suggesting a prognostic role for Prx I and Prx VI (28). However, Prx II expression was generally conserved during progression from low to high grade glioma (28). These data suggest that overexpression of Prx II may provide additional defense against ROS contributing to glioma cell resistance to anticancer therapies.
In this study, we used shRNA to stably knock down Prx II expression in glioma cell lines. Knocking down Prx II did not decrease cell viability (data not shown). This was not unexpected; Prx II knock-out mice are viable and generally healthy, although they are vulnerable to oxidative stress and often present with hemolytic anemia (63). We proposed that knocking down Prx II would lead to increased intracellular ROS, thereby increasing glioma cell sensitivity to oxidative stimuli. Indeed, we observed an increase in constitutive levels of intracellular ROS in 36B10 shPrx2.2 cells when compared to shNeg cells. However, an increase in intracellular ROS was not detected in C6 glioma cells expressing Prx II shRNA. This was not surprising since the presence of increased intracellular ROS is not required for susceptibility to oxidative stress. Of interest, both cell types exhibited significantly elevated levels of intracellular ROS when treated with exogenous H2O2 as compared with their respective controls. We proposed that these differential levels of intracellular ROS may be due to the concentration and diffusibility of ROS, scavenging of ROS by other antioxidant enzymes and/or cellular antioxidants. In order to determine if intracellular H2O2 diffused across the plasma membrane, we examined extracellular H2O2. We found a time-dependent increase in extracellular H2O2 levels that was significantly higher in C6 and 36B10 cells expressing Prx II shRNA.
Cell growth and survival are dependent upon reduced environments since oxidizing environments may lead to oxidation and inactivation of protein and cellular macromolecules, disrupting signaling pathways (19, 20, 64, 65). Altering the expression of one antioxidant enzyme may influence the expression of other antioxidant enzymes as compensatory mechanisms in order to sustain a reduced redox environment. Therefore, we examined whether knocking down Prx II expression altered the expression of other antioxidant enzymes as well as cellular antioxidants. Prx IV, Prx V, and Prx VI were not investigated in this study; these enzymes are either localized to remote cellular compartments, i.e., plasma and peroxisomes or are not members of the “typical” 2-Cys Prxs. However, Prx III was investigated given that mitochondria are a major source of cellular ROS. Western blot analysis showed that the expression of cytosolic Prx I and mitochondrial Prx III was not altered by inhibition of Prx II. The protein and/or enzymatic activity of additional primary antioxidant enzymes (i.e. catalase, GPx, CuZnSOD, and MnSOD) were also unchanged. Similarly, GPx, catalase, and MnSOD levels were unchanged in Prx VI knockout mice suggesting that other antioxidant enzymes could not compensate for this loss of Prx VI (66). Reactive oxygen species are capable of inactivating proteins by oxidizing cysteine residues on proteins, particularly Prxs (42, 43, 45, 46). Interestingly, we found an increase in the proportion of Prxs that were hyperoxidized in cells where Prx II was knocked down. Although inhibition of Prx II did not have a significant effect on the antioxidant enzymes in the glioma cells analyzed, there were apparent indications of increased oxidative stress.
We hypothesized that knocking down Prx II would sensitize the glioma cells to anticancer therapies mediated via oxidative stress. Indeed, we observed that knocking down Prx II sensitized glioma cells to H2O2 and IR. The latter is of interest, since IR is one of the primary treatment modalities for gliomas. Indeed, the radiosensitization observed in these current studies was seen after in vitro administration of clinically relevant doses of 1–2 Gy.
When we examined possible mechanisms responsible for the increased sensitivity to oxidative stress, we observed no difference in the rate of DNA repair in the shPrx2 cells compared with the shNeg cells. Knocking down Prx II did not delay or alter phosphorylation or dephosphorylation of γ-H2AX following IR indicating that DNA repair pathway is not responsible for increased sensitivity to oxidative stress when Prx II is knocked down. However, shPrx2 cells displayed increased doubling times when compared to control, shNeg cells. Cell cycle analysis revealed that C6 shPrx2.3 glioma cells had significantly fewer cells in S phase and significantly more cells in G1 phase when compared to control shNeg cells. These data suggest that knocking down Prx II in C6 alters cell proliferation. Interestingly, knocking down Prx II in C6 cells did not lead to increased intracellular ROS until treated with an exogenous source of ROS. However, 36B10 shPrx2.2 glioma cells demonstrated elevated intracellular ROS and a further increase when treated with exogenous H2O2. Excessive intracellular ROS may influence cell distribution within the cell cycle. Similarly, the cell’s response to oxidative stimuli may be dependent on its position within the cell cycle. S-phase human fibroblast underwent apoptosis when exposed to H2O2, while cells exposed in G1 and G2/M phases exhibited growth arrest (67).
No significant alteration in the distribution of 36B10 shPrx2.2 cells in S-phase was observed. However, there was significantly greater numbers of these cells in the G2/M phase of the cell cycle when compared to control, shNeg cells. Moreover, western blot analysis revealed that the G2/M, cyclin dependent kinase Cdk1/Cdc2 exhibited increased phosphorylation at Threonine 161 in shPrx2 cells, further evidence of a Prx II knockdown-mediated accumulation of cells in the G2M phase. These findings confirm earlier observations by Han et al. who reported that MEFs from Prx II knockout mice displayed an accumulation of cells in the G2/M phase of the cell cycle while also displaying increased levels of ROS (68). It is now recognized that a redox cycle exists within the cell cycle (69–71). Menon et al. demonstrated that ROS are required for the G1 to S phase transition whereas treatment with the antioxidant, NAC, induced a G1 arrest in fibroblasts (72). Further, ROS interfere with cell cycle regulatory proteins (73), and treatment with exogenous ROS is capable of synchronizing cells in the G2 phase of cell cycle (74). Moreover, Chang et al. demonstrated that Cdc2 directly interacts with and phosphorylates 2-Cys Prxs at a threonine residue decreasing the peroxidase activity of Prxs (75). Cdc2 activity was shown to be the highest during mitosis (76, 77). Hyperoxidation of Prx I and Prx II was not demonstrated during mitosis even in the presence of elevated ROS (78, 79) suggesting that cell cycle progression is coordinately regulated by ROS.
To further evaluate whether knocking down Prx II expression alters the redox status leading to increased sensitivity to oxidative stress, GSH content was examined. Glutathione is vital in maintaining the cell’s redox state. Glutathione not only directly scavenges ROS, reactive nitrogen species, and reactive metabolites but also serves as an important cofactor in enzymatic redox reactions (58–60, 80–83). Our data show that knocking down Prx II decreased intracellular levels of GSH in both cell types analyzed. Although, there were no differences in the level of intracellular GSSG in the C6 glioma cell lines, the GSH/GSSG ratio was lower in C6 glioma cells where Prx II expression was knocked down. However, intracellular GSSG was not detectable in 36B10 glioma cell lines harboring either control or Prx II shRNA. This may reflect several events; GSSG is often effluxed from cells, contributing to a net loss in GSH. Secondly, there is evidence that GSH levels are markedly lower in cells that are exposed to oxidative stress, nutrient starvation, and pathological conditions (81, 82). Thirdly, oxidized proteins are often glutathionylated, thereby sequestering free GSH in mixed protein disulfides (83).
Intracellular GSH is maintained by several mechanisms, including de novo synthesis by the enzymes, γ-glutamylcysteine synthetase and glutathione synthetase (80–81) as well as reduction of GSSG to GSH by GR (80, 84). Intracellular glutathione is also affected by other redox couples, namely NADP+/NADPH and thioredoxin. We propose that the decline in cellular glutathione reported here is partially responsible for the increased sensitivity to oxidative stress discussed above. The decline in cellular glutathione may reflect decreased GR activity. Oxidative and nitrosative stresses are known to inactivate numerous enzymes including GR (84, 85); inactivation of GR occurs by oxidation of its active site cysteine (84). Indeed, we confirmed previous observations that cells expressing Prx II shRNA exhibit reduced GR activity.
A caveat to our experimental approach is that it lacks a transient system, utilizing stable cell lines where Prx II is knocked down for extended periods of time allowing the cells to adapt and alter the redox environment. Interestingly, there were no alterations in the activities and/or expression of other antioxidant enzymes. However, the relatively high expression of other Prxs such as Prx I may sufficiently scavenge surplus peroxides in the absence of Prx II as evidenced by increased oxidation of total Prxs. In vitro analysis suggests that knocking down Prx II sensitizes C6 and 36B10 glioma cells to IR and H2O2 and that the mechanism responsible is due, in part, to increased oxidative stress and reduced cellular GSH. In 36B10 cells, it appears that redistribution of cells to G2/M, the most radiosensitive phase of the cell cycle, may also play a role in the added cytotoxicity. Several studies suggest that ROS and oxidative stress regulates cell cycle often synchronizing cells within different phases (73). Although there is no evidence that GR directly alters cell cycle; GSH does play an important role in cell cycle progression. Conour et al. have demonstrated that GSH content fluctuates during the cell cycle; the highest levels of GSH were found in G2 and M phases, intermediate levels in S phase, and least in G1 phase of cell cycle (86). Several studies have shown an elevation in GSH levels upon reentry into the cell cycle implicating GSH importance for DNA synthesis (87–88). Therefore, altering intracellular levels of GSH may influence the cell cycle by antagonizing the effects of ROS (19–27).
In summary, we have shown that decreasing Prx II expression in glioma cells increases in vitro sensitivity to IR and H2O2. Evidence of increased oxidative stress included increased intracellular and extracellular ROS, decreased cellular GSH, and increased oxidation of Prxs. Importantly, knocking down Prx II sensitized glioma cells to IR at clinically relevant doses as low as 1 Gy. Additionally, decreasing Prx II decreased cellular GSH and GR activity suggesting a possible mechanism for the observed sensitization. Decreasing Prx II also led to a significant increase in cell cycle doubling times with less cells distributed to S-phase in C6 glioma cells and more cells redistributed to the most radiosensitive phase of cell cycle, G2/M, in 36B10 glioma cells. Of the two antioxidant enzymes we have manipulated in gliomas (Prx II in this study and catalase in our previous study; (6)), it appears that decreasing Prx II may provide better radiosensitization, by virtue of showing responses at lower doses of IR and decreasing in vitro growth. Since the treatment of gliomas typically involves multimodality therapies, it is possible that inhibiting both these hydroperoxide scavenging enzymes may provide added clinical benefits when used in combination with IR for the treatment of gliomas.
Supplementary Material
Fig. 1S. Decreasing Prx II in 36B10 rat glioma cells does not alter SOD immunoreactive protein or activity. Western blot and densitometry analysis reveal that protein levels of the antioxidant enzymes CuZnSOD and MnSOD were not altered in 36B10 glioma cells expressing either shPrx2 or shNeg (1SA). Mean ± SE; n = 3. Similarly, SOD activities were not altered in either shNeg or shPrx2 expressing glioma cells (B). Experiments were performed in triplicates and are representative of two independent experiments.
Fig. 2S. Decreasing Prx II does not alter extracellular levels of glutathione. Alterations in intracellular levels of oxidized (GSSG) glutathione were measured in C6 glioma cells (A) Intracellular of levels of GSSG was not detected in 36B10 glioma cells. (B) The GSH/GSSG ratio was determined for C6 cell lines (B). Extracellular GSH and GSSG levels measured in the media of C6 Prx II stable cell lines were not altered (C). Extracellular GSH and GSSG were undetectable in 36B10 glioma cells. Data are Mean ± SE, n = 3.
Acknowledgments
This work was supported by NIH grants CA110274 (PS), CA112593 (MER), GM050389 (LBP), CA086862 and CA100045 (DRS). We would like to extend special thanks to Mitchell C. Coleman (University of Iowa) for analysis of cellular glutathione content and for technical assistance.
Footnotes
Publisher's Disclaimer: This is a PDF file of an unedited manuscript that has been accepted for publication. As a service to our customers we are providing this early version of the manuscript. The manuscript will undergo copyediting, typesetting, and review of the resulting proof before it is published in its final citable form. Please note that during the production process errors may be discovered which could affect the content, and all legal disclaimers that apply to the journal pertain.
References
- 1.Chamberlain MC, Kormanik PA. Practical guidelines for the treatment of malignant gliomas. West .J Med. 1998;168:114–120. [PMC free article] [PubMed] [Google Scholar]
- 2.Stupp R, Mason WP, van den Bent MJ, Weller M, Fisher B, Taphoorn MJ, Belanger K, Brandes AA, Marosi C, Bogdahn U, Curschmann J, Janzer RC, Ludwin SK, Gorlia T, Allgeier A, Lacombe D, Cairncross JG, Eisenhauer E, Mirimanoff RO. Radiotherapy plus concomitant and adjuvant temozolomide for glioblastoma. N. Engl. J. Med. 2005;352:987–996. doi: 10.1056/NEJMoa043330. [DOI] [PubMed] [Google Scholar]
- 3.Taghian A, Suit H, Pardo F, Gioioso D, Tomkinson K, DuBois W, Gerweck L. In vitro intrinsic radiation sensitivity of glioblastoma multiforme. Int. J. Radiat. Oncol. Biol. Phys. 1992;23:55–62. doi: 10.1016/0360-3016(92)90543-q. [DOI] [PubMed] [Google Scholar]
- 4.Harrison L, Malyarchuk S. Can DNA repair cause enhanced cell killing following treatment with ionizing radiation? Pathophysiology. 2002;8:149–159. doi: 10.1016/s0928-4680(01)00079-7. [DOI] [PubMed] [Google Scholar]
- 5.Harrison LB, Chadha M, Hill RJ, Hu K, Shasha D. Impact of tumor hypoxia and anemia on radiation therapy outcomes. Oncologist. 2002;7:492–508. doi: 10.1634/theoncologist.7-6-492. [DOI] [PubMed] [Google Scholar]
- 6.Smith PS, Zhao W, Spitz DR, Robbins ME. Inhibiting catalase activity sensitizes 36B10 rat glioma cells to oxidative stress. Free Radic. Biol. Med. 2007;42:787–797. doi: 10.1016/j.freeradbiomed.2006.11.032. [DOI] [PubMed] [Google Scholar]
- 7.Sun J, Chen Y, Li M, Ge Z. Role of antioxidant enzymes on ionizing radiation resistance. Free Radic. Biol. Med. 1998;24:586–593. doi: 10.1016/s0891-5849(97)00291-8. [DOI] [PubMed] [Google Scholar]
- 8.Preuss M, Girnun GD, Darby CJ, Khoo N, Spector AA, Robbins ME. Role of antioxidant enzyme expression in the selective cytotoxic response of glioma cells to gamma-linolenic acid supplementation. Free Radic. Biol. Med. 2000;28:1143–1156. doi: 10.1016/s0891-5849(00)00210-0. [DOI] [PubMed] [Google Scholar]
- 9.Zhong W, Yan T, Lim R, Oberley LW. Expression of superoxide dismutases, catalase, and glutathione peroxidase in glioma cells. Free Radic. Biol. Med. 1999;27:1334–1345. doi: 10.1016/s0891-5849(99)00181-1. [DOI] [PubMed] [Google Scholar]
- 10.Pu PY, Lan J, Shan SB, Huang EQ, Bai Y, Guo Y, Jiang DH. Study of the antioxidant enzymes in human brain tumors. J. Neurooncol. 1996;29:121–128. doi: 10.1007/BF00182134. [DOI] [PubMed] [Google Scholar]
- 11.Park JH, Kim YS, Lee HL, Shim JY, Lee KS, Oh YJ, Shin SS, Choi YH, Park KJ, Park RW, Hwang SC. Expression of peroxiredoxin and thioredoxin in human lung cancer and paired normal lung. Respirology. 2006;11:269–275. doi: 10.1111/j.1440-1843.2006.00849.x. [DOI] [PubMed] [Google Scholar]
- 12.Lehtonen ST, Svensk AM, Soini Y, Paakko P, Hirvikoski P, Kang SW, Saily M, Kinnula VL. Peroxiredoxins, a novel protein family in lung cancer. Int. J. Cancer. 2004;111:514–521. doi: 10.1002/ijc.20294. [DOI] [PubMed] [Google Scholar]
- 13.Yanagawa T, Ishikawa T, Ishii T, Tabuchi K, Iwasa S, Bannai S, Omura K, Suzuki H, Yoshida H. Peroxiredoxin I expression in human thyroid tumors. Cancer Lett. 1999;145:127–132. doi: 10.1016/s0304-3835(99)00243-8. [DOI] [PubMed] [Google Scholar]
- 14.Brown LM, Helmke SM, Hunsucker SW, Netea-Maier RT, Chiang SA, Heinz DE, Shroyer KR, Duncan MW, Haugen BR. Quantitative and qualitative differences in protein expression between papillary thyroid carcinoma and normal thyroid tissue. Mol. Carcinog. 2006;45:613–626. doi: 10.1002/mc.20193. [DOI] [PMC free article] [PubMed] [Google Scholar]
- 15.Kinnula VL, Lehtonen S, Sormunen R, Kaarteenaho-Wiik R, Kang SW, Rhee SG, Soini Y. Overexpression of peroxiredoxins I, II, III, V, and VI in malignant mesothelioma. J. Pathol. 2002;196:316–323. doi: 10.1002/path.1042. [DOI] [PubMed] [Google Scholar]
- 16.Noh DY, Ahn SJ, Lee RA, Kim SW, Park IA, Chae HZ. Overexpression of peroxiredoxin in human breast cancer. Anticancer Res. 2001;21:2085–2090. [PubMed] [Google Scholar]
- 17.Khalil AA. Biomarker discovery: a proteomic approach for brain cancer profiling. Cancer Sci. 2007;98:201–213. doi: 10.1111/j.1349-7006.2007.00374.x. [DOI] [PMC free article] [PubMed] [Google Scholar]
- 18.Nordfors K, Haapasalo J, Helen P, Paetau A, Paljarvi L, Kalimo H, Kinnula VL, Soini Y, Haapasalo H. Peroxiredoxins and antioxidant enzymes in pilocytic astrocytomas. Clin. Neuropathol. 2007;26:210–218. doi: 10.5414/npp26210. [DOI] [PubMed] [Google Scholar]
- 19.Finkel T. Oxygen radicals and signaling. Curr. Opin. Cell Biol. 1998;10:248–253. doi: 10.1016/s0955-0674(98)80147-6. [DOI] [PubMed] [Google Scholar]
- 20.Finkel T. Redox-dependent signal transduction. FEBS Lett. 2000;476:52–54. doi: 10.1016/s0014-5793(00)01669-0. [DOI] [PubMed] [Google Scholar]
- 21.Finkel T. Oxidant signals and oxidative stress. Curr. Opin. Cell Biol. 2003;15:247–254. doi: 10.1016/s0955-0674(03)00002-4. [DOI] [PubMed] [Google Scholar]
- 22.Karin M, Shaulian E. AP-1: linking hydrogen peroxide and oxidative stress to the control of cell proliferation and death. IUBMB Life. 2001;52:17–24. doi: 10.1080/15216540252774711. [DOI] [PubMed] [Google Scholar]
- 23.DeYulia GJ, Jr., Carcamo JM. EGF receptor-ligand interaction generates extracellular hydrogen peroxide that inhibits EGFR-associated protein tyrosine phosphatases. Biochem. Biophys. Res. Commun. 2005;334:38–42. doi: 10.1016/j.bbrc.2005.06.056. [DOI] [PubMed] [Google Scholar]
- 24.Gabbita SP, Robinson KA, Stewart CA, Floyd RA, Hensley K. Redox regulatory mechanisms of cellular signal transduction. Arch. Biochem. Biophys. 2000;376:1–13. doi: 10.1006/abbi.1999.1685. [DOI] [PubMed] [Google Scholar]
- 25.Chenc KC, Zhou Y, Xing K, Krysan K, Lou MF. Platelet derived growth factor (PDGF)-induced reactive oxygen species in the lens epithelial cells: the redox signaling. Exp. Eye Res. 2004;78:1057–1067. doi: 10.1016/j.exer.2004.02.004. [DOI] [PubMed] [Google Scholar]
- 26.Sauer H, Wartenberg M, Hescheler J. Reactive oxygen species as intracellular messengers during cell growth and differentiation. Cell. Physiol. Biochem. 2001;11:173–186. doi: 10.1159/000047804. [DOI] [PubMed] [Google Scholar]
- 27.Rhee SG, Bae YS, Lee SR, Kwon J. Hydrogen peroxide: a key messenger that modulates protein phosphorylation through cysteine oxidation. Sci. STKE. 2000;2000:PE1. doi: 10.1126/stke.2000.53.pe1. [DOI] [PubMed] [Google Scholar]
- 28.Odreman F, Vindigni M, Gonzales ML, Niccolini B, Candiano G, Zanotti B, Skrap M, Pizzolitto S, Stanta G, Vindigni A. Proteomic studies on low- and high-grade human brain astrocytomas. J. Proteome Res. 2005;4:698–708. doi: 10.1021/pr0498180. [DOI] [PubMed] [Google Scholar]
- 29.Quan C, Cha EJ, Lee HL, Han KH, Lee KM, Kim WJ. Enhanced expression of peroxiredoxin I and VI correlates with development, recurrence and progression of human bladder cancer. J. Urol. 2006;175:1512–1516. doi: 10.1016/S0022-5347(05)00659-2. [DOI] [PubMed] [Google Scholar]
- 30.Kang SW, Baines IC, Rhee SG. Characterization of a mammalian peroxiredoxin that contains one conserved cysteine. J. Biol. Chem. 1998;273:6303–6311. doi: 10.1074/jbc.273.11.6303. [DOI] [PubMed] [Google Scholar]
- 31.Kang SW, Chae HZ, Seo MS, Kim K, Baines IC, Rhee SG. Mammalian peroxiredoxin isoforms can reduce hydrogen peroxide generated in response to growth factors and tumor necrosis factor-alpha. J. Biol. Chem. 1998;273:6297–6302. doi: 10.1074/jbc.273.11.6297. [DOI] [PubMed] [Google Scholar]
- 32.Rhee SG, Kang SW, Chang TS, Jeong W, Kim K. Peroxiredoxin, a novel family of peroxidases. IUBMB Life. 2001;52:35–41. doi: 10.1080/15216540252774748. [DOI] [PubMed] [Google Scholar]
- 33.Matsumoto A, Okado A, Fujii T, Fujii J, Egashira M, Niikawa N, Taniguchi N. Cloning of the peroxiredoxin gene family in rats and characterization of the fourth member. FEBS Lett. 1999;443:246–250. doi: 10.1016/s0014-5793(98)01736-0. [DOI] [PubMed] [Google Scholar]
- 34.Chae HZ, Uhm TB, Rhee SG. Dimerization of thiol-specific antioxidant and the essential role of cysteine 47. Proc. Natl. Acad. Sci. U S A. 1994;91:7022–7026. doi: 10.1073/pnas.91.15.7022. [DOI] [PMC free article] [PubMed] [Google Scholar]
- 35.Hirotsu S, Abe Y, Okada K, Nagahara N, Hori H, Nishino T, Hakoshima T. Crystal structure of a multifunctional 2-Cys peroxiredoxin heme-binding protein 23 kDa/proliferation-associated gene product. Proc. Natl. Acad. Sci. U S A. 1999;96:12333–12338. doi: 10.1073/pnas.96.22.12333. [DOI] [PMC free article] [PubMed] [Google Scholar]
- 36.Choi HJ, Kang SW, Yang CH, Rhee SG, Ryu SE. Crystal structure of a novel human peroxidase enzyme at 2.0 A resolution. Nat. Struct. Biol. 1998;5:400–406. doi: 10.1038/nsb0598-400. [DOI] [PubMed] [Google Scholar]
- 37.Seo MS, Kang SW, Kim K, Baines IC, Lee TH, Rhee SG. Identification of a new type of mammalian peroxiredoxin that forms an intramolecular disulfide as a reaction intermediate. J. Biol. Chem. 2000;275:20346–20354. doi: 10.1074/jbc.M001943200. [DOI] [PubMed] [Google Scholar]
- 38.Okado-Matsumoto A, Matsumoto A, Fujii J, Taniguchi N. Peroxiredoxin IV is a secretable protein with heparin-binding properties under reduced conditions. J. Biochem. (Tokyo) 2000;127:493–501. doi: 10.1093/oxfordjournals.jbchem.a022632. [DOI] [PubMed] [Google Scholar]
- 39.Mizusawa H, Ishii T, Bannai S. Peroxiredoxin I (macrophage 23 kDa stress protein) is highly and widely expressed in the rat nervous system. Neurosci. Lett. 2000;283:57–60. doi: 10.1016/s0304-3940(00)00910-1. [DOI] [PubMed] [Google Scholar]
- 40.Oberley TD, Verwiebe E, Zhong W, Kang SW, Rhee SG. Localization of the thioredoxin system in normal rat kidney. Free Radic. Biol. Med. 2001;30:412–424. doi: 10.1016/s0891-5849(00)00486-x. [DOI] [PubMed] [Google Scholar]
- 41.Watabe S, Hiroi T, Yamamoto Y, Fujioka Y, Hasegawa H, Yago N, Takahashi SY. SP-22 is a thioredoxin-dependent peroxide reductase in mitochondria. Eur. J. Biochem. 1997;249:52–60. doi: 10.1111/j.1432-1033.1997.t01-1-00052.x. [DOI] [PubMed] [Google Scholar]
- 42.Wood ZA, Poole LB, Karplus PA. Peroxiredoxin evolution and the regulation of hydrogen peroxide signaling. Science. 2003;300:650–653. doi: 10.1126/science.1080405. [DOI] [PubMed] [Google Scholar]
- 43.Wood ZA, Schroder E, Robin Harris J, Poole LB. Structure, mechanism and regulation of peroxiredoxins. Trends Biochem.Sci. 2003;28:32–40. doi: 10.1016/s0968-0004(02)00003-8. [DOI] [PubMed] [Google Scholar]
- 44.Fisher AB, Dodia C, Manevich Y, Chen JW, Feinstein SI. Phospholipid hydroperoxides are substrates for non-selenium glutathione peroxidase. J. Biol. Chem. 1999;274:21326–21334. doi: 10.1074/jbc.274.30.21326. [DOI] [PubMed] [Google Scholar]
- 45.Chang TS, Jeong W, Woo HA, Lee SM, Park S, Rhee SG. Characterization of mammalian sulfiredoxin and its reactivation of hyperoxidized peroxiredoxin through reduction of cysteine sulfinic acid in the active site to cysteine. J. Biol. Chem. 2004;279:50994–51001. doi: 10.1074/jbc.M409482200. [DOI] [PubMed] [Google Scholar]
- 46.Budanov AV, Sablina AA, Feinstein E, Koonin EV, Chumakov PM. Regeneration of peroxiredoxins by p53-regulated sestrins, homologs of bacterial AhpD. Science. 2004;304:596–600. doi: 10.1126/science.1095569. [DOI] [PubMed] [Google Scholar]
- 47.Zhang B, Su Y, Ai G, Wang Y, Wang T, Wang F. Involvement of peroxiredoxin I in protecting cells from radiation-induced death. J. Radiat. Res. (Tokyo) 2005;46:305–312. doi: 10.1269/jrr.46.305. [DOI] [PubMed] [Google Scholar]
- 48.Park SH, Chung YM, Lee YS, Kim HJ, Kim JS, Chae HZ, Yoo YD. Antisense of human peroxiredoxin II enhances radiation-induced cell death. Clin. Cancer. Res. 2000;6:4915–4920. [PubMed] [Google Scholar]
- 49.Bradford MM. A rapid and sensitive method for the quantitation of microgram quantities of protein utilizing the principle of protein-dye binding. Anal. Biochem. 1976;72:248–254. doi: 10.1016/0003-2697(76)90527-3. [DOI] [PubMed] [Google Scholar]
- 50.Beers RF, Jr., Sizer IW. A spectrophotometric method for measuring the breakdown of hydrogen peroxide by catalase. J. Biol. Chem. 1952;195:133–140. [PubMed] [Google Scholar]
- 51.Lawrence RA, Burk RF. Glutathione peroxidase activity in selenium-deficient rat liver. Biochem. Biophys. Res. Commun. 1976;71:952–958. doi: 10.1016/0006-291x(76)90747-6. [DOI] [PubMed] [Google Scholar]
- 52.Oberley LW, Spitz DR. Assay of superoxide dismutase activity in tumor tissue. Methods Enzymol. 1984;105:457–464. doi: 10.1016/s0076-6879(84)05064-3. [DOI] [PubMed] [Google Scholar]
- 53.Griffith OW. Determination of glutathione and glutathione disulfide using glutathione reductase and 2-vinylpyridine. Anal. Biochem. 1980;106:207–212. doi: 10.1016/0003-2697(80)90139-6. [DOI] [PubMed] [Google Scholar]
- 54.Lowry OH, Rosebrough NJ, Farr AL, Randall RJ. Protein measurement with the Folin phenol reagent. J. Biol. Chem. 1951;193:265–275. [PubMed] [Google Scholar]
- 55.Gutterer JM, Dringen R, Hirrlinger J, Hamprecht B. Purification of glutathione reductase from bovine brain, generation of an antiserum, and immunocytochemical localization of the enzyme in neural cells. J. Neurochem. 1999;73:1422–1430. doi: 10.1046/j.1471-4159.1999.0731422.x. [DOI] [PubMed] [Google Scholar]
- 56.Denizot F, Lang R. Rapid colorimetric assay for cell growth and survival. Modifications to the tetrazolium dye procedure giving improved sensitivity and reliability. J. Immunol. Methods. 1986;89:271–277. doi: 10.1016/0022-1759(86)90368-6. [DOI] [PubMed] [Google Scholar]
- 57.Vartak S, Robbins ME, Spector AA. Polyunsaturated fatty acids increase the sensitivity of 36B10 rat astrocytoma cells to radiation-induced cell kill. Lipids. 1997;32:283–292. doi: 10.1007/s11745-997-0035-y. [DOI] [PubMed] [Google Scholar]
- 58.Schafer FQ, Buettner GR. Redox environment of the cell as viewed through the redox state of the glutathione disulfide/glutathione couple. Free Radic. Biol. Med. 2001;30:1191–1212. doi: 10.1016/s0891-5849(01)00480-4. [DOI] [PubMed] [Google Scholar]
- 59.Franco R, Cidlowski JA. SLCO/OATP-like transport of glutathione in FasL-induced apoptosis: glutathione efflux is coupled to an organic anion exchange and is necessary for the progression of the execution phase of apoptosis. J. Biol. Chem. 2006;281:29542–29557. doi: 10.1074/jbc.M602500200. [DOI] [PubMed] [Google Scholar]
- 60.Lash LH. Role of glutathione transport processes in kidney function. Toxicol. Appl. Pharmacol. 2005;204:329–342. doi: 10.1016/j.taap.2004.10.004. [DOI] [PubMed] [Google Scholar]
- 61.Forsyth PA, Cairncross JG. Treatment of malignant glioma in adults. Curr. Opin. Neurol. 1995;8:414–418. doi: 10.1097/00019052-199512000-00002. [DOI] [PubMed] [Google Scholar]
- 62.Chung YM, Yoo YD, Park JK, Kim YT, Kim HJ. Increased expression of peroxiredoxin II confers resistance to cisplatin. Anticancer Res. 2001;21:1129–1133. [PubMed] [Google Scholar]
- 63.Lee TH, Kim SU, Yu SL, Kim SH, Park DS, Moon HB, Dho SH, Kwon KS, Kwon HJ, Han YH, Jeong S, Kang SW, Shin HS, Lee KK, Rhee SG, Yu DY. Peroxiredoxin II is essential for sustaining life span of erythrocytes in mice. Blood. 2003;101:5033–5038. doi: 10.1182/blood-2002-08-2548. [DOI] [PubMed] [Google Scholar]
- 64.Fruehauf JP, Meyskens FL., Jr. Reactive oxygen species: a breath of life or death? Clin. Cancer Res. 2007;13:789–794. doi: 10.1158/1078-0432.CCR-06-2082. [DOI] [PubMed] [Google Scholar]
- 65.Karihtala P, Soini Y. Reactive oxygen species and antioxidant mechanisms in human tissues and their relation to malignancies. Apmis. 2007;115:81–103. doi: 10.1111/j.1600-0463.2007.apm_514.x. [DOI] [PubMed] [Google Scholar]
- 66.Wang X, Phelan SA, Forsman-Semb K, Taylor EF, Petros C, Brown A, Lerner CP, Paigen B. Mice with targeted mutation of peroxiredoxin 6 develop normally but are susceptible to oxidative stress. J. Biol. Chem. 2003;278:25179–25190. doi: 10.1074/jbc.M302706200. [DOI] [PubMed] [Google Scholar]
- 67.Chen QM, Lui J, Merret JB. Apoptosis or senescence like growth arrest: influence cell cycle posiiton, p53, p21, and bax in H2O2 response to human fibroblast. Biochem. J. 2000;347:543–551. doi: 10.1042/0264-6021:3470543. [DOI] [PMC free article] [PubMed] [Google Scholar]
- 68.Han YH, Kim HS, Kim JM, Kim SK, Yu DY, Moon EY. Inhibitory role of peroxiredoxin II (Prx II) on cellular senescence. FEBS Lett. 2005;579:4897–4902. doi: 10.1016/j.febslet.2005.07.049. [DOI] [PubMed] [Google Scholar]
- 69.Takahashi Y, Ogra Y, Suzuki KT. Synchronized generation of reactive oxygen species with the cell cycle. Life Sci. 2004;75:301–311. doi: 10.1016/j.lfs.2003.12.014. [DOI] [PubMed] [Google Scholar]
- 70.Seth D, Rudolph J. Redox control of cell cycle progression via Cdc25 phosphatase (Mih1p) in S. cerevisiae. Cell Cycle. 2006;5:2172–2173. doi: 10.4161/cc.5.18.3252. [DOI] [PubMed] [Google Scholar]
- 71.Menon SG, Goswami PC. A redox cycle within the cell cycle: ring in the old with the new. Oncogene. 2007;26:1101–1109. doi: 10.1038/sj.onc.1209895. [DOI] [PubMed] [Google Scholar]
- 72.Menon SG, Sarsour E, Spitz DR, Higashikubo R, Sturm M, Zhang H, Goswami PC. Redox regulation of the G1 to S phases transition in the mouse embryo fibroblast cell cycle. Cancer Res. 2003;63:2109–2117. [PubMed] [Google Scholar]
- 73.Helt CE, Rancourt RC, Staversky RJ, O'Reilly MA. p53-dependent induction of p21(Cip1/WAF1/Sdi1) protects against oxygen-induced toxicity. Toxicol. Sci. 2001;63:214–222. doi: 10.1093/toxsci/63.2.214. [DOI] [PubMed] [Google Scholar]
- 74.Savitsky PA, Finkel T. Redox regulation of Cdc25C. J. Biol. Chem. 2002;277:20535–20540. doi: 10.1074/jbc.M201589200. [DOI] [PubMed] [Google Scholar]
- 75.Chang TS, Jeong W, Choi SY, Yu S, Kang SW, Rhee SG. Regulation of peroxiredoxin I activity by Cdc2-mediated phosphorylation. J. Biol. Chem. 2002;277:25370–25376. doi: 10.1074/jbc.M110432200. [DOI] [PubMed] [Google Scholar]
- 76.Draetta G. Cdc2 activation: the interplay of cyclin binding and Thr161 phosphorylation. Trends Cell Biol. 1993;3:287–289. doi: 10.1016/0962-8924(93)90001-h. [DOI] [PubMed] [Google Scholar]
- 77.Ducommun B, Brambilla P, Felix MA, Franza BR, Jr., Karsenti E, Draetta G. cdc2 phosphorylation is required for its interaction with cyclin. EMBO J. 1991;10:3311–3319. doi: 10.1002/j.1460-2075.1991.tb04895.x. [DOI] [PMC free article] [PubMed] [Google Scholar]
- 78.Moon JC, Hah YS, Kim WY, Jung BG, Jang HH, Lee JR, Kim SY, Lee YM, Jeon MG, Kim CW, Cho MJ, Lee SY. Oxidative stress-dependent structural and functional switching of a human 2-Cys peroxiredoxin isotype II that enhances HeLa cell resistance to H2O2-induced cell death. J. Biol. Chem. 2005;280:28775–28784. doi: 10.1074/jbc.M505362200. [DOI] [PubMed] [Google Scholar]
- 79.Phalen TJ, Weirather K, Deming PB, Anathy V, Howe AK, van der Vliet A, Jonsson TJ, Poole LB, Heintz NH. Oxidation state governs structural transitions in peroxiredoxin II that correlate with cell cycle arrest and recovery. J. Cell Biol. 2006;175:779–789. doi: 10.1083/jcb.200606005. [DOI] [PMC free article] [PubMed] [Google Scholar]
- 80.Meister A. Glutathione metabolism and its selective modification. J. Biol. Chem. 1988;263:17205–17208. [PubMed] [Google Scholar]
- 81.Lu SC. Regulation of glutathione synthesis. Curr. Top. Cell Regul. 2000;36:95–116. doi: 10.1016/s0070-2137(01)80004-2. [DOI] [PubMed] [Google Scholar]
- 82.Griffith OW. Biologic and pharmacologic regulation of mammalian glutathione synthesis. Free Radic. Biol. Med. 1999;27:922–935. doi: 10.1016/s0891-5849(99)00176-8. [DOI] [PubMed] [Google Scholar]
- 83.Townsend DM, Tew KD, Tapiero H. The importance of glutathione in human disease. Biomed. Pharmacother. 2003;57:145–155. doi: 10.1016/s0753-3322(03)00043-x. [DOI] [PMC free article] [PubMed] [Google Scholar]
- 84.Becker K, Savvides SN, Keese M, Schirmer RH, Karplus PA. Enzyme inactivation through sulfhydryl oxidation by physiologic NO-carriers. Nat. Struct. Biol. 1998;5:267–271. doi: 10.1038/nsb0498-267. [DOI] [PubMed] [Google Scholar]
- 85.Fujii T, Hamaoka R, Fujii J, Taniguichi N. Redox capacity of cells affects inactivation of glutathione reductase by nitrosative stress. Arch. Biochem. Biophys. 2000;378:123–120. doi: 10.1006/abbi.2000.1825. [DOI] [PubMed] [Google Scholar]
- 86.Conour JE, Graham WV, Gaskin HR. A combined in vitro/ bioinformatics investigation of redox regulatory mechanisms governing cell cycle progression. Physiol. Genom. 2004;18:196–205. doi: 10.1152/physiolgenomics.00058.2004. [DOI] [PubMed] [Google Scholar]
- 87.Shaw JP, Chou IN. elevation of intracellular glutathione content associated with mitogenic stimulation of quiescent fibroblasts. J. Cell Phys. 1986;129:193–198. doi: 10.1002/jcp.1041290210. [DOI] [PubMed] [Google Scholar]
- 88.Messina JP, Lawrence DA. Cell cycle progression of glutathione-depleted human peripheral blood mononuclear cells is inhibited at S-phase. J. Immunol. 1989;143:1974–1981. [PubMed] [Google Scholar]
Associated Data
This section collects any data citations, data availability statements, or supplementary materials included in this article.
Supplementary Materials
Fig. 1S. Decreasing Prx II in 36B10 rat glioma cells does not alter SOD immunoreactive protein or activity. Western blot and densitometry analysis reveal that protein levels of the antioxidant enzymes CuZnSOD and MnSOD were not altered in 36B10 glioma cells expressing either shPrx2 or shNeg (1SA). Mean ± SE; n = 3. Similarly, SOD activities were not altered in either shNeg or shPrx2 expressing glioma cells (B). Experiments were performed in triplicates and are representative of two independent experiments.
Fig. 2S. Decreasing Prx II does not alter extracellular levels of glutathione. Alterations in intracellular levels of oxidized (GSSG) glutathione were measured in C6 glioma cells (A) Intracellular of levels of GSSG was not detected in 36B10 glioma cells. (B) The GSH/GSSG ratio was determined for C6 cell lines (B). Extracellular GSH and GSSG levels measured in the media of C6 Prx II stable cell lines were not altered (C). Extracellular GSH and GSSG were undetectable in 36B10 glioma cells. Data are Mean ± SE, n = 3.