

Abstract
Forward dynamic simulation of human movement has the potential to investigate the biomechanical effects of weight loss in obese individuals. However, guidelines for altering body segment inertial parameters (BSIPs) of a biomechanical model to approximate changes that occur with weight loss are currently unavailable. Therefore, the goal of this study was to quantify three-dimensional changes in BSIPs with weight loss. Nineteen Caucasian men of age 43.6 ± 7.5 years (mean ± standard deviation) were evaluated. Body mass and body mass index prior to weight loss were 102.7 ± 3.6 kg and 32.6 ± 3.2 kg/m2, respectively. Both before and after weight loss, magnetic resonance imaging scans were acquired along the length of the body to discriminate muscle, bone, organ, and adipose tissues. Segment masses, center of mass (COM) positions, and radii of gyration were determined from these scans using published tissue densities and established methods. A number of significant changes in BSIPs occurred with the 13.8 ± 2.4 % average weight loss. Mass decreased in all segments. COM position moved distally for the thigh and upper arm, superiorly for the trunk, and inferiorly for the whole body. Radius of gyration, in general, decreased in all segments. The changes in BSIPs with weight loss reported here could be used in forward dynamic simulations investigating the biomechanical implications of weight loss.
Keywords: obesity, segment inertial parameters, weight loss
Introduction
Obesity is a major and growing health concern in the United States (US). In 2004, 31% of adult men in the US were considered obese (Ogden et al., 2006). This percentage has been steadily increasing as the prevalence of obesity in the US doubled between 1980 and 2002 (Ogden et al., 2006). The problem with obesity is its association with numerous health conditions including type-2 diabetes mellitus, high blood pressure, high cholesterol, asthma, and osteoarthritis (Mokdad et al., 2003; Sturmer et al., 2000). As a result, approximately $92 billion, or 6% of the total annual medical expenditures in the US, can be attributed to obesity (Finkelstein et al., 2003).
Perhaps the most direct intervention for avoiding or mitigating obesity-related health conditions is weight loss. Several experimental studies have investigated the effects of weight loss on musculoskeletal function and lower extremity kinetics (Messier et al., 2005; Miller et al., 2006; Teasdale et al., 2007). These studies provide quantitative evidence on the benefits of weight loss for maintaining function and preventing the development and/or progression of obesity-related health conditions. For example, Messier et al. (2005) reported a 4-fold reduction in knee loads during gait with each pound of weight loss in the obese. An alternative approach to these experimental studies investigating the effects of weight loss is to conduct virtual experiments using forward dynamic simulations of human movement. While they should ultimately be validated with experimental studies, forward dynamic simulations can be a cost-effective initial approach for evaluating potential interventions, and offer a greater level of experimental control compared to human subject testing. They can also provide greater understanding of underlying biomechanical mechanisms that contribute to impaired function.
The biomechanical models used in forward dynamic simulations require accurate estimations of body segment inertial parameters (BSIPs) including segment mass, center of mass (COM) position, and segment moment of inertia. To study weight loss with forward dynamic simulations, it is necessary to alter BSIPs to approximate changes that occur with weight loss. However, no information describing how to alter BSIPs is currently available. Based on this need, the goal of this study was to quantify changes in BSIPs with weight loss in obese individuals. The long-term goal of this research effort is to investigate the biomechanical effects of weight loss in obese individuals using forward dynamic simulations.
Methods
Magnetic resonance imaging (MRI) scans from 19 Caucasian males who participated in a separate study on weight loss (Ross et al., 1996) were used for the present study. These subjects had a mean (± standard deviation) age of 43.6 ± 7.5 years, and height 177.3 ± 6.9 cm. Body mass and body mass index (BMI) prior to weight loss were 102.7 ± 13.6 kg and 32.6 ± 3.2 kg/m2, respectively (three of the subjects had a BMI below 30, but above 27.5, prior to weight loss). BSIP changes were not influenced by the mode of weight loss (diet only, diet and aerobic exercise, or diet and resistance exercise), so the data were pooled across these groups for statistical analyses. Details of the weight loss interventions are reported elsewhere (Ross et al., 1996). The study was conducted in accordance with the ethical guidelines of Queen’s University, and all subjects provided written consent before participation.
MRI data were obtained with a General Electric Signa Advantage 1.5-tesla scanner using a T1-weighted spin-echo sequence with a 210-ms repetition time and 17-ms echo time (Ross et al. 1992). Subjects laid in a supine position with arms placed straight above the head. Transverse images (10mm thickness ; 50 mm centers) were initially acquired from the L4-L5 inter-vertebral space to the ankle. Subjects were then required to exit the magnet and re-enter head first to acquire scans from L4-L5 to the wrist.
Tissue discrimination was performed using commercially available medical imaging software (sliceOmatic v4.3, Montreal, Quebec, Canada). Optimal threshold values of pixel brightness for adipose tissue, muscle, organs, and bone were determined using automated procedures with manual correction of obvious artifacts. For each image, tissues were color-coded, and images were exported for subsequent analysis using customized programs in MATLAB (Mathworks, Natick, MA).
A total of six segments were investigated including the forearm, upper arm, trunk, thigh, shank, and whole body (Figure 1). The head, neck, hands, and feet were not included based on the small amount of adipose tissue in these segments compared to other body segments (Kotani et al., 1994), and findings that changes in adipose tissue volume in the head and neck with weight loss are orders of magnitude smaller than those in other body segments (Chowdhury et al., 1993). The head, neck, hands, and feet account for approximately 12% of total body mass (Dempster, 1955), thus “whole body” values presented in this study account for 88% of true body mass. Segment endpoints (except for the trunk) and coordinate systems were defined by Dumas et al. (2007). BSIPs reported for the appendicular segments were averaged across the left and right sides.
Figure 1.
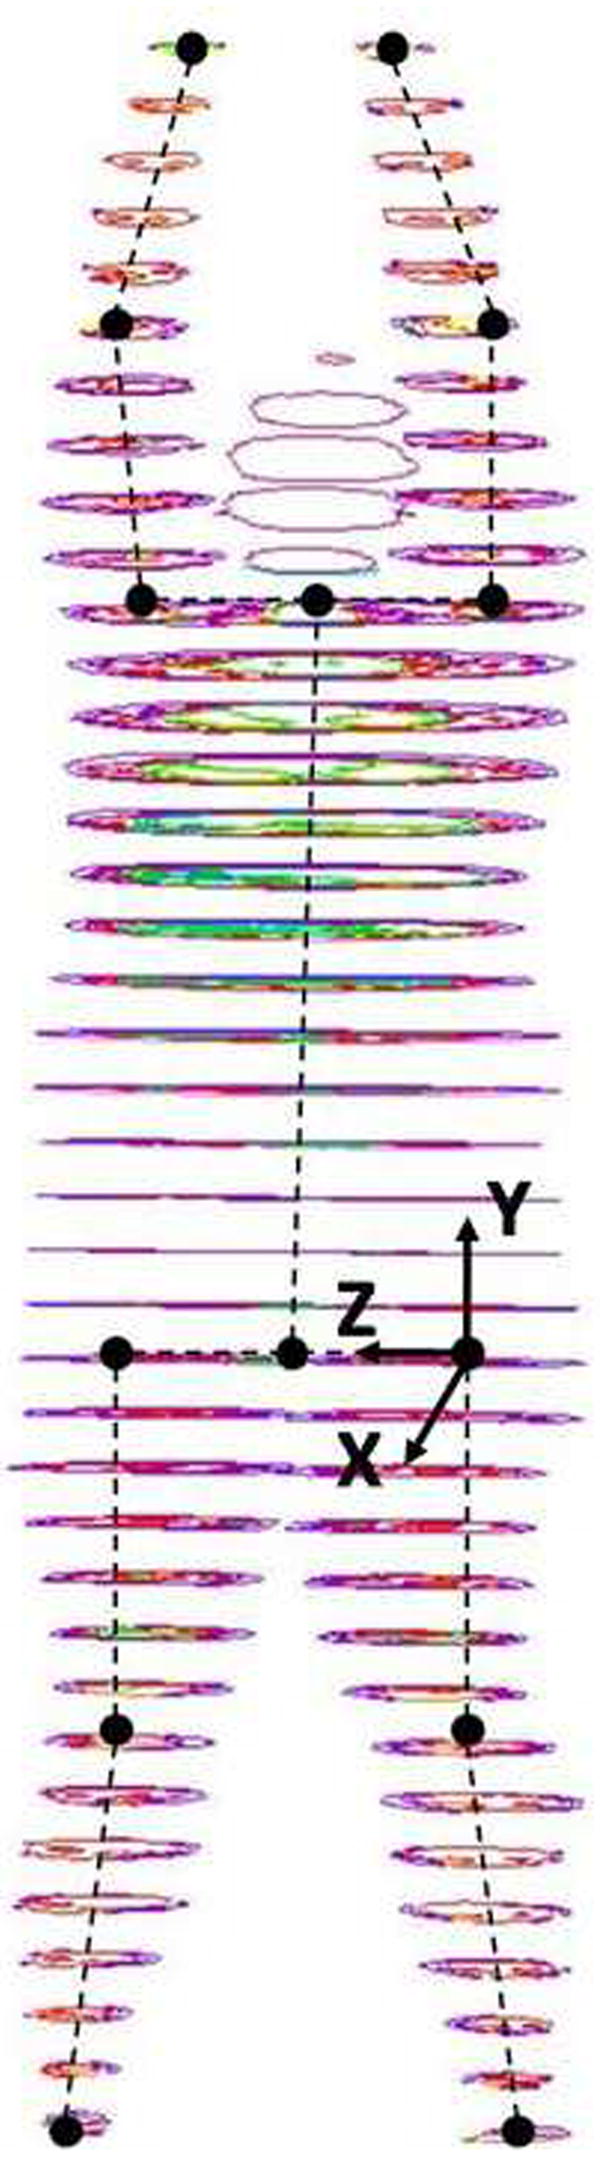
Illustration of MRI scans collected from an obese male with segment endpoints and sample segment coordinate system of the thigh. Segment endpoints for all appendicular segments were joint centers. Segment endpoints for the trunk were the midpoint between the shoulder centers and the midpoint between the hip centers. For all segment coordinate systems, the x-axis corresponded to the anterior-posterior direction of the segment (anterior being positive), the y-axis to the proximal-distal direction of the segment (proximal being positive), and the z-axis to the medial-lateral direction (medial being positive). The origin of all segment coordinate systems was at the proximal endpoint of the segment.
Three-dimensional BSIPs were calculated using methods similar to Pearsall et al. (1994). Tissue densities of 1.178 g/cm3 for muscle, 1.705 g/cm3 for bone, 1.158 g/cm3 for liver, and 0.563 g/cm3 for lung tissue (Erdmann and Gos, 1990; Martin et al., 1989) were used to calculated segment masses. Adipose tissue density was approximated as 0.947 g/cm3, which was an average of the densities of the colon, off-peritoneum, and subcutaneous adipose tissue (Erdmann and Gos, 1990). All other tissues were defined as lean tissue with a density of 1.138 g/cm3, which was an average of densities for blood, vasculature, tendon, stomach, intestines, and heart (Erdmann and Gos, 1990). Mass, COM, and radius of gyration were calculated for each scan and the intervals between scans (40mm) using methods similar to Pearsall et al. (1994). Four 10mm-thick “virtual scans” were created to span this interval, and the inertial properties of these scans were linearly interpolated from the bounding scans.
A Wilcoxon Signed-Rank test was used to analyze changes in BSIPs with weight loss due to non-normal data distributions. The overall Type 1 error rate for the 42 tests performed (6 segments × 7 parameters) was controlled using false discovery rate control. This approach is an alternative to the commonly used Bonferroni procedure and controls the proportion of significant results that are in fact Type 1 errors (Benjamini and Hochberg, 2000) rather than reducing the p-value to prevent one Type 1 error. As a result, false discovery rate control does not suffer from the undesirable lack of statistical power associated with the Bonferroni procedure with an increasing number of tests (Nakagawa, 2004; Verhoeven et al., 2005). The trunk and whole body BSIPs of one subject were excluded from the analysis due to unequal segment lengths before and after weight loss. Statistical analysis was conducted using JMP v6 (Cary, North Carolina, USA).
Results
BSIPs of obese individuals prior to weight loss are reported in Table 1. Subjects lost 14.2 ± 3.4 kg or 13.8 ± 2.4 % of initial body weight with weight loss. This resulted in a 4.5 ± 1.0 decrease in BMI (four subjects still had a BMI > 30 kg/m2 after weight loss). The MRI method estimated that subjects lost 13.9 ± 3.0% body weight, yielding a root mean squared error of 1.9% from actual weight loss.
Table 1.
Body Segment Inertial Parameters of Obese Individuals Before Weight Loss
| Segment | Mass | COMx | COMy | COMz | rx | ry | rz |
|---|---|---|---|---|---|---|---|
| Forearm | 1.52 ± 0.29 | 0.22 ± 1.18 | -47.46 ± 1.25 | 0.30 ± 3.23 | 29.64 ± 1.05 | 14.72 ± 2.62 | 29.51 ± 1.19 |
| Upper Arm | 3.64 ± 0.35 | 0.96 ± 1.20 | -42.37 ± 1.25 | 0.50 ± 1.56 | 30.95 ± 0.54 | 14.92 ± 1.39 | 31.14 ± 0.67 |
| Trunk | 53.50 ± 2.32 | -1.51 ± 1.32 | -52.32 ± 1.47 | 0.11 ± 1.45 | 33.24 ± 0.75 | 20.76 ± 1.43 | 30.80 ± 0.60 |
| Thigh | 13.73 ± 0.94 | -0.55 ± 1.21 | -41.07 ± 0.98 | 0.01 ± 1.07 | 42.88 ± 1.27 | 17.76 ± 1.78 | 43.10 ± 1.30 |
| Shank | 4.40 ± 0.39 | 0.65 ± 0.82 | -42.71 ± 0.93 | -1.19 ± 4.39 | 27.86 ± 0.56 | 11.99 ± 1.19 | 27.80 ± 0.58 |
| Whole Body& | ------ | -1.31 ± 0.54 | -38.52 ± 2.33 | -0.22 ± 0.45 | 19.62 ± 7.05 | 7.05 ± 0.31 | 18.94 ± 1.04 |
Notes: Mass is given in percent of whole body mass. For all segments, COM position and radii of gyration are given in percent of segment length. COM position is referenced from the segment’s origin (Figure 1). For appendicular segments, a positive COMx and COMz indicates the COM was anterior and medial to the longitudinal axis of the segment, respectively.
Whole body does not include head, neck, hands, and feet.
Average changes in segment mass, COM position, and radius of gyration with weight loss are reported in Table 2. Effect sizes and p-values are reported in Table 3. Mass decreased in all segments. COM position moved distally for the thigh and upper arm, superiorly for the trunk, and inferiorly for the whole body. Radius of gyration, in general, decreased in all segments.
Table 2.
Percent Changes in Body Segment Inertial Parameters with Weight Loss
| Segment | Δ Mass | Δ COMx | Δ COMy | Δ COMz | Δ rx | Δ ry | Δ rz |
|---|---|---|---|---|---|---|---|
| Forearm | -9.53 ± 5.99* | -0.05 ± 1.42 | -0.33 ± 1.25 | 0.68 ± 1.21* | -0.08 ± 1.07 | -0.65 ± 1.94* | -0.14 ± 1.19 |
| Upper Arm | -15.68 ± 6.50* | -0.15 ± 1.02 | -0.60 ± 1.01* | 0.32 ± 1.86 | -0.13 ± 0.71 | -1.38 ± 1.18* | 0.00 ± 0.76 |
| Trunk | -15.25 ± 3.99* | 0.36 ± 1.13 | 0.63 ± 0.88* | 0.03 ± 1.49 | -0.54 ± 0.75* | -1.87 ± 1.25* | -0.26 ± 0.63* |
| Thigh | -13.06 ± 2.97* | -0.20 ± 0.95 | -0.75 ± 0.43* | -0.06 ± 0.70 | -0.72 ± 0.93* | -1.80 ± 1.25* | -0.86 ± 0.97* |
| Shank | -7.85 ± 3.01* | -0.50 ± 0.67* | -0.08 ± 0.62 | 0.41 ± 2.43 | -0.06 ± 0.33 | -0.89 ± 0.79* | -0.03 ± 0.36 |
| Whole Body& | -13.91 ± 3.04* | -0.06 ± 0.77 | -0.97 ± 1.77* | 0.01 ± 0.46 | 0.63 ± 0.90* | -0.44 ± 0.19* | 0.71 ± 0.92* |
Notes: Changes in mass are given as percent change from pre weight loss mass. Changes in COM and r are given as percent of segment length. For appendicular segments, a positive ΔCOMx, ΔCOMy, and ΔCOMz indicates the COM moved anteriorly, proximally, and medially, respectively. For the whole body and trunk, a positive ΔCOMy indicates the COM moved superiorly.
Whole body does not include head, neck, hands, and feet.
denotes a significant change with weight loss.
Table 3.
Effect Sizes and p-Values for Changes in Body Segment Inertial Parameters
| Segment | Δ Mass | Δ COMx | Δ COMy | Δ COMz | Δ rx | Δ ry | Δ rz |
|---|---|---|---|---|---|---|---|
| Forearm | 0.2799 (<0.0001)* | -0.0389 (0.9217) | -0.2634 (0.3955) | 0.2102 (0.0108)* | -0.0734 (0.6226) | -0.2499 (0.0181)* | -0.1134 (0.5949) |
| Upper Arm | -0.2367 (<0.0001)* | -0.1267 (0.5153) | -0.4827 (0.0141)* | 0.2031 (0.9843) | -0.2413 (0.4413) | -0.9927 (0.0004)* | 0.0066 (0.6794) |
| Trunk | -0.3711 (<0.0001)* | 0.2756 (0.2121) | 0.4315 (0.0016)* | 0.0232 (0.7019) | -0.7106 (0.0047)* | -1.3137 (<0.0001)* | -0.4361 (0.0342)* |
| Thigh | 0.1637 (<0.0001)* | -0.1616 (0.3124) | -0.7631 (<0.0001)* | -0.0569 (0.6507) | -0.5644 (0.0003)* | -1.0115 (<0.0001)* | -0.6608 (<0.0001)* |
| Shank | 0.8081 (<0.0001)* | -0.6024 (0.0071)* | -0.0913 (0.3525) | 0.0940 (0.4413) | -0.1052 (0.6794) | -0.7499 (<0.0001)* | -0.0612 (0.8906) |
| Whole Body | -1.0433 (<0.0001)* | -0.1109 (0.4683) | -0.4148 (0.0432)* | 0.0269 (1.000) | 0.0888 (0.0003)* | -1.4102 (<0.0001)* | 0.6821 (<0.0001)* |
Notes: p-values are given in parentheses. Effect size was calculated using Cohen’s d, the mean value before weight loss subtracted from the mean value after weight loss, divided by the standard deviation before weight loss.
denotes a significant change with weight loss.
Discussion
The long-term goal of this research effort is to investigate the biomechanical effects of weight loss in obese individuals. Joint and muscle level biomechanical effects of weight loss are nonlinearly related to changes in weight, so they cannot be predicted a priori and must be investigated either experimentally or using forward dynamic simulations. The specific goal of this study was to quantify changes in BSIPs with weight loss. Results showed weight loss changed many BSIPs, primarily due to changes in segment mass and changes in the distribution of mass along the segment’s longitudinal axis.
Some limitations of our study that may impact our estimation of BSIPs warrant discussion. First, the spacing between adjacent MRI scan centers was 50mm, which was larger than the 8-25mm used in other studies that derived BSIPs with MRI (Bauer et al., 2007; Cheng et al., 2000; Martin et al., 1989; Mungiole and Martin, 1990). This larger spacing could contribute to systematic errors in BSIPs primarily through inaccuracies in identification of segment endpoints. We estimate that a segment length error of 90 mm (the maximum possible error in segment length) would correspond to an average of 8.09% and 2.97% of total body mass in the trunk (body segment with the largest mass) and the thigh (representative appendicular body segment). These are non-trivial errors but are well below the observed changes in BSIP values (Table 2). It should also be pointed out that number of scans for each segment was identical before and after weight loss, and calculating changes in BSIPs with weight loss would presumably eliminate the majority of this error.
A second limitation of our study was that the tissue densities were adopted from the literature and assumed to be constant. These densities have known variability that could have influenced our results. The standard deviation of tissue density estimates were 0.041 g/cm3 for muscle, 0.054 g/cm3 for bone, 0.021 g/cm3 for liver, 0.042 g/cm3 for lung tissue, 0.041 g/cm3 for adipose tissue, and 0.046 g/cm3 for other lean tissue (Erdmann and Gos, 1990; Martin et al., 1989). These standard deviations are an average of 4.1% of the actual densities used. Third, subjects were imaged in the supine position. This position likely contributed to some soft tissue deformation compared to the vertical position, which is likely the position of the body in most tasks to be modeled. Fourth, the moments of inertia about the segment coordinate axes were assumed to be the principal moments of inertia. A similar assumption was employed in other studies that derived BSIPs using MRI (Bauer et al., 2007; Cheng et al., 2000; Martin et al., 1989). Fifth, data were only collected from Caucasian male subjects, and therefore results may not be generalizable to other populations.
In conclusion, changes in BSIPs with weight loss were quantified in obese Caucasian males using MRI. These data can be used to investigate the biomechanical effects of weight loss using a biomechanical model and forward dynamic simulations.
Acknowledgments
This work was partially supported by the Wake Forest University Claude D. Pepper Older Americans Independence Center (P30-AG21332). The sponsor had no involvement in the study or manuscript preparation and submission.
Footnotes
Publisher's Disclaimer: This is a PDF file of an unedited manuscript that has been accepted for publication. As a service to our customers we are providing this early version of the manuscript. The manuscript will undergo copyediting, typesetting, and review of the resulting proof before it is published in its final citable form. Please note that during the production process errors may be discovered which could affect the content, and all legal disclaimers that apply to the journal pertain.
References
- Bauer JJ, Pavol MJ, Snow CM, Hayes WC. MRI-derived body segment parameters of children differ from age-based estimates derived using photogrammetry. J Biomech. 2007;40:2904–10. doi: 10.1016/j.jbiomech.2007.03.006. [DOI] [PubMed] [Google Scholar]
- Benjamini Y, Hochberg Y. On the Adaptive Control of the False Discovery Rate in Multiple Testing With Independent Statistics. Journal of Educational and Behavioral Statistics. 2000;25:60–83. [Google Scholar]
- Cheng CK, Chen HH, Chen CS, Chen CL, Chen CY. Segment inertial properties of Chinese adults determined from magnetic resonance imaging. Clin Biomech (Bristol, Avon) 2000;15:559–66. doi: 10.1016/s0268-0033(00)00016-4. [DOI] [PubMed] [Google Scholar]
- Chowdhury B, Kvist H, Andersson B, Bjorntorp P, Sjostrom L. CT-determined changes in adipose tissue distribution during a small weight reduction in obese males. Int J Obes Relat Metab Disord. 1993;17:685–91. [PubMed] [Google Scholar]
- Dempster WT. Space Requirements of the Seated Operator: Geometrical, Kinematic, and Mechanical Aspects of the Body with Special Reference to the Limbs: Technical Report WADC-TR-55-159. Wright Patterson Air Force Base; Ohio: 1955. [Google Scholar]
- Dumas R, Cheze L, Verriest JP. Adjustments to McConville et al. and Young et al. body segment inertial parameters. J Biomech. 2007;40:543–53. doi: 10.1016/j.jbiomech.2006.02.013. [DOI] [PubMed] [Google Scholar]
- Erdmann WS, Gos T. Density of trunk tissues of young and medium age people. J Biomech. 1990;23:945–7. doi: 10.1016/0021-9290(90)90360-f. [DOI] [PubMed] [Google Scholar]
- Finkelstein EA, Fiebelkorn IC, Wang G. National medical spending attributable to overweight and obesity: how much, and who’s paying? Health Aff (Millwood) Suppl Web Exclusives. 2003:W3-219–26. doi: 10.1377/hlthaff.w3.219. [DOI] [PubMed] [Google Scholar]
- Kotani K, Tokunaga K, Fujioka S, Kobatake T, Keno Y, Yoshida S, Shimomura I, Tarui S, Matsuzawa Y. Sexual dimorphism of age-related changes in whole-body fat distribution in the obese. Int J Obes Relat Metab Disord. 1994;18:207–2. [PubMed] [Google Scholar]
- Martin PE, Mungiole M, Marzke MW, Longhill JM. The use of magnetic resonance imaging for measuring segment inertial properties. J Biomech. 1989;22:367–76. doi: 10.1016/0021-9290(89)90051-1. [DOI] [PubMed] [Google Scholar]
- Messier SP, Gutekunst DJ, Davis C, DeVita P. Weight loss reduces knee-joint loads in overweight and obese older adults with knee osteoarthritis. Arthritis Rheum. 2005;52:2026–32. doi: 10.1002/art.21139. [DOI] [PubMed] [Google Scholar]
- Miller GD, Nicklas BJ, Davis C, Loeser RF, Lenchik L, Messier SP. Intensive weight loss program improves physical function in older obese adults with knee osteoarthritis. Obesity (Silver Spring) 2006;14:1219–30. doi: 10.1038/oby.2006.139. [DOI] [PubMed] [Google Scholar]
- Mokdad AH, Ford ES, Bowman BA, Dietz WH, Vinicor F, Bales VS, Marks JS. Prevalence of obesity, diabetes, and obesity-related health risk factors, 2001. Jama. 2003;289:76–9. doi: 10.1001/jama.289.1.76. [DOI] [PubMed] [Google Scholar]
- Mungiole M, Martin PE. Estimating segment inertial properties: comparison of magnetic resonance imaging with existing methods. J Biomech. 1990;23:1039–46. doi: 10.1016/0021-9290(90)90319-x. [DOI] [PubMed] [Google Scholar]
- Nakagawa S. A farewell to Bonferroni: the problems of low statistical power and publication bias. Behav Ecol. 2004;15:1044–1045. [Google Scholar]
- Ogden CL, Carroll MD, Curtin LR, McDowell MA, Tabak CJ, Flegal KM. Prevalence of overweight and obesity in the United States, 1999-2004. Jama. 2006;295:1549–55. doi: 10.1001/jama.295.13.1549. [DOI] [PubMed] [Google Scholar]
- Pearsall DJ, Reid JG, Ross R. Inertial properties of the human trunk of males determined from magnetic resonance imaging. Ann Biomed Eng. 1994;22:692–706. doi: 10.1007/BF02368294. [DOI] [PubMed] [Google Scholar]
- Ross R, Rissanen J, Pedwell H, Clifford J, Shragge P. Influence of diet and exercise on skeletal muscle and visceral adipose tissue in men. J Appl Physiol. 1996;81:2445–55. doi: 10.1152/jappl.1996.81.6.2445. [DOI] [PubMed] [Google Scholar]
- Sturmer T, Gunther KP, Brenner H. Obesity, overweight and patterns of osteoarthritis: the Ulm Osteoarthritis Study. J Clin Epidemiol. 2000;53:307–13. doi: 10.1016/s0895-4356(99)00162-6. [DOI] [PubMed] [Google Scholar]
- Teasdale N, Hue O, Marcotte J, Berrigan F, Simoneau M, Dore J, Marceau P, Marceau S, Tremblay A. Reducing weight increases postural stability in obese and morbid obese men. Int J Obes (Lond) 2007;31:153–60. doi: 10.1038/sj.ijo.0803360. [DOI] [PubMed] [Google Scholar]
- Verhoeven KJF, Simonsen KL, McIntyre LM. Implementing false discovery rate control: increasing your power. Oikos. 2005;108:643–647. [Google Scholar]