The crystal structure of d(CACACG)·d(CGTGTG) was solved to a resolution of 2.05 Å in space group P21.
Keywords: d(CACACG)·d(CGTGTG), Z-DNA
Abstract
The crystal structure of d(CACACG)·d(CGTGTG) was solved to a resolution of 2.05 Å in space group P21. The duplex assumes the left-handed Z-DNA structure. The presence of two A·T base pairs in the hexamer does not greatly affect the conformation. The most significant changes compared with the regular structure of Z-DNA are in the values of twist in the central portion of the helix. This variation, as well as others in the values of roll, inclination etc., follow the pattern observed previously in the structure of d(CGCACG)·d(CGTGCG).
1. Introduction
Oligodeoxyribonucleotides with alternating pyrimidine–purine sequences, particularly alternating cytosine–guanine sequences, are well known to favour the left-handed Z-DNA conformation (Wang et al., 1981 ▶; Fujii et al., 1982 ▶; Gessner et al., 1985 ▶). The presence of A·T base pairs in the sequence makes the conversion of right-handed B-form DNA helices to the left-handed Z-form more difficult. However, the presence of up to 50% A·T base pairs in alternating d(CG)n sequences does not prevent the formation of Z-DNA (Xodo et al., 1989 ▶).
As part of our crystallographic studies on the effect of A·T base pairs on the structure and interhelical interactions of Z-type DNA (Sadasivan & Gautham, 1995 ▶; Thiyagarajan et al., 2004 ▶), we report here the structure of the hexamer with sequence d(CACACG)·d(CGTGTG). This sequence was designed based on the ‘canonical’ Z-DNA hexamer, d(CGCGCG)2, by replacing two C·G base pairs by A·T base pairs. Previous studies from our laboratory (Sadasivan & Gautham, 1995 ▶) had indicated that a stretch of at least four alternating C·G base pairs was required to nucleate a regular form of the Z helix. The structure reported here shows that the regular Z helix may be stabilized even when this condition is not satisfied when cobalt hexammine is used in the crystallization.
2. Materials and methods
The two nonself-complementary stands were purchased from M/s Microsynth, Switzerland. The two strands were annealed to form the duplex by heating an equimolar mixture of the two solutions to 343 K for 30 min and then allowing the mixture to cool to room temperature slowly over 4 h. Crystals were grown at room temperature (293 K) by the hanging-drop vapour-diffusion method. The 4 µl drop contained 1 mM DNA, 50 mM sodium cacodylate buffer pH 7.0, 10 mM cobalt hexammine chloride and 1 mM spermine and was equilibrated against 50% methylpentanediol (MPD) precipitant in the well. Pale yellow hexagonal prisms of dimensions 0.2 × 0.2 × 0.1 mm were obtained after a week.
The intensity data were collected on a MAR Research imaging-plate system at the GNR Laboratory for Structural Biology, Central Leather Research Institute, Chennai, India with 1° rotations of the ϕ axis, 100 mm crystal-to-detector distance and an exposure time of 300 s per frame at room temperature (300 K). The crystal diffracted to a resolution of 2.05 Å. The reflections were indexed using the AUTOMAR program (MAR Research GmbH, Germany). They could be indexed in the following three different space groups with nearly the same values of the reliability indices: P65 (R merge = 4.070), with unit-cell parameters a = b = 17.89, c = 43.50 Å, P32 (R merge = 4.210), with the same unit-cell parameters, and monoclinic P21, with a = 17.85, b = 43.44, c = 17.85 Å, β = 119.9°. Based upon previous analyses of the packing of Z-DNA hexamers (Sadasivan et al., 1994 ▶), we chose the monoclinic space group since this allowed the placement of one complete duplex in the asymmetric unit and avoided problems of disorder. In this system, there are 1316 unique reflections to a resolution of 2.05 Å, with an overall R merge of 2.71% and a completeness of 92.1%. The data and refinement statistics are shown in Table 1 ▶. The structure was solved by molecular replacement using AMoRe (Navaza, 1994 ▶) from the CCP4 suite. The coordinates of d(CGCGCG)2 using the fibre model (Arnott et al., 1980 ▶) generated using INSIGHT II (release 98.0; Biosym/MSI, San Diego, USA) with A·T base pairs replacing G·C base pairs as appropriate were used as the starting model. The molecular-replacement search was performed using data between 15 and 3 Å resolution. Graphical analyses of the model and the electron-density maps were carried out using Coot (Emsley & Cowtan, 2004 ▶). All refinement was carried out with REFMAC5.0 (Murshudov et al., 1997 ▶), with maximum likelihood as a target of refinement using the REFMAC5 dictionary (Vagin et al., 2004 ▶) and using all data in the range 15.00–2.05 Å. 4.8% of the data were used for cross-validation and calculation of R free. Water molecules were added at points indicated in the F o − F c map when viewed at the 1σ level. A large sphere of electron density in the F o − F c map that appeared at the 4.97σ level was initially identified as a cobalt hexammine ion. However, the refinement did not proceed smoothly. When an anomalous difference map was calculated to confirm the presence of the ion, the blob of density was not visible. Therefore, the electron density in the F o − F c map was taken to represent water. In all, a total of 20 water molecules could be identified and refined with the rest of the structure. The final R factor and R free were 0.235 and 0.264, respectively. The coordinates and structure factors have been deposited in the PDB (Berman et al., 2000 ▶) with code 3e9w. Geometrical calculations were carried out using X3DNA (Lu & Olson, 2003 ▶). PyMOL (DeLano, 1998 ▶) was used to prepare the figures.
Table 1. Crystal data and refinement statistics.
Values in parentheses are for the last shell (2.13–2.05 Å).
| Space group | P21 |
| Unit-cell parameters (Å, °) | a = 17.854, b = 43.440, c = 17.847, β = 119.870 |
| Rmerge (%) | 2.71 (19.84) |
| Ranom (%) | 5.08 |
| Completeness (%) | 92.1 (94.5) |
| Multiplicity | 2.73 (2.74) |
| Mean I/σ(I) | 11.7 (2.5) |
| R factor (%) | 23.5 |
| Rfree (%) | 26.4 |
| Mean B value (Å2) | 34.98 |
| No. of atoms | DNA, 240; water, 20 |
3. Results and discussion
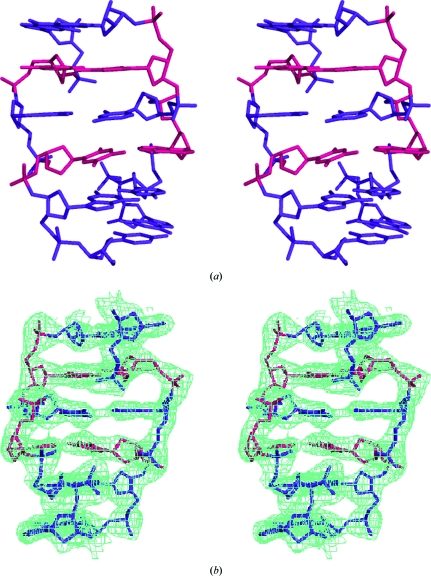
Fig. 1 ▶ shows a stereo diagram of the final refined structure of the molecule. Despite the presence of two A·T base pairs, the structure deviates very little from the standard model of Z-type DNA derived from the structure of the hexamer d(CGCGCG)2 (NDB code ZDF001; Wang et al., 1979 ▶). This is also indicated by the r.m.s.d. value of 0.604 Å obtained by least-squares superposition of the present structure on that of d(CGCGCG)2. We have previously reported the structures of a series of three sequences, each obtained by replacing one of the C·G base pairs in d(CGCGCG)2 with an A·T base pair (Sadasivan & Gautham, 1995 ▶; Thiyagarajan et al., 2004 ▶). These earlier studies indicated that the position of the A·T base pair played an important role in determining the helical structure; when the A·T base pair was placed so as to result in a run of less than four alternating C·G base pairs, as in the sequence d(CGCACG)·d(CGTGCG) (NDB code ZDF038), the deviation from the regular model of Z-DNA was large (Sadasivan & Gautham, 1995 ▶). When the present structure was superposed on the structures of three sequences with a single A·T base pair each, the r.m.s.d.s were 0.488 Å with respect to d(CACGCG)·d(CGCGTG) (NDB code ZDF039), 0.875 Å with respect to d(CGCACG)·d(CGTGCG) and 0.576 Å with respect to d(CGCGCA)·d(TGCGCG) (NDB code ZD0014). Thus, although the present sequence does not possess an uninterrupted stretch of four or more C·G base pairs, it nevertheless does not deviate as much from a regular Z-DNA helix as d(CGCACG)·d(CGTGCG). The torsion angle χ is anti for all the pyrimidine bases and syn for all the purines (Table 2 ▶), as in regular Z-DNA. Likewise, the sugar puckering alternates between a conformation close to C3′-endo for the purines (actually C4′-exo) and one close to C2′-endo for the pyrimidines (actually C3′-exo) (Table 2 ▶).
Figure 1.
(a) Stereoview of the asymmetric unit. (b) Stereoview of the asymmetric unit with the electron-density map contoured at the 1σ level. The A·T base pairs are in red.
Table 2. Backbone (α and ζ) and glycosidic (χ) torsion angles, phase angle of pseudo-rotation (P) and the amplitude of pucker (τm).
α is (n−1)O3′—P—O5′—C5′, ζ is C3′—O3′—P—O5′(n+1) and χ is O4′—C1′—Nx—Cy, where x = 1, y = 2 for pyrimidines and x = 9, y = 4 for purines).
| Base | α (°) | ζ (°) | χ (°) | P (°) | τm (°) | Puckering |
|---|---|---|---|---|---|---|
| C1 | — | 155.0 | −144.9 | 186.9 | 51.8 | C3′-exo |
| A2 | −117.6 | 49.3 | 41.2 | 60.9 | 48.1 | C4′-exo |
| C3 | 152.3 | 104.1 | −141.6 | 141.1 | 49.7 | C1′-exo |
| A4 | −173.0 | −106.6 | 58.1 | 58.6 | 50.0 | C4′-exo |
| C5 | 36.9 | 74.9 | −133.0 | 185.6 | 41.8 | C3′-exo |
| G6 | 66.8 | — | 49.4 | 50.5 | 44.9 | C4′-exo |
| C7 | — | 115.5 | −156.5 | 175.8 | 53.6 | C2′-endo |
| G8 | 139.0 | 16.8 | 51.3 | 69.5 | 61.8 | C4′-exo |
| T9 | −131.2 | 86.3 | −98.1 | 191.3 | 49.0 | C3′-exo |
| G10 | 109.8 | 61.8 | 55.6 | 49.6 | 38.4 | C4′-exo |
| T11 | −100.3 | 83.1 | −125.2 | 182.8 | 36.8 | C3′-exo |
| G12 | 93.1 | — | 49.9 | 44.4 | 34.3 | C4′-exo |
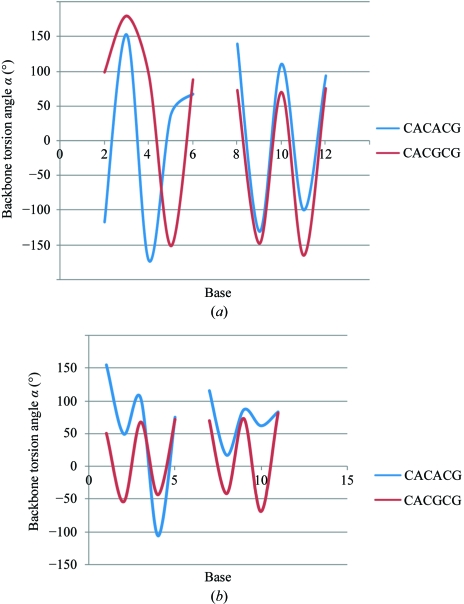
The Z conformation has two variants (Wang et al., 1981 ▶). The ZI variant is characterized by an alternative gauche(+) and gauche(−) conformation of the backbone torsion angle ζ, while in the ZII variant ζ is always gauche(+). In the present structure most of the ζ torsion angles are gauche(+). A comparison of the backbone torsion angles α and ζ of d(CACACG)·d(CGTGTG) with the ZI conformation of d(CACGCG)·d(CGCGTG) is shown in Fig. 2 ▶. The torsion angle α follows the ZI conformation except at the fifth position, while the torsion angle ζ follows the ZII conformation, again except at the fifth position (see also Table 2 ▶). Thus, the backbone conformation may be characterized as intermediate between ZI and ZII. In the hexamer sequences with a single A·T base pair mentioned above, the conformation is ZI at most nucleotides, with the backbone assuming the ZII structure at a few positions. However, these positions are not correlated with either the A·T base pair or with the binding of the metal ion.
Figure 2.
(a) Comparison of the backbone torsion angle α of the hexamer d(CACACG)·d(CGTGTG) with that of d(CACGCG)·d(CGCGTG). (b) Comparison of the backbone torsion angle ζ of the two hexamers. The hexamer d(CACGCG)·d(CGCGTG) follows the ZI conformation.
DNA helices are generally characterized by the twist and rise values of the base-pair steps. In the fibre model of Z-DNA, the twist is −10° at the pyrimidine–purine base step and −50° at the purine–pyrimidine base step, amounting to an overall twist of −60° per dinucleotide-repeat unit (Arnott et al., 1980 ▶). In the present structure, three base-pair steps do not follow the standard twist value. The A2pC3·G10pT11 base step has a twist value of −42.8°. The value at the central C3pA4·T9pG10 base step is −23.06°. The succeeding purine–pyrimidine base step A4pC5·G8pT9 has a value of −38.39°. A similar pattern of lesser and greater than expected twist values is observed in the structure of d(CGCACG)·d(CGTGCG) (Sadasivan & Gautham, 1995 ▶), but not in other Z-DNA hexamers with or without A·T base pairs.
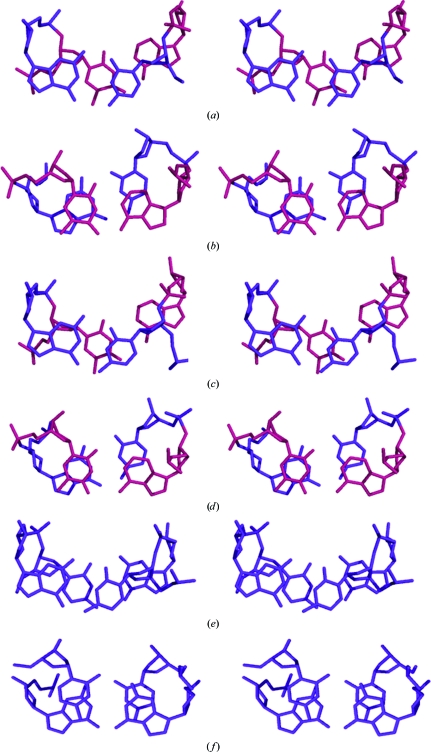
The average value of rise in d(CACACG)·d(CGTGTG) is 3.60 Å, which is close to the standard value. However, the value is not uniformly the same at each step. The first and last steps have lower values than the intermediate steps, i.e. the ends of the hexamer are more compressed than the central portion. This feature is also seen in d(CGCACG)·d(CGTGCG) (Sadasivan & Gautham, 1995 ▶), d(CACGTG)2 (Narayana et al., 2006 ▶) and d(TGCGCA)2 (Harper et al., 1998 ▶). Significant deviations from normal values occur at a few of the base steps in the present structure for some of the other base-centred parameters such as inclination, roll, propeller twist and buckle (Tables 3 ▶ and 4 ▶). There are large positive roll values and large negative inclination values at the terminal C1pA2·T11pG12 base step and the C5pG6·C7pG8 base step. There are also large positive values of propeller twist at the terminal base pairs C1·G12 and G6·C7. The A4·T9 base pair has a large buckle value. Some of these features are similar to those seen in d(CGCACG)·d(CGTGCG). Fig. 3 ▶ shows the base-stacking patterns observed in the present structure. Inter-strand stacking of the pyrimidine bases at the 5′-pyrimidine–purine-3′ base steps and the associated interaction of the pyrimidine ribose O4′ atoms with the purine bases, features that are characteristic of Z-DNA, are clearly visible regardless of whether the pyrimidines are cytosine or thymine. Unusually large values of propeller twist and buckle at some of the base pairs (Table 4 ▶) do not disturb these features.
Table 3. A comparison of the base-step parameters roll and inclination of the hexamer with those of d(CGCGCG)2 (NDB code ZDF001) and d(CGCACG)·d(CGTGCG) (NDB code ZDF038).
Deviating values are shown in bold.
| Sequence | Base step | Roll (°) | Inclination (°) |
|---|---|---|---|
| d(CGCGCG)2 | C1pG2·C11pG12 | −2.93 | 24.38 |
| d(CGCACG)·d(CGTGCG) | C1pG2·C11pG12 | 3.12 | −10.89 |
| d(CACACG)·d(CGTGTG) | C1pA2·T11pG12 | 5.67 | −29.41 |
| d(CGCGCG)2 | G2pC3·G10pC11 | −6.75 | 7.75 |
| d(CGCACG)·d(CGTGCG) | G2pC3·G10pC11 | −5.85 | 7.52 |
| d(CACACG)·d(CGTGTG) | A2pC3·G10pT11 | 4.34 | −5.48 |
| d(CGCGCG)2 | C3pG4·C9pG10 | −2.72 | 22.71 |
| d(CGCACG)·d(CGTGCG) | C3pA4·T9pG10 | −0.52 | 1.42 |
| d(CACACG)·d(CGTGTG) | C3pA4·T9pG10 | 2.39 | −8.21 |
| d(CGCGCG)2 | G4pC5·G8pC9 | −2.32 | 2.61 |
| d(CGCACG)·d(CGTGCG) | A4pC5·G8pT9 | 3.67 | −4.81 |
| d(CACACG)·d(CGTGTG) | A4pC5·G8pT9 | 3.78 | −5.38 |
| d(CGCGCG)2 | C5pG6·C7pG8 | −0.97 | 6.63 |
| d(CGCACG)·d(CGTGCG) | C5pG6·C7pG8 | 2.21 | −19.01 |
| d(CACACG)·d(CGTGTG) | C5pG6·C7pG8 | 4.79 | −22.20 |
Table 4. A comparison of the base-pair parameters propeller twist and buckle of the hexamer with those of d(CGCGCG)2 (NDB code ZDF001) and d(CGCACG)·d(CGTGCG) (NDB code ZDF038).
Deviating values are shown in bold.
| Sequence | Base pair | Propeller twist (°) | Buckle (°) |
|---|---|---|---|
| d(CGCGCG)2 | C1·G12 | −1.31 | 1.28 |
| d(CGCACG)·d(CGTGCG) | C1·G12 | 7.44 | −6.02 |
| d(CACACG)·d(CGTGTG) | C1·G12 | 8.19 | 1.14 |
| d(CGCGCG)2 | G2·C11 | −3.80 | −6.43 |
| d(CGCACG)·d(CGTGCG) | G2·C11 | −6.13 | 0.04 |
| d(CACACG)·d(CGTGTG) | A2·T11 | 5.40 | 0.61 |
| d(CGCGCG)2 | C3·G10 | −7.22 | 4.49 |
| d(CGCACG)·d(CGTGCG) | C3·G10 | −3.24 | −4.93 |
| d(CACACG)·d(CGTGTG) | C3·G10 | 8.81 | −2.54 |
| d(CGCGCG)2 | G4·C9 | 0.75 | −8.46 |
| d(CGCACG)·d(CGTGCG) | A4·T9 | 5.26 | −3.13 |
| d(CACACG)·d(CGTGTG) | A4·T9 | −0.10 | 21.77 |
| d(CGCGCG)2 | C5·G8 | −0.67 | 0.08 |
| d(CGCACG)·d(CGTGCG) | C5·G8 | −6.10 | 7.22 |
| d(CACACG)·d(CGTGTG) | C5·G8 | −2.23 | 3.37 |
| d(CGCGCG)2 | G6·C7 | 4.29 | 5.44 |
| d(CGCACG)·d(CGTGCG) | G6·C7 | 5.25 | 0.20 |
| d(CACACG)·d(CGTGTG) | G6·C7 | 9.01 | 8.35 |
Figure 3.
Stereoview of the base stacking of the adjacent base pairs (a) C1pA2·T11pG12, (b) A2pC3·G10pT11, (c) C3pA4·T9pG10, (d) A4pC5·G8pT9, (e) C5pG6·C7pG8 and (f) G6C1#·G12#C7 (where # denotes a symmetry-related base). G·C base pairs are red and A·T base pairs are blue.
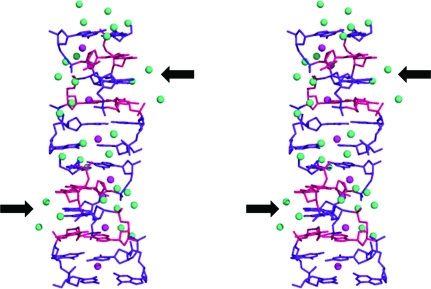
Fig. 4 ▶ shows that the ‘spine of hydration’ (Chevrier et al., 1986 ▶; Gessner et al., 1994 ▶) frequently seen in Z-DNA also occurs in the present structure. There were some points along the spine at which water molecules could not be located, but these were not always in the vicinity of the A·T base pairs. Although the lack of the stabilizing effect of water molecules in the vicinity of A·T base pairs has been speculated to be one of the reasons why these base pairs are less easily induced to form Z-type helices (Wang et al., 1984 ▶), in the present structure at least this effect is not observed. The cobalt hexammine ion is known to have a strong stabilizing effect on Z-DNA (Behe & Felsenfeld, 1981 ▶; Rich et al., 1984 ▶; Chen et al., 1984 ▶) and probably acts in the present case to counter the possible destabilizing effect of the A·T base pairs. However, the ion could not be located in the electron-density map and therefore probably acts in a nonspecific manner, as described in the structure of d(CACGCG)·d(CGCGTG) cocrystallized with ruthenium hexammine (Karthe & Gautham, 1998 ▶).
Figure 4.
DNA–water interaction. Pink spheres indicate the spine of hydration. The arrows indicate discontinuities in the spine.
In this crystal, the packing of the helix follows the pattern observed in almost all previous Z-DNA structures, with columns of helices bundled together to form a hexagonal close-packed pattern when viewed down the helix axis. Owing to the approximately cylindrical shape of the DNA helix, such packing may be indexed in a variety of space groups, such as P65, P32, P212121, C2221 etc. (Sadasivan et al., 1994 ▶). The choice of the space group may depend on small variations in the packing and symmetry considerations, such as whether the sequence is self-complementary and therefore symmetrical or not. In the present case, three space groups were possible, namely P65, P32 and P21. All three had roughly comparable R indices. However, we chose the space group P21 as the most appropriate since not only was R merge lowest for this space group in all resolution ranges, but also the unit cell could only accommodate a complete hexamer without statistical disorder in this space group.
Supplementary Material
PDB reference: d(CACACG)·d(CGTGTG), 3e9w, r3e9wsf
Acknowledgments
We thank the following agencies of the Government of India for funding this project: DBT, DST-FIST and UGC. We also thank Dr M. D. Naresh for use of the X-ray data-collection facility at the GNR Centre for Structural Biology, Central Leather Research Institute, Chennai. PKM thanks CSIR for the JRF.
References
- Arnott, S., Chandrasekaran, R., Birdsall, D. L., Leslie, A. G. W. & Ratcliff, R. L. (1980). Nature (London), 283, 743–745. [DOI] [PubMed]
- Behe, M. & Felsenfeld, G. (1981). Proc. Natl Acad. Sci. USA, 78, 1619–1623. [DOI] [PMC free article] [PubMed]
- Berman, H. M., Westbrook, J., Feng, Z., Gilliland, G., Bhat, T. N., Weissig, H., Shindyalov, I. N. & Bourne, P. E. (2000). Nucleic Acids Res.28, 235–242. [DOI] [PMC free article] [PubMed]
- Chen, H. H., Behe, M. J. & Rau, D. C. (1984). Nucleic Acids Res.12, 2381–2389. [DOI] [PMC free article] [PubMed]
- Chevrier, B., Dock, A. C., Hartmann, B., Leng, M., Moras, D., Thuong, M. T. & Westhof, E. (1986). J. Mol. Biol.188, 707–719. [DOI] [PubMed]
- DeLano, W. L. (1998). The PyMOL Molecular Graphics System. DeLano Scientific, San Carlos, California, USA.
- Emsley, P. & Cowtan, K. (2004). Acta Cryst. D60, 2126–2132. [DOI] [PubMed]
- Fujii, S., Wang, A. H.-J., van der Marel, G. A., van Boom, J. H. & Rich, A. (1982). Nucleic Acids Res.10, 7879–7892. [DOI] [PMC free article] [PubMed]
- Gessner, R. V., Quigley, G. J. & Egli, M. (1994). J. Mol. Biol.236, 1154–1168. [DOI] [PubMed]
- Gessner, R. V., Quigley, G. J., Wang, A. H.-J., van der Marel, G. A., van Boom, J. H. & Rich, A. (1985). Biochemistry, 24, 237–240. [DOI] [PubMed]
- Harper, A., Brannigan, J. A., Buck, M., Hewitt, L., Lewis, R. J., Moore, M. H. & Schneider, B. (1998). Acta Cryst. D54, 1273–1284. [DOI] [PubMed]
- Karthe, P. & Gautham, N. (1998). Acta Cryst. D54, 501–509. [DOI] [PubMed]
- Lu, X.-J. & Olson, W. K. (2003). Nucleic Acids Res.31, 5108–5121. [DOI] [PMC free article] [PubMed]
- Murshudov, G. N., Vagin, A. A. & Dodson, E. J. (1997). Acta Cryst. D53, 240–255. [DOI] [PubMed]
- Narayana, N., Shamala, N., Ganesh, K. N. & Viswamitra, M. A. (2006). Biochemistry, 45, 1200–1211. [DOI] [PubMed]
- Navaza, J. (1994). Acta Cryst. A50, 157–163.
- Rich, A., Nordheim, A. & Wang, A. H.-J. (1984). Annu. Rev. Biochem.53, 791–846. [DOI] [PubMed]
- Sadasivan, C. & Gautham, N. (1995). J. Mol. Biol.248, 918–930. [DOI] [PubMed]
- Sadasivan, C., Karthe, P. & Gautham, N. (1994). Acta Cryst. D50, 192–196. [DOI] [PubMed]
- Thiyagarajan, S., Rajan, S. S. & Gautham, N. (2004). Nucleic Acids Res.32, 5945–5953. [DOI] [PMC free article] [PubMed]
- Vagin, A. A., Steiner, R. A., Lebedev, A. A., Potterton, L., McNicholas, S., Long, F. & Murshudov, G. N. (2004). Acta Cryst. D60, 2184–2195. [DOI] [PubMed]
- Wang, A. H.-J., Hakoshima, T., van der Marel, G., van Boom, J. H. & Rich, A. (1984). Cell, 37, 321–331. [DOI] [PubMed]
- Wang, A. H.-J., Quigley, G. J., Kolpak, F. J., Crawford, J. L., van Boom, J. H., van der Marel, G. & Rich, A. (1979). Nature (London), 282, 680–686. [DOI] [PubMed]
- Wang, A. H.-J., Quigley, G. J., Kolpak, F. J., van Boom, J. H., van der Marel, G. & Rich, A. (1981). Science, 211, 171–176. [DOI] [PubMed]
- Xodo, L. E., Manzini, G., Quadrifoglio, F., Yathindra, N., van der Marel, G. A. & van Boom, J. H. (1989). J. Biomol. Struct. Dyn.6, 1217–1231. [DOI] [PubMed]
Associated Data
This section collects any data citations, data availability statements, or supplementary materials included in this article.
Supplementary Materials
PDB reference: d(CACACG)·d(CGTGTG), 3e9w, r3e9wsf
PDB reference: d(CACACG)·d(CGTGTG), 3e9w, r3e9wsf


