Abstract
Quantitative assessment of microvascular structure is relevant to the investigations of ischemic injury, reparative angiogenesis and tumor revascularization. In light microscopy applications, thick tissue specimens are necessary to characterize microvascular networks; however, thick tissue leads to image distortions due to out-of-focus light. Structured illumination confocal microscopy is an optical sectioning technique that improves contrast and resolution by using a grid pattern to identify the plane-of-focus within the specimen. Because structured illumination can be applied to wide-field (nonscanning) microscopes, the microcirculation can be studied by sequential intravital and confocal microscopy. To assess the application of structured illumination confocal microscopy to microvessel imaging, we studied cell-sized microspheres and fused silica microcapillary tissue phantoms. As expected, structured illumination produced highly accurate images in the lateral (X-Y) plane, but demonstrated a loss of resolution in the Z-Y plane. Because the magnitude of Z-axis distortion was variable in complex tissues, the silica microcapillaries were used as spatial calibration standards. Morphometric parameters, such as shape factor, were used to empirically optimize Z-axis software compression. We conclude that the silica microcapillaries provide a useful tissue phantom for in vitro studies as well as spatial calibration standard for in vivo morphometry of the microcirculation.
Introduction
Spatial analysis of the microcirculation is important for understanding both normal anatomic relationships as well as disease processes such as ischemic injury, reparative angiogenesis, and tumor neovascularization. Three-dimensional spatial information, however, requires the analysis of thick specimens or “whole mounts” of tissue (Hughes, 1965; Spalteholtz, 1911; Wilson, 1924). In most whole mounts, the thickness or “z-dimension” is greater than the objective’s depth of field (Eichten and others, 2005; Neil and others, 2000). As a result of image information from the regions above and below the focal plane, visible structures appear faded and blurred. The loss of resolution and contrast worsens with decreased signal intensity and increased thickness.
Attempts to improve the resolution and contrast in whole mounts have focused on optical sectioning techniques. Optical sections retain only the image information that lies within the objective’s depth-of-field. In addition to conventional confocal microscopy (Kubinova and Janacek, 2001) and deconvolution (Sibarita, 2005) approaches, structured illumination (Neil and others, 1997; Schaefer and others, 2004) attempts to increase resolution and contrast in the axial direction by removing parts of the image that are out-of-focus. In structured illumination, a variegated pattern (such as a grid of lines) located at the field-diaphragm plane defines the plane-of-focus within the specimen. By shifting the grid pattern in the X-Y plane (typically 3 times), the light in the in-focus plane can be identified and retained. The 3 raw digital images are recombined into a single optical section in near-real time (typically less than 100ms). The resolution in the optical axis (Z-axis) is improved by excluding out-of-focus light above and below the plane-of-interest in the sample. Serial optical sections, obtained at constant intervals, can be processed by rendering software to generate a 3-dimensional (3D) reconstruction.
The application of structured illumination optical sectioning in the imaging of microvessels is appealing because the process can utilize a wide-field microscope and enable near-real time acquisition. Further, optical sectioning does not require the “corrosion” of the surrounding tissue—a procedure that is necessary for tilt-angle scanning electron microscopy (SEM) of microvascular casts (Konerding and others, 1995). Similar to other optical sectioning techniques, however, quantitative application of structured illumination is limited by the well-recognized phenomenon of image distortion in the optical axis (Heintzmann and others, 2000; Schrader and others, 1998; White and others, 1987). Particularly in tissues with variable internal structure, anisotropic resolution along the optical axis is estimated to be three-fold worse than lateral resolution (Heintzmann and others, 2000). To effectively quantify Z-axis elongation and provide a metric for subsequent software compression, we investigated the use of tissue phantoms comprised of fused silica microcapillaries.
Methods
Mice
Male C57B/6 mice (Jackson Laboratory, Bar Harbor, ME), 25–33gm, were used in all experiments. The care of the animals was consistent with guidelines of the American Association for Accreditation of Laboratory Animal Care (Bethesda, MD).
Inverted microscope
All sampled tissues in tissue phantoms were imaged using a Nikon Eclipse TE2000 inverted epifluorescence microscope using Nikon objectives 20X Plan Fluor multi-immersion (NA 0.75, WD 0.35) and 40X Plan Apo oil-immersion (NA 1.0, WD 0.16) lenses.
Light source and filter system
An X-Cite (EXFO; Vanier, Canada) 120 watt metal halide light source and a liquid light guide were used to illuminate the tissue samples. Excitation and emission filters (Chroma, Rockingham, VT) in separate LEP motorized filter wheels were controlled by a MAC5000 controller (Ludl, Hawthorne, NY) and Volocity 4.2 software (Improvision, Coventry, UK).
Structured illumination image acquisition
The images were acquired with the optical system equipped with an Optigrid (Qioptiq, Fairport, NY) controlled by Volocity 4.2 (Improvision) software. Image data was processed with a Dell Precision 390 Workstation with dual Xeon processors, 4Gb RAM and a NVIDIA Quadro FX 3450 graphics card (NVIDIA, Santa Clara, CA). Using a Ronchi grating mounted on a piezo-electrically driven actuator, the Optgrid pattern was moved perpendicular to the grid lines three times to produce three separate images. The images were digitally recombined using a proprietary software algorithm (Volocity 4.2; Improvision) to remove out-of-focus light. Z-axis values of 150% of the anticipated values were acquired with void volumes above and below the region of interest to ensure complete acquisition. The z-series step size was 0.1–1.0um with image stacks of 100–500 images.
Electron multiplying (EMCCD) camera
The structured illumination and intravital videomicroscopy 14- bit fluorescent images were digitally recorded on a C9100-02 camera (Hamamatsu, Japan). The C9100-02 camera has a hermetic vacuum-sealed air-cooled head and on-chip electron gain multiplication (2000x). Images with 1000 × 1000 pixel resolution were routinely obtained.
Microspheres
The microspheres were developed by Molecular Probes (Invitrogen, Eugene, OR) for intravascular particle tracking. These particles were of similar composition to those reported previously (Bernard and others, 1996), but manufactured with superior fluorescent characteristics, smaller size and low surface charge content (6.2uEq/gm). The microspheres used in this study were 4um blue (ex 365nm; em 415nm), 4um green (ex 488nm; em 515nm), and 4um red (ex 570nm; em 595nm). The microspheres were mounted on #1.5 glass coverslips with 95% glycerol containing 2% agarose in PBS.
Lipophilic carbocyanine tracers
The fluorescent dyes 1,1-dioctadecyl-3,3,3,3-tetramethylindocarbocyanine perchlorate (DiI) and 3,3′-dioctadecyloacarboncyanine perchlorate (DiO) were obtained from Invitrogen (Eugene, OR). DiI was dissolved in ethanol and DiO was dissolved in dimethyl sulfoxide (Sigma, St. Louis) for a final concentration of 0.120mg/ml. After luminal labeling with the fluorescent dyes, the capillary tissue phantoms were sealed and mounted on #1.5 glass coverslips with 100% glycerol.
Fused silica capillaries
The capillary tissue phantoms were constructed from commercially available flexible fused silica capillary tubing (Polymicro, Phoenix, AZ). Some capillaries were coated with a protective polyimide polymer. The synthetic fused silica microcapillaries were manufactured a variety of internal diameters and wall thicknesses. The fused silica was functionally inert with the fluorochromes used in this study. For many experiments, the protective polyimide coating was removed by gently burning off the outer coating layer with a Bunsen burner.
Three-Dimensional tissue mounts
Vessel painting, performed as previously described (Ravnic and others, 2005), was used to label the microcirculation in vivo. After systemic heparinization, the aorta was cannulated and perfused with 15–20ml of 37°C phosphate buffered saline (PBS) followed by a buffered 2.5% glutaraldehyde solution (Sigma). The systemic circulation was perfused with DiI or DiO (10–20ml). Immediately following tracer infusion, the organs of interest were harvested and the tissues dissected in a PBS bath at 25°C. Additionally, 5–10 ml PU4ii resin (vasQtec, Zurich, Switzerland), hardener and enhylmethylketone mixture (6:5:1) was injected for vessel integrity in some experiments. The prepared specimens were placed between glass slides and fixed in 4% formalin overnight. After a brief rinse with distilled water, the specimens were permanently mounted with Vectashield mounting medium (Vector, Burlingame, CA) prior to visualization.
3D image reconstruction
Offline 3-dimensional image rendering was performed with Volocity 4.2 (Improvision, Coventry, UK). The image processing was performed on a Dell Precision 690 Workstation with a 3.2GHz Dual Core Xeon processor (Intel, San Jose, CA) running 64-bitWindows XP Professional with 8Gb of SDRAM memory. The graphics card was an NVIDIA Quadro FX3450 with 256mb.
Image analysis
Analysis of the images was performed with MetaMorph Imaging System 7.5 (Molecular Devices, Downington, PA). After routine distance calibration and thresholding, the image sequences were measured using MetaMorph’s integrated morphometry and linescan applications. The shape factor, defined as 4πArea/Perimeter, produced a value from 0 to 1 representing how closely the object represents a circle. A value near 0 indicates a flattened object, whereas a value of 1.0 indicates a perfect circle. The linescan application graphs intensity values across a line in a selected image. The linescan values were averaged across a line width that was typically less than 2% the width of the region of interest. To insure the measurement of maximal sphere diameter, the linescan function was repeated so that maximum intensity values were graphed. The integrated optical density was (Σ(log(MaxGV/GV)) calculated as the sum of the optical densities of all pixels within the perimeter of the object. The data was exported to Excel (Microsoft) by dynamic data exchange for further processing.
Statistical analysis
The statistical analysis of replicate measures was based on a minimum of three independent measurements. The unpaired Student’s t test for samples of unequal variances was routinely used to calculate statistical significance. The data was expressed as mean ± one standard deviation. The significance level for the sample distribution was defined as P<.01. Comparisons of intensity curves was performed using nonlinear curve fitting. A 95% confidence band was calculated for the best-fit curve (Origin 8.0). The fitted curve was compared to the specifications of the actual object using nonlinear regression (R2).
Results
Microsphere calibration
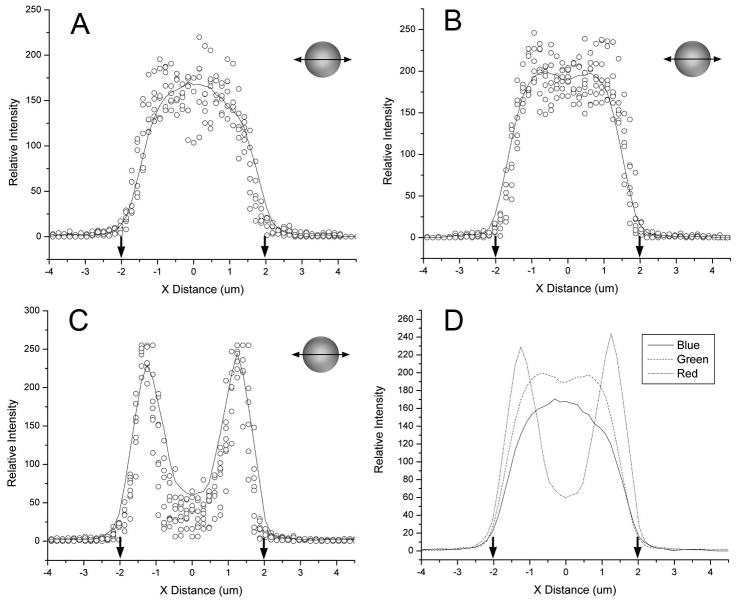
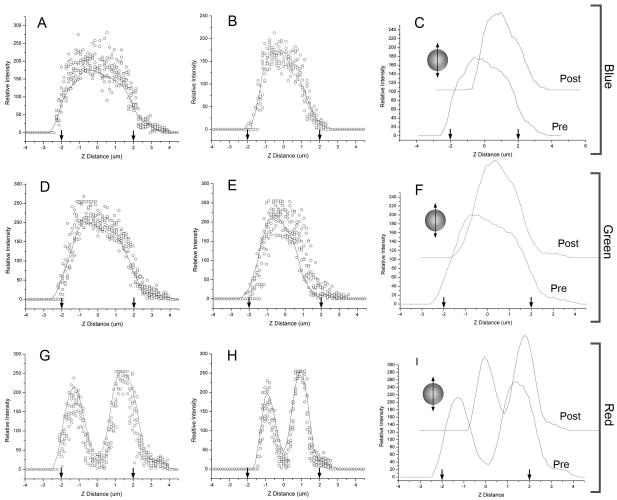
To assess structured illumination performance in imaging cell-sized spheres, we studied microspheres labeled with coumarin (blue) and Bodipy (green and red) fluorochromes (Ravnic and others, 2007). Quantitative morphometry of the 3D reconstructions was assessed using orthogonal (X-axis and Z-axis) linescans passing through the geometric center of the reconstructed microspheres. The x-axis linescans demonstrated dimensions closely approximating known sphere dimensions (Figure 1). Average shape factor, a morphometric parameter reflecting how closely the image replicated a circle, was near 1.0 (blue 0.96±.02; green 0.93±.03; red 0.92±.03) in the X-Y plane. In contrast, 3D reconstructions were elongated in the Z-axis (Figure 2). In the experiment shown in Figure 2, average shape factor of the microspheres in the Z-Y plane averaged 0.64 (blue 0.69±.08; green 0.64±.08; red 0.59±.09). After empiric linear software compression, average shape factors improved to 0.89 (blue), 0.88 (green) and 0.86 (red). Nonlinear curve fit of the experimental data was uniformly within the 95% confidence bands with highly significant covariation statistics (p<.0001). The integrated optical density, a measure of the sum of all densities within the spheres, was uniformly less in the ZY dimension than in the XY dimension suggesting that the diminished shape factor reflected decreased signal isolation in the optical axis.
Figure 1.
Quantitative morphometry of the x-axis (transverse) dimension of 3D reconstructed microspheres after structured illumination acquisition. Linescans from a minimim of 5 blue (A), green (B), and red (C) spheres are shown as raw data (open circles) and summarized with a smoothing curve (line) based on a 5 point adjacent average. (D) The smoothing curves for all three fluorochromes were superimposed for precision comparison. The diameter of the microsphere based on manufacturer specifications, is shown (arrows). Of note, the linescan of the rhodamine (C) labeled microspheres was bimodal reflecting the limited penetration of the dye into the polypropylene microspheres. The structured illumination images of micropheres suspended in glycerol were obtained with 40x oil immersion objective using selective blue (ex 360/40nm; em 420nm LP), green (ex 480/40nm; em 535/25nm) and red (ex 540/25nm; em 620/60nm) fluoresence filters.
Figure 2.
Quantitative morphometry of the z-axis (optical axis) dimension of 3D reconstructed microspheres after structured illumination acquisition. Linescans from a minimim of 5 blue (A), green (D), and red (G) microspheres is shown as raw data (open circles) summarized with a smoothing curve (line) based on a 5 point adjacent average. The diameter of the microsphere, on the basis of manufacturer specifications, is shown (arrows). After empiric software compression (Volocity) to optimize shape factor, the 3D reconstructed microspheres were again measured by z-axis linescan (B,E,H) and summarized by a smoothing curve. The effect of the correction is shown by waterfall comparison of the pre- and post-correction smoothing curves (C,F,I). The structured illumination images of micropheres suspended in glycerol were obtained with 40x oil. immersion objective using selective blue (ex 360/40nm; em 420nm LP), green (ex 480/40nm; ex 535/25nm) and red (ex 540/25nm; em 620/60nm) fluoresence filters.
Capillary phantoms
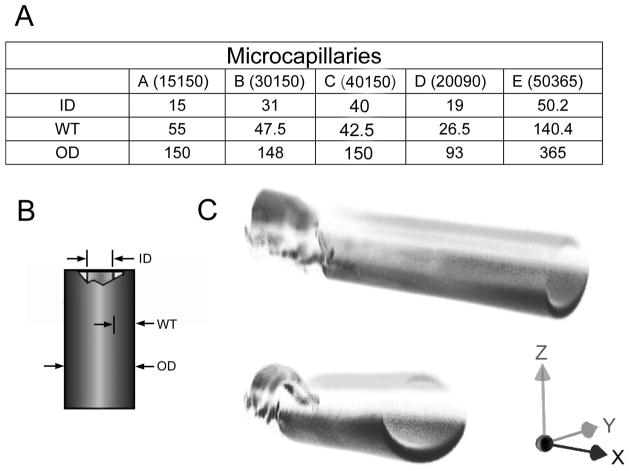
To obtain a spatial reference for 3D microscopy of microvessels, we investigated the use of commercially manufactured fused silica microcapillaries. The microcapillaries were manufactured with variable sized lumens and wall thicknesses (Figure 3A–B). An outer polyimide coat contributed to microcapillary tensile strength and flexibility; however, the polyimide coating had broad fluorescence properties that limited image acquisition (Figure 3C). The polyimide coating had a 90% transmission at 425nm, but less than 2% transmission below 350nm (data not shown). Because of the limited transmission in the ultraviolet range, the polyimide coating was removed, or specially ordered without the coating, in most image studies.
Figure 3.
The tissue phantoms were commercially available fused silica microcapillaries (Polymicro Technologies). 5 different sizes and wall thicknesses were chosen for this study (A). (B) The inner diameter (ID), wall thickness (WT) and outer diameter (OD) varied between capillaries (C) Structured illumination image of the capillaries with the polyimide coating resulted in partial imaging illustrated by the differential imaging of the fractured and unfractured portion of the capillary.
Calibration of fluorescent vessel painting
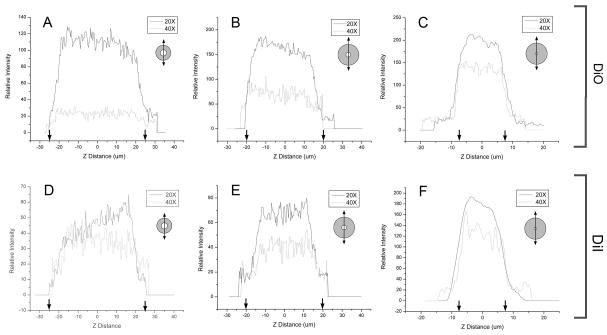
Fluorescent vessel painting is an economical and practical method for imaging microvessel networks (Ravnic and others, 2005). To simulate in vivo fluorescent vessel painting, the various sized microcapillaries were filled with the lipophilic dyes DiO or DiI. 3D images of DiO- (Figure 4A–C) and DiI- (Figure 4D–F) labeled capillaries were obtained and assessed by Z-axis linescan morphometry. Capillary diameters greater than 50 times the Z-axis step size (Figures 4A,B and 4D,E) demonstrated minimal elongation in the optical axis. Because the capillary phantoms were used to calibrate vessel acquisition in the 10–25um diameter range, the 15um diameter capillary (Figure 4C,F) was used in subsequent in vivo experiments. The capillary phantoms provided an opportunity to not only spatially calibrate 3D images, but also evaluate signal isolation in dual wavelength applications. Using luminal DiI or DiO fluorescent dyes, the capillaries provided an opportunity to assess microsphere detection within the fluorochrome-labeled microcapillaries (Figure 5).
Figure 4.
Quantitative morphometry of the z-axis (optical axis) dimension of 3D reconstructed fused silica microcapillaries after structured illumination acquisition. Linescans from a DiO (green) and DiI (red) lipophilic dyes were acquired using 20x (solid line) and 40x (dotted line) magnification. No software compression was used.
Figure 5.
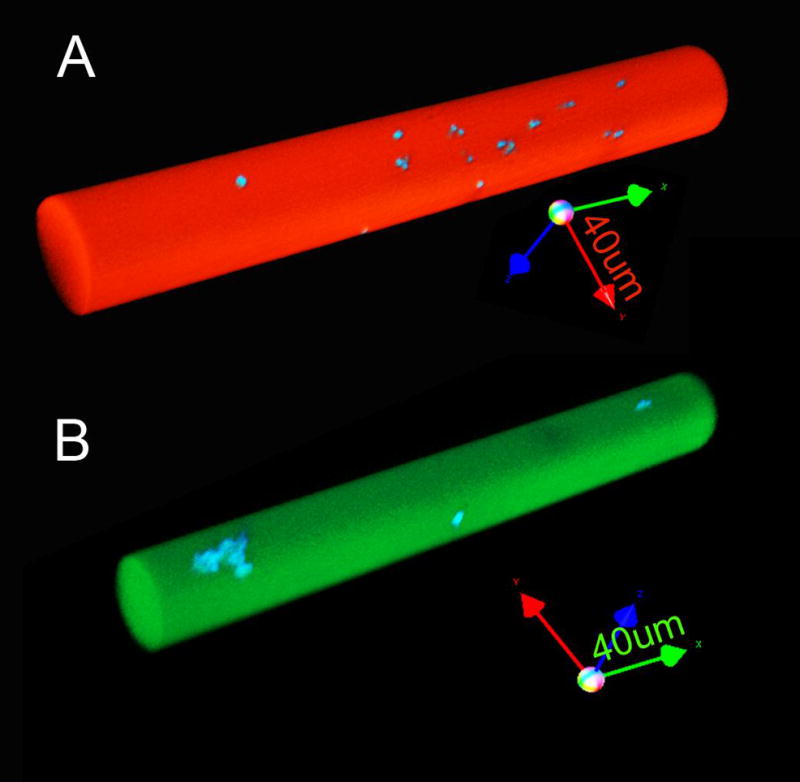
3D reconstructions of fused silica capillaries after dual wavelength structured illumination acquisition. The capillaries were labeled with (A) DiI (red) and (B) DiO (green) lipophilic dyes containing microspheres labeled with coumarin (blue) derivatives. The images of the 50um diameter capillary were acquired using 20x objective without software compression (arrow length=40um).
Capillary phantoms in vivo
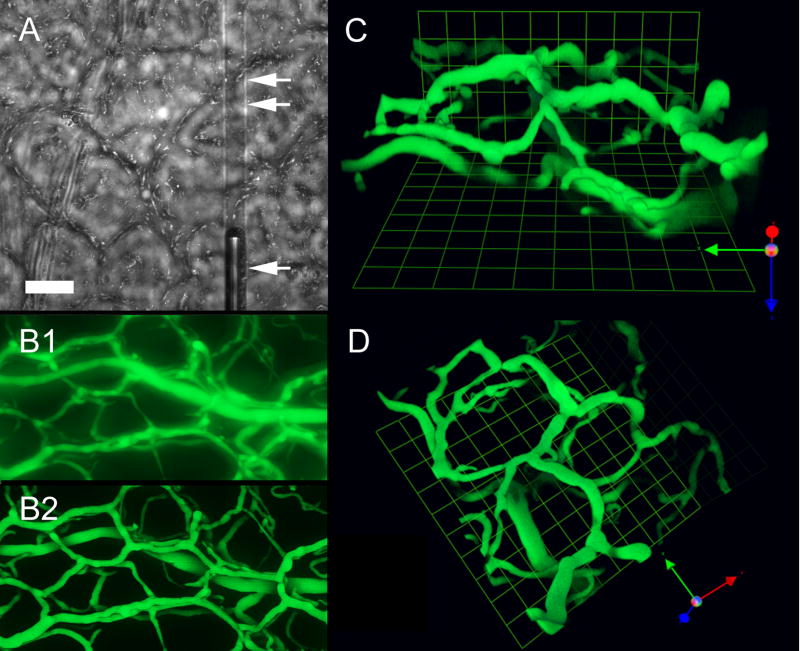
The lumens of the capillary phantoms were labeled with lipophilic dyes and used as spatial calibration standards for in vivo imaging. In morphometry applications, the capillaries were placed in the colon mucosa using stereomicroscopic guidance. Bright field microscopy was used to confirm the placement of the capillary within the plane of the mucosal plexus (Figure 6A). The mucosal plexus microvessels, labeled with fluorescent lipophilic dyes, were imaged with and without using structured illumination (Figure 6B). In comparison with standard fluorescence microscopy, structured illumination produced nearly two-fold more vessel area detectable at the analytic threshold (data not shown). Further, the optical density of the thresholded vessels was nearly 20% greater in the structured illumination specimens (1.05±.10 versus 0.82±.27). In the 3D reconstruction shown in Figure 6, empiric spatial calibration resulted in a Z-axis compression (correction) factor of 0.86 (Figure 6C,D). In 6 separate experiments, empiric software compression improved microcapillary shape factors to 0.87±.05 (DiO) and 0.84±.06 (DiI).
Figure 6.
Structured illumination permits 3D reconstruction of microvascular networks using the sample microscope used for intravital imaging. (A) Bright field imaging of the murine mucosal plexus showing a capillary phantom in the plane of the mucosa (bar=50um). (B) Comparison of comparable wide-field fluorescence images of the mucosal vessesl without (B1) and with (B2) structured illumination. (C–D) Orthogonal views of the murine colon mucosal plexus using structured illumination acquisition and z-axis correction (unit=20um).
Discussion
In this report, we investigated the use of structured illumination confocal microscopy in the study of the microcirculation. Confocal microscopy provides a practical solution to image distortions of microvessels due to out-of-focus light. In particular, the benefit of structured illumination confocal microscopy is 1) the controlled restriction of the focal plane thickness to allow optical sectioning, 2) the improved contrast and resolution in the section by the elimination of out-of-focus light, and 3) the use of a wide-field microscope in image acquisition to allow sequential intravital microscopy and confocal microscopy. The disadvantage of quantitative confocal microscopy is the variable distortion of vessel structure in the Z-axis. To facilitate the spatial calibration of 3D optical sections, we used tissue phantoms composed of fused silica capillaries.
“Whole mount” or “thick tissue” specimens were originally developed more than 50 years ago to study 3D vascular (Hughes, 1965; Wilson, 1924) and neural (Mitchell, 1956) networks. The more recent introduction of 3D imaging techniques such as confocal, structured illumination and multiphoton microscopy has led to much thicker specimen volumes and greater demands on the microscopy system. The major challenge of optical sectioning is that the imaging light path depends upon the variable composition of the tissue medium. Complex tissue composition has a significant influence on both spatial resolution and signal intensity.
In addition to tissue composition, optical variability is the result of elongation in the optical axis (Z-axis). The well-recognized effect has been experimentally verified (Heintzmann and others, 2000; Schrader and others, 1998; White and others, 1987) as well as computationally simulated (Diaspro and others, 2002; Egner and others, 2002). Despite this work, contradictions still exist over both the magnitude and mechanism of elongation along the optical axis. In our study, the objects acquired using structured illumination were elongated from 5% to 105%. In the absence of a theoretical explanation, our practical interpretation is that the axial stage movements do not result in a direct equivalent displacement of the focal position. Regardless, errors in the estimation of distances and volumes, particularly in the context of quantitative morphometry, indicate the utility of calibration standards to empirically define correction factors in the optical axis.
To facilitate the spatial calibration of 3D reconstructions, we used fused silica microcapillaries as a Z-axis calibration reference. We chose the silica microcapillary tissue phantoms because of their inert chemical properties, accurate and stable dimensions, and inherent transparency. The microcapillaries were easy to place within the plane of the mucosal plexus and, in contrast to calibration microspheres, were rapidly located. Our initial problems with the fused silica were related to the polyimide coating. The capillary coating improved tensile strength and facilitated manipulation and cleavage; however, the coating resulted in a transmission block that effectively precluded 3D acquisition in our applications. Without the coating, the highly hydroxylated glass used in this study was essentially free from visible fluorescence. An unavoidable problem with a tissue phantom standard is refractive index mismatches. The refractive index of the fused silica is wavelength dependent, but within the ranges of this study are 1.45 to 1.46 (Kakiuchida and others, 2007; Malitson, 1965; Wada and others, 2007). This compares to the anticipated refractive index of approximately 1.35 in a biologic specimen and a cover glass-immersion oil-objective index of 1.515 (Gibson and Lanni, 1992).
The capillary tissue phantom used in this study provided the opportunity to 1) assess structured illumination performance in complex tissue specimens, 2) empirically define the correction factors for Z-axis distortions, and 3) assess fluorochrome performance and compatibility in vitro. Particularly useful in intravital applications, structured illumination permits the use fo the same wide-field microscope for both standard intravital imaging and confocal optical sectioning. This dual application places greater emphasis on morphometric accuracy. For example, the modeling of flow fields defined by intravital microscopy requires the precise geometric information provided by structured illumination microscopy. These, and many other applications, are likely to benefit from the use of a single microscope for both intravital and confocal imaging.
Acknowledgments
Supported in part by NIH Grant HL47078 and HL75426
Abbreviations
- 3D
3- dimensional
- CFSE
5-(and- 6)-carboxyfluorescein diacetate, succinimidyl ester
- DiI
1,1- dioctadecyl- 3,3,3,3- tetramethylindocarbocyanine perchlorate
- DiO
3,3′-dioctadecyloxacarbocyanine perchlorate
- SEM
scanning electron microscopy
References
- Bernard SL, Glenny RW, Polissar NL, Luchtel DL, Lakshminarayan S. Distribution of pulmonary and bronchial blood supply to airways measured by fluorescent microspheres. J Appl Physiol. 1996;80(2):430–6. doi: 10.1152/jappl.1996.80.2.430. [DOI] [PubMed] [Google Scholar]
- Demandoix D, Davoust J. Multiparameter image cytometry: from confocal micrographs to subcellualr fluorograms. Bioimaging. 1997;5:159–169. [Google Scholar]
- Diaspro A, Federici F, Robello M. Influence of refractive-index mismatch in high-resolution three-dimensional confocal microscopy. Appl Opt. 2002;41(4):685–90. doi: 10.1364/ao.41.000685. [DOI] [PubMed] [Google Scholar]
- Egner A, Andresen V, Hell SW. Comparison of the axial resolution of practical Nipkow-disk confocal fluorescence microscopy with that of multifocal multiphoton microscopy: theory and experiment. J Microsc. 2002;206(Pt 1):24–32. doi: 10.1046/j.1365-2818.2002.01001.x. [DOI] [PubMed] [Google Scholar]
- Eichten A, Shen H-CJ, Coussens LM. Three-dimensional visualization of blood and lymphatic vasculature in tissue whole mounts using confocal microscopy. Current Protocols in Cytometry Unit 12.5. 2005:1–11. doi: 10.1002/0471142956.cy1205s32. [DOI] [PubMed] [Google Scholar]
- Fukano T, Miyawaki A. Whole-field fluorescence microscope with digital micromirror device: imaging of biological samples. Appl Opt. 2003;42(19):4119–24. doi: 10.1364/ao.42.004119. [DOI] [PubMed] [Google Scholar]
- Gibson SF, Lanni F. Experimental test of an analytical model of aberration in an oil-immersion objective lens used in three-dimensional light microscopy. J Opt Soc Am A. 1992;9(1):154–66. doi: 10.1364/josaa.9.000154. [DOI] [PubMed] [Google Scholar]
- Heintzmann R, Kreth G, Cremer C. Reconstruction of axial tomographic high resolution data from confocal fluorescence microscopy: a method for improving 3D FISH images. Anal Cell Pathol. 2000;20(1):7–15. doi: 10.1155/2000/459351. [DOI] [PMC free article] [PubMed] [Google Scholar]
- Hughes T. The preparation of injected and cleared “whole-mounts” for the study of topographical anatomy. Anat Rec. 1965;153(2):129–39. doi: 10.1002/ar.1091530203. [DOI] [PubMed] [Google Scholar]
- Kakiuchida H, Sekiya EH, Shimodaira N, Saito K, Ikushima AJ. Refractive index and density changes in silica glass by halogen doping. J Non-Crys Solids. 2007;353:568–572. [Google Scholar]
- Konerding MA, Miodonski AJ, Lametschwandtner A. Microvascular corrosion casting in the study of tumor vascularity: a review. Scanning Microsc. 1995;9(4):1233–43. [PubMed] [Google Scholar]
- Kubinova L, Janacek J. Confocal microscopy and stereology: estimating volume, number, surface area and length by virtual test probes applied to three-dimensional images. Microsc Res Tech. 2001;53(6):425–35. doi: 10.1002/jemt.1112. [DOI] [PubMed] [Google Scholar]
- Malitson IH. Interspecimen comparison of the refractive index of fused silica. J Opt Soc Am. 1965;55:1205–1210. [Google Scholar]
- Mitchell GAG. Cardiovascular Innervation. Edinburgh: E. & S. Livingstone; 1956. [Google Scholar]
- Neil MA, Squire A, Juskaitis R, Bastiaens PI, Wilson T. Wide-field optically sectioning fluorescence microscopy with laser illumination. J Microsc. 2000;197(Pt 1):1–4. doi: 10.1046/j.1365-2818.2000.00656.x. [DOI] [PubMed] [Google Scholar]
- Neil MAA, Juskaitis R, Wilson T. Method of obtaining optical sectioning by using structured light in a conventional microscope. Optics Lett. 1997;22(24):1905–1907. doi: 10.1364/ol.22.001905. [DOI] [PubMed] [Google Scholar]
- Ravnic DJ, Jiang X, Wolloscheck T, Pratt JP, Huss H, Mentzer SJ, Konerding MA. Vessel painting of the microcirculation using fluorescent lipophilic tracers. Microvasc Res. 2005;70:90–96. doi: 10.1016/j.mvr.2005.06.002. [DOI] [PubMed] [Google Scholar]
- Ravnic DJ, Zhang Y-Z, Turhan A, Tsuda A, Pratt JP, Huss HT, Mentzer SJ. Biological and optical properties of fluorescent nanoparticles developed for intravascular imaging. Microsc Res Tech. 2007;70(9):776–781. doi: 10.1002/jemt.20463. [DOI] [PubMed] [Google Scholar]
- Schaefer LH, Schuster D, Schaffer J. Structured illumination microscopy: artefact analysis and reduction utilizing a parameter optimization approach. J Microsc. 2004;216(Pt 2):165–74. doi: 10.1111/j.0022-2720.2004.01411.x. [DOI] [PubMed] [Google Scholar]
- Schrader M, Hofmann UG, Hell SW. Ultrathin fluorescent layers for monitoring the axial resolution in confocal and two-photon fluorescence microscopy. J Microsc. 1998;191(2):135–140. doi: 10.1046/j.1365-2818.1998.00361.x. [DOI] [PubMed] [Google Scholar]
- Sibarita JB. Deconvolution microscopy. Adv Biochem Eng Biotechnol. 2005;95:201–43. doi: 10.1007/b102215. [DOI] [PubMed] [Google Scholar]
- Spalteholtz W. Uber das Durchsichtigmachen von menschlichen und tierischen Praparaten. Leipzig: Hirzel; 1911. [Google Scholar]
- Wada A, Okude S, Sakai T, Yamauchi R. Geo2 concentration dependence of nonlinear refractive index coefficients of silica-based optical fibers. Elec Comm Jap. 2007;79:12–19. [Google Scholar]
- White JG, Amos WB, Fordham M. An evaluation of confocal versus conventional imaging of biological structures by fluorescence light microscopy. J Cell Biol. 1987;105(1):41–8. doi: 10.1083/jcb.105.1.41. [DOI] [PMC free article] [PubMed] [Google Scholar]
- Wilson JT. On the Application of the Spalteholtz Clearing Method to the Study of Thick Serial Sections of Embryos, with Demonstration of Specimens. J Anat. 1924;58(Pt 2):101–104. [PMC free article] [PubMed] [Google Scholar]


