Abstract
The spread of retroviruses between cells is estimated to be 2–3 orders of magnitude more efficient when cells can physically interact with each other1,2. The underlying mechanism is largely unknown, but transfer is believed to occur through large-surface interfaces, called virological or infectious synapses3–6. Here, we report the direct visualization of cell-to-cell transmission of retroviruses in living cells. Our results reveal a mechanism of virus transport from infected to non-infected cells, involving thin filopodial bridges. These filopodia originate from non-infected cells and interact, through their tips, with infected cells. A strong association of the viral envelope glycoprotein (Env) in an infected cell with the receptor molecules in a target cell generates a stable bridge. Viruses then move along the outer surface of the filopodial bridge toward the target cell. Our data suggest that retroviruses spread by exploiting an inherent ability of filopodia to transport ligands from cell to cell.
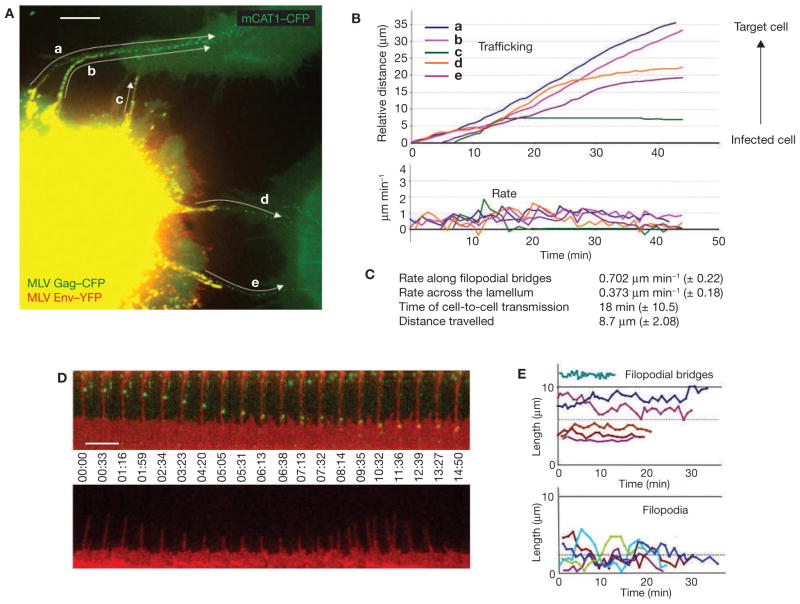
To study the spread of retroviruses between living cells, we used the murine leukemia virus (MLV) as a model. MLV was fluorescently labelled in infected cells by expressing a CFP-fusion with the capsid protein Gag (MLV Gag–CFP), as well as an envelope protein (Env) carrying a YFP-insertion (MLV Env–YFP)7,8. Infected cells were then cocultured with non-infected target cells expressing a CFP fusion with the MLV receptor mCAT1 (mCAT1–CFP) 8. Infected cells were readily identified by the presence of retroviral particles, observed as punctae displaying both YFP and CFP fluorescence (Fig. 1A). Receptor-expressing target cells were characterized by homogeneous CFP fluorescence at the plasma membrane. Strikingly, essentially all virus particles moving from infected to target cells migrated along thin, elongated filopodia (Fig. 1A and see Supplementary Information, Movie 1). The particles moved unidirectionally at an average rate of 0.7 μm min−1 (n = 117) and required, on average, approximately 18 min to move from one cell to the other (Fig. 1B, C). Identical observations were made when target cells were labelled with mCAT1–YFP (see Supplementary Information, Movie 2).
Figure 1.
MLV moves from cell-to-cell along filopodial bridges. (A) Cos-1 cells generating infectious MLV labelled with Gag–CFP (green) and Env–YFP (red) were cocultured with target XC cells expressing mCAT1–CFP (green) and monitored by time-lapse microscopy. To illustrate the overall movement of viruses from cell to cell, 22 frames of the Supplementary Information, Movie 1 were superimposed. Arrows indicate the paths of five viral particles (a–e) undergoing transmission. (B) Single-particle tracking of particles a–e (shown in A) moving from the infected cell towards the non-infected target cells. (C) Average rates of particle movement, average transmission time and average distance travelled for 117 MLV particles undergoing cytonemal transmission. (D) Two arrays of individual frames from a time-lapse video covering approximately 15 min compare the stability of a filopodial bridge (upper panel; red, mCAT1–YFP) transporting viruses (green, MLV Gag–CFP) to that of an unanchored filopodium (lower panel). (E) Graphs indicating the lengths of five filopodial bridges compared with unanchored filopodia over time. The dotted lines represent the average length of either structure (5.8 ± 2.84 μm, n = 59 versus 2.37 ± 1.67 μm, n = 60). The scale bars represent 10 μm in A and 5 μm in D.
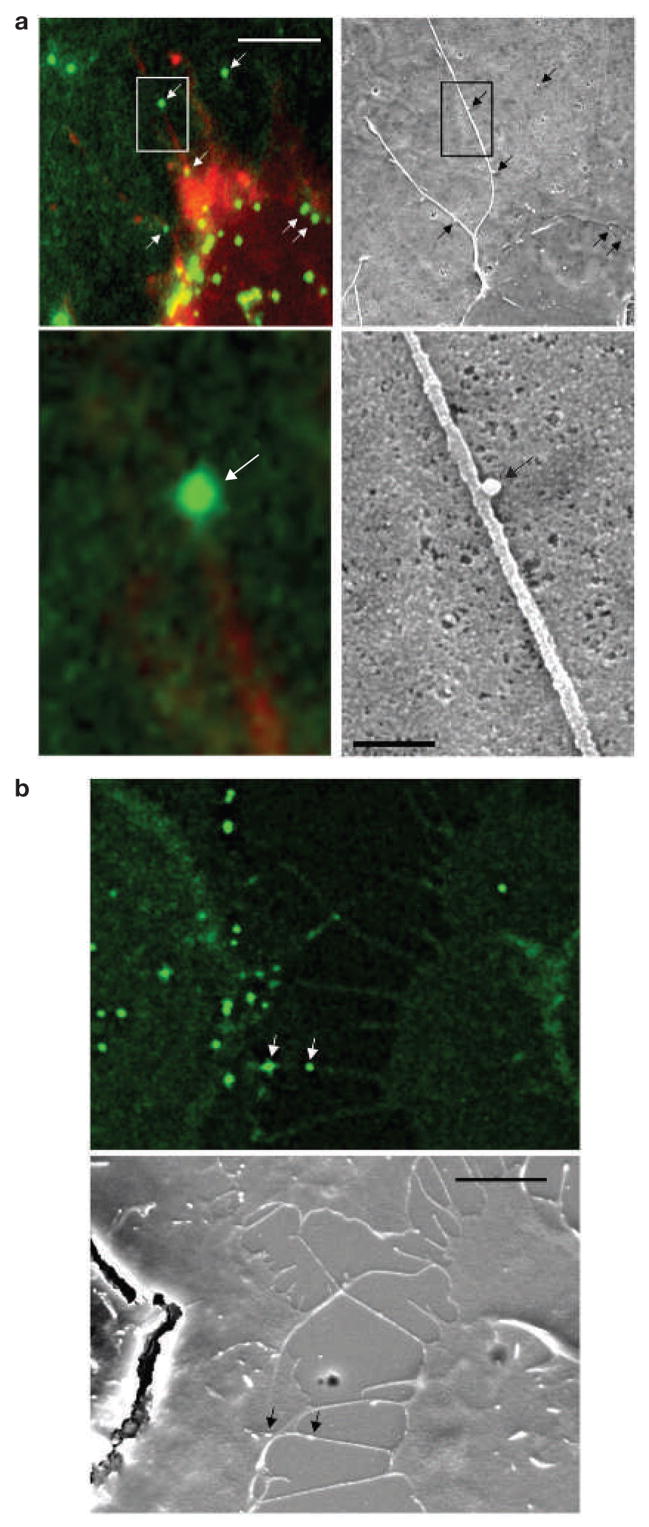
Filopodial bridges were only observed between infected and non-infected cells. They averaged 5.8 μm in length (n = 59) and were long lived (Fig. 1D, E; observed up to the maximum imaging time of 4 h). In contrast, normal filopodia of target cells that did not connect with an infected cell were significantly shorter (average length, 2.37 μm; n = 60) and highly dynamic, rapidly undergoing cycles of growth and retraction (Fig. 1D, E). To visualize moving viral particles at higher resolution, cells were cocultured on a coverslip with a lettered grid, and a filopodial bridge actively transporting virus was observed using a fluorescence microscope. The sample was then fixed and the same area visualized in the scanning electron microscope. The correlated images revealed that viral particles of a size of approximately 100 nm moved on the outer surface of 75–200-nm wide filopodial bridges (Fig. 2a, b). Hereafter, we refer to these filopodial bridges as viral cytonemes (neme meaning thread), because they share features with long-lived filopodia previously observed in the imaginal disc of Drosophila9–11. Cytonemes constitute stable cell–cell bridges thought to mediate the long-range transport of signalling molecules between cells.
Figure 2.
Viruses move along the outer surface of filopodial bridges toward target cells. (a, b) Fluorescently labelled viral particles (green, MLV Gag–CFP; white arrows) moving along filopodial bridges (red, mCAT1–YFP) correlated to single approximately 100-nm particles observed by scanning electron microscopy (black arrows). The boxed areas in the upper panels in a are magnified in the lower panels. The scale bars represent 5 μm in the upper panel in a and in b, and 500 nm in the lower panel in a.
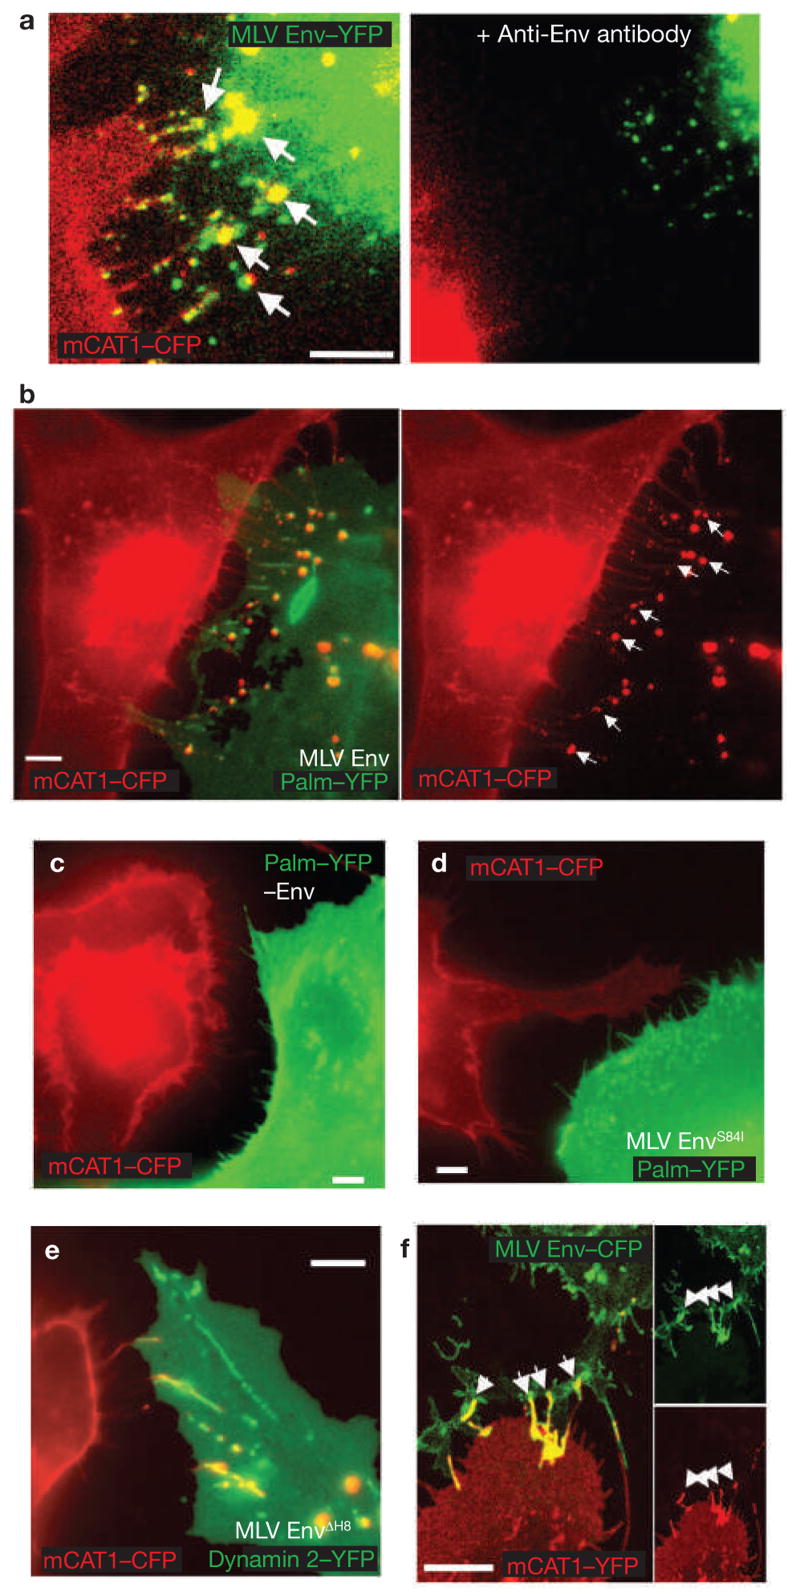
Viral cytonemes emanate from non-infected target cells (see Supplementary Information, Movies 1 and 2). Once filopodia encountered infected cells, viral receptor and Env concentrated at contact sites, suggesting that their interaction drives cytoneme formation (Fig. 3a). Furthermore, when neutralizing antibodies against the extracellular domain of Env were added, cytonemes fell apart (Fig. 3a) and the spreading of MLV from cell-to-cell was significantly reduced (see Supplementary Information, Fig. S1). Similarly, cytoneme formation was only observed when wild-type Env was expressed in virus-producing cells, but not in its absence (Fig. 3b, c). An Env mutant, carrying a point mutant in the receptor-binding domain that interferes with receptor binding (S84I)12, was impaired in its ability to establish viral cytonemes with receptor-expressing cells (Fig. 3d). In contrast, an Env point mutant capable of binding receptor, but blocked at a post-binding step (3H8)13, was capable of cytoneme formation (Fig. 3e). These results indicate that cytonemes are anchored by an interaction between Env and its receptor. In fact, Env expression alone, in the absence of other viral components, was sufficient to trigger cytoneme formation with receptor-expressing cells (Fig. 3f).
Figure 3.
Viral cytoneme formation depends on Env–receptor interactions. (a) An MLV infected Cos-1 cell expressing MLV Env–YFP (green) in coculture with an XC cell expressing mCAT1–YFP (red). The arrows indicate receptor–Env accumulation at filopodial contacts. The right panel shows the same area after 1 h treatment with neutralizing antibodies directed against the extracellular domain of MLV Env. (b) An MLV infected Cos-1 cell expressing unlabelled wild-type Env in coculture with an XC cell expressing mCAT1–CFP (red). To visualize the plasma membrane of virus producing cells, palmitylated YFP (palm–YFP, green) was coexpressed. Cytonemal contacts are indicated by white arrows. (c–e) Experiments as in b showing the behaviour of cell-cell contacts in the absence of Env expression (c), the expression of a mutant Env impaired in receptor-binding (S84I, d) or the expression of a mutant Env (ΔH8, e) capable of receptor-binding, but impaired in a post-binding step. In e, infected cells were identified by coexpression of the endocytic marker dynamin 2–YFP. (f) HEK 293 cells expressing MLV Env–CFP (green) in coculture with an XC cell expressing receptor mCAT1–YFP (red). Arrows indicated sites of Env–receptor accumulation. Panels on the right show unmerged images. The scale bars represent 5 μm in a–f.
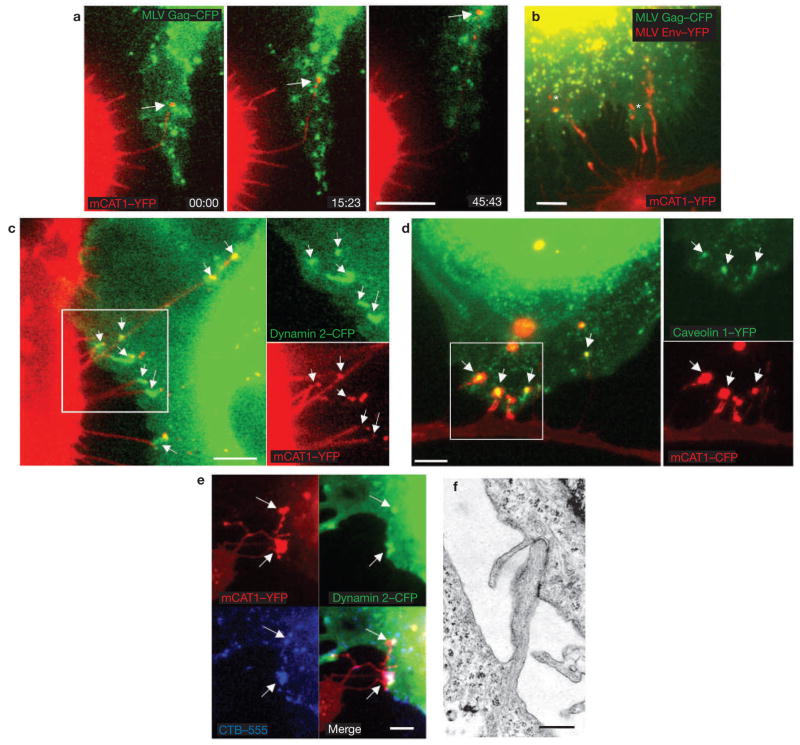
The increased length of the viral cytonemes was the result of pulling forces exerted by the infected cell. On initial contact, filopodia lengthened toward the centre of an infected cell (Fig. 4a and see Supplementary Information, Movie 3). Filopodia extension was accompanied by a net flow of membrane towards the infected cell, as visualized by the movement of fluorescent receptor molecules (Fig. 4b and see Supplementary Information, Movie 4). At the tip of the cytoneme, membrane fragments were frequently torn and released, followed by what seemed to be endocytosis into the infected cell. In addition, the tips of cytonemes colocalized at the infected cell surface with endocytic markers, such as dynamin 2, caveolin-1 and cholera toxin B-subunit, (Fig. 4c–e). Endocytosis of filopodia was also observed by transmission electron microscopy, which allowed visualization of numerous examples of filopodia tips invaginated into a neighbouring cell (Fig. 4f).
Figure 4.
Viral cytoneme formation is driven by endocytic forces in the infected cell. (a) An XC cell expressing fluorescent receptor mCAT1–YFP (red) in contact with an XC-cell generating MLV labelled with Gag–CFP (green). The images are frames (time, min:s) from the Supplementary Information, Movie 3. The arrow indicates a lengthening filopodium. (b) An XC cell expressing receptor mCAT1–YFP (lower cell, red) in coculture with a Cos-1 cell generating fluorescently labelled MLV virions (upper cell; MLV Gag–CFP, green). The asterisks indicate membrane fragments containing mCAT1–YFP (red) recently released from the tips of filopodia. The entire time-lapse can be viewed in the Supplementary Information, Movie 4. (c–e) XC cells expressing variants of mCAT1–GFP fusion proteins (red) in coculture with MLV–infected Cos-1 cells expressing either dynamin 2–CFP or caveolin1–YFP (green), as indicated. Cells in e were incubated with Alexa Fluor 555-labelled cholera toxin B subunit for 10 min to label GM1 (blue). Arrows indicate the accumulation of these proteins at sites of cytonemal contact. The boxed areas in c and d are shown as unmerged images on the right of these panels. (f) Transmission electron micrograph of a cell–cell contact observed in a coculture of infected Cos-1 cells (right) with receptor-expressing XC cells (left). The scale bars represent 5 μm in a–e and 200 nm in f.
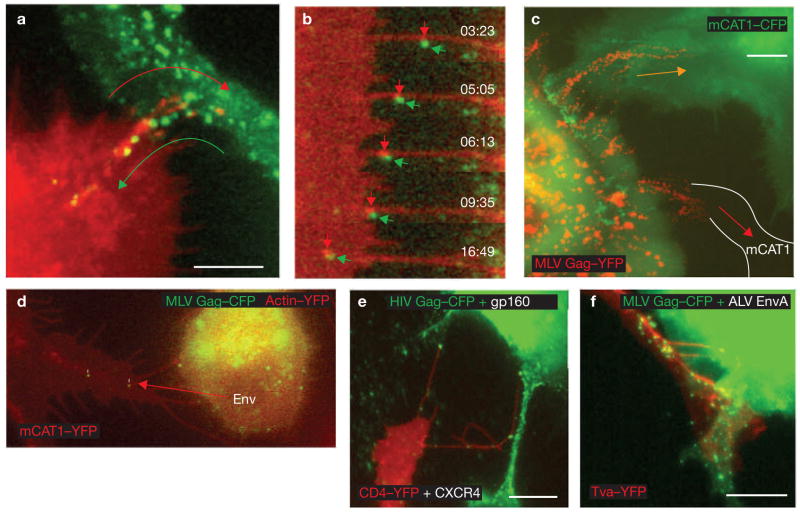
Virus particles need to bud from an infected cell before moving along the cytonemes — when virus budding was blocked by expression of a mutant Gag protein, virus transmission through cytonemes could be initiated, but was then stalled (see Supplementary Information, Movie 5). Remarkably, once associated with a cytoneme, infectious virus particles were able to move in the opposite direction of cytoneme extension (Fig. 5a and see Supplementary Information, Movie 6). Moving virus particles were generally accompanied by dots of fluorescent receptor, presumably representing receptor oligomerization in response to virus binding (Fig. 5b). Our previously published work studying virus entry explains why oligomerized receptor, together with a bound virus particle, moves towards the cell body of a non-infected cell — the receptor establishes a cytoplasmic link with the underlying actin cytoskeleton and engages its retrograde flow8. As expected from this mechanism, the virus particles moved less rapidly when they reached the lamellum at the base of a filopodium (Fig. 1C), where actin flow is slower14. Furthermore, in coculture assays, reagents known to interfere with the actin–myosin machinery inhibited viral spread from infected to uninfected cells (see Supplementary Information, Fig. S1). The role of actin in cell-to-cell transmission is likely to be distinct from the moderate role of actin during virus budding, as well as virus entry (see Supplementary Information, Fig. S1)8,15.
Figure 5.
Cytonemes mediate cell-to-cell transmission of retroviruses. (a) Frames from time-lapse imaging, as described in Fig. 1a, were superimposed. The two arrows illustrate the opposing movements at cytonemal contacts — the lengthening and internalization of receptor-expressing filopodium (red, mCAT1–YFP) and the movement of viral particles (green, MLV Gag–CFP). The entire sequence is shown in the Supplementary Information, Movie 6. (b) Enlargements of individual frames of the experiment shown in Fig. 1d to illustrate the concentration of receptor (red, mCAT1–YFP) beneath the moving viral particle (green, MLV Gag–CFP). (c) Coculture of infected Cos-1 cells generating MLV labelled with Gag–YFP (red) with XC cells that express (green, mCAT1–CFP) or do not express additional viral receptor (white lines in cell expressing unlabelled endogenous mCAT1). The image represents 69 superimposed frames from a 69 min time-lapse movie. Paths of virus transfer are indicated by arrows. (d) An XC cell chronically infected with MLV efficiently transmits virus particles to target cells in the absence of additional viral Env expression. The region of interest is also shown in the Supplementary Information, Movie 2. (e, f) Cytoneme formation and particle transport were also observed for the envelope–receptor combinations HIV-1 Env–CD4–YFP–CXCR4 (see Supplementary Information, Movie 7) and ALV EnvA–receptor Tva–YFP as indicated. The scale bars represent 5 μm in a and c and 10 μm in e and f.
The observed mechanism of virus spreading through cytonemes seems to be quite general. It was observed with different types of donor and recipient cells (Cos-1, XC or HEK 293 cells for virus production, and XC, DFJ8 or HEK 293 cells as targets). In each case, target-cell filopodia were observed stably anchored to the cell body of an infected cell. In addition, cytoneme formation did not require overexpression of either receptor or Env. Virus particles were detected trafficking unidirectionally towards XC cells expressing endogenous levels of unlabelled mCAT1 (Fig. 5c) and cytonemes formed anchorages to chronically infected cells in the absence of additional CMV-driven plasmids encoding Env (Fig. 5d and see Supplementary Information, Movie 2). Furthermore, the induction of cytonemes was observed for additional retroviruses. For example, the human immunodeficiency virus-1 (HIV-1) was transported along cytonemes formed between infected cells and target cells expressing the receptor–coreceptor pair, CD4 and CXCR4 (Fig. 5e and see Supplementary Information, Movie 7). Likewise, MLV capsids carrying the subgroup A glycoprotein (EnvA) of the avian leukosis virus (ALV) travelled along the cytonemes formed between infected cells and target cells expressing the ALV receptor Tva16,17 (Fig. 5f and data not shown). In the latter case, a transmission electron micrograph was captured (see Supplementary Information, Fig. S2) that showed virus particles at a cytonemal contact site (blue arrow), with one particle budding at the side of the infected cell (green arrow), several particles bound to the surface of filopodia — potentially en route from the virus-producing cell toward the target cell (black arrows) — and multiple particles in the process of internalization at the base of filopodia (red arrows).
Our ability to directly visualize the spread of retroviruses in living cells has revealed an unexpected mechanism of cell-to-cell transmission, which involves the transport of virus particles along filopodial bridges. These viral cytonemes originate from non-infected cells, are stabilized by Env–receptor interactions, and allow budded virus particles to use actin-based retrograde flow of the receptors to travel towards the non-infected cell. Repeated cycles of cytonemal transmission may contribute to the efficiency of virus spreading throughout a cell population (see Supplementary Information, Movie 8).
Virus transmission along cytonemes seems to be morphologically distinct from the reported HIV and HTLV transmission through the synaptic interfaces of primary immune cells3–6. The manner in which both modes of transmission relate to each other, and how viruses are transmitted in vivo, is unknown. Specific viruses and cell types may prefer one mode of transmission to the other: for example, viruses that preferentially infect antigen-presenting cells (APCs) may favour transmission through synaptic interactions. APCs (such as dendritic cells, macrophages and B-cells) form immunological synapses with T-cells, which can be exploited by viruses for cell-to-cell transmission4. Interestingly, a number of APCs, previously believed to be only associated with synaptic virus transmission events, have also been observed to form long filopodial bridges18–20. Thus, APCs may support both modes of cell–cell communication. Filopodial contacts may eventually mature into synapses, as observed during neurosynaptogenesis21,22, or exist in parallel. As such, cytonemes may represent a general alternative mechanism of cell–cell communication that could be exploited by retroviruses for the purpose of viral spread.
METHODS
Reagents and cell lines
Polyclonal anti-MLV Env antiserum was obtained from Quality Biotech (Camden, NJ). Cytochalasin D, myosin light chain inhibitor ML-9, latrunculin B, nocodazole and sodium azide were purchased from Sigma-Aldrich (St Louis, MO). Cholera Toxin subunit B conjugated to Alexa Fluor 555 was obtained from Invitrogen (Carlsbad, CA). Transfection using FuGene 6 (Roche, Basel, Switzerland) of 293 cells or Cos-1 cells for the generation of fluorescently labelled wild-type or mutant MLV was as previously described7. Plasmids encoding the ALV subgroup A glycoprotein, Tva–YFP and palmitylated YFP were as previously described8,23. Plasmids encoding dynamin 2–GFP24 and caveolin-1–GFP 25 were gifts from P. De Camilli (Yale University, New Haven, CT) and A. Helenius (ETH Zurich, Switzerland), respectively. Rat XC sarcoma cells26 chronically infected with replication-competent Moloney MLV were transduced with lentiviruses encoding MLV Gag–CFP using the HELIX transduction system (a gift from G. Nolan, Stanford University, Palo Alto, CA). Cos-1 cells producing HIV were generated by transient transfection using plasmids encoding HIV Gag–Pol (a gift from G. Nolan), HIV Env (a gift from H. Gottlinger, University of Massachusetts, Worcester, MA) and HIV Gag–CFP 7. Plasmids encoding CD4–YFP and CXCR4 were a gift from T. Hope (Northwestern University, Chicago, IL). Plasmids encoding mutant Friend MLV Env (S84I, 3H8) were a gift from J. Cunningham (Harvard Medical School, Boston, MA)12,13. Rat XC sarcoma cells stably expressing mCAT1–YFP and CFP7 were generated by selection using 1 mg ml−1 G418 (Invitrogen). 293, Cos-1 and DFJ8 (ref. 7) cells were cultured in high-glucose DMEM (Invitrogen) containing 10% FBS plus pen–strep–glutamine. XC cells were grown in MEM (Invitrogen) with 10% FBS plus pen–strep–glutamine.
Imaging
Transfection and live-cell imaging was as previously described7, 8 using the 60× oil objective (NA 1.4) of a Nikon TE2000 inverted wide-field microscope or the 100× oil objective (NA 1.4) of an LSM 510 confocal microscope equipped with a Zeiss Axiovert 100M base. For coculture movies, receptor-expressing target cells were plated on 35-mm imaging dishes (MatTek, Ashland, MA) overnight at low (10–30%) confluency before adding cells generating fluorescently labelled infectious virus. Imaging was carried out 2–6 h after coculture. For time-lapse movies, CFP and YFP channels were imaged every 10–60 s. In most cases, receptor fluorescence was pseudo-coloured red, with viral or cellular markers presented in green or blue. All time-lapse movies were edited using Openlab software (Improvision, Lexington, MA) and saved for presentation in Quicktime format using Sorensen 3 compression. Single-particle tracking was performed using Openlab and Volocity software (Improvision, Lexington, MA). Relative position and velocity were calculated for each particle based on movement to or from the cell body, defined by the inner edge of the lamellum. For correlative fluorescence and scanning electron microscopy, cells were cocultured on MatTek dishes (MatTek, Ashland, MA) carrying an etched grid for cell re-identification. Immediately after live imaging, cells were fixed in 4% PFA, washed three times with PBS and then returned to the wide-field fluorescence microscope. Serial sections (0.4 3m) were acquired for deconvolution using Volocity software (Improvision, Lexington, MA). Samples were then processed for scanning electron microscopy as previously described8. The grid was used to re-identify regions of interest. Thin-section electron microscopy was as previously described8.
Viral transmission assay
HEK 293 cells generating infectious MLV encoding GFP were generated as previously described (pLZRS–GFP; I. Mellman, Yale University, New Haven)7,16. XC target cells were plated on 24-well dishes and grown overnight to achieve a confluency of 50%. Antibodies, DMSO or reagents that disrupt the cytoskeleton were added to virus-producing cells and target cells 1 h before the beginning of coculture. Virus-producing cells were added to target cells at a ratio of 1:2, resulting in a final confluency of 75%. Following a 3–4 h incubation, cells were trypsinized to disrupt cell–cell contacts and replated at a 1–5% confluency (a dilution of approximately 25-fold) to prevent further contacts. Cells were harvested for FACS analysis at 24 h and scored for the relative number of GFP-positive cells. To establish a baseline for any virus transmission occurring because of viruses that were released into the culture supernatant, equivalent numbers of target and producer cells were plated separately for 3–4 h and then replated together at 1–5% confluency on 6-well plates. Budding assays to gauge the release of infectious MLV from 293 cells were performed, as previously described7,16, by generating MLV particles carrying a viral genome for the expression of GFP. At 48 h posttransfection, cells were washed five times in PBS and then incubated in the indicated drugs for 6 h. Viral supernatants were then collected, filtered and diluted for titration on XC target cells. At 2 h post-infection, target cells were washed five times in PBS and incubated in fresh media for 48 h before scoring for infection by FACS detection of GFP expression. To gauge viral entry, equivalent amounts of GFP-encoding virus was added to XC cells in the presence of the indicated drugs for 4 h before washing and FACS detection, as described above.
Supplementary Material
Acknowledgments
We are grateful to T. Rapoport for his support. We thank Z. Jiang for assistance with scanning electron microscopy, and P. Uchil and J. Jin for critical reading of the manuscript. This work was supported by National Institutes of Health (NIH) grants R01CA098727 and R21 AI065284, as well as the Searle Scholars Program to W.M., and a Leopoldina Fellowship BMBF-LPD 9901/8-75 to M.L.
Footnotes
COMPETING FINANCIAL INTERESTS
The authors declare that they have no competing financial interests.
Reprints and permissions information is available online at http://npg.nature.com/reprintsandpermissions/
Note: Supplementary Information is available on the Nature Cell Biology website.
AUTHOR CONTRIBUTIONS
N.M.S, with support from M.J.L, L.F.J.-S. and W.M. were responsible for the experimental work. C.H. and M.P. performed transmission electron microscopy. W.M. and N.M.S. were involved in project planning, data analysis and writing.
References
- 1.Dimitrov DS, et al. Quantitation of human immunodeficiency virus type 1 infection kinetics. J Virol. 1993;67:2182–2190. doi: 10.1128/jvi.67.4.2182-2190.1993. [DOI] [PMC free article] [PubMed] [Google Scholar]
- 2.Carr JM, Hocking H, Li P, Burrell CJ. Rapid and efficient cell-to-cell transmission of human immunodeficiency virus infection from monocyte-derived macrophages to peripheral blood lymphocytes. Virology. 1999;265:319–329. doi: 10.1006/viro.1999.0047. [DOI] [PubMed] [Google Scholar]
- 3.Igakura T, et al. Spread of HTLV-I between lymphocytes by virus-induced polarization of the cytoskeleton. Science. 2003;299:1713–1716. doi: 10.1126/science.1080115. [DOI] [PubMed] [Google Scholar]
- 4.McDonald D, et al. Recruitment of HIV and its receptors to dendritic cell-T cell junctions. Science. 2003;300:1295–1297. doi: 10.1126/science.1084238. [DOI] [PubMed] [Google Scholar]
- 5.Jolly C, Kashefi K, Hollinshead M, Sattentau QJ. HIV-1 cell to cell transfer across an Env-induced, actin-dependent synapse. J Exp Med. 2004;199:283–293. doi: 10.1084/jem.20030648. [DOI] [PMC free article] [PubMed] [Google Scholar]
- 6.Alfsen A, Yu H, Magerus-Chatinet A, Schmitt A, Bomsel M. HIV-1-infected blood mononuclear cells form an integrin- and agrin-dependent viral synapse to induce efficient HIV-1 transcytosis across epithelial cell monolayer. Mol Biol Cell. 2005;16:4267–4279. doi: 10.1091/mbc.E05-03-0192. [DOI] [PMC free article] [PubMed] [Google Scholar]
- 7.Sherer NM, et al. Visualization of retroviral replication in living cells reveals budding into multivesicular bodies. Traffic. 2003;4:785–801. doi: 10.1034/j.1600-0854.2003.00135.x. [DOI] [PubMed] [Google Scholar]
- 8.Lehmann MJ, Sherer NM, Marks CB, Pypaert M, Mothes W. Actin- and myosin-driven movement of viruses along filopodia precedes their entry into cells. J Cell Biol. 2005;170:317–325. doi: 10.1083/jcb.200503059. [DOI] [PMC free article] [PubMed] [Google Scholar]
- 9.Ramirez-Weber FA, Kornberg TB. Cytonemes: cellular processes that project to the principal signaling center in Drosophila imaginal discs. Cell. 1999;97:599–607. doi: 10.1016/s0092-8674(00)80771-0. [DOI] [PubMed] [Google Scholar]
- 10.De Joussineau C, et al. Delta-promoted filopodia mediate long-range lateral inhibition in Drosophila. Nature. 2003;426:555–559. doi: 10.1038/nature02157. [DOI] [PubMed] [Google Scholar]
- 11.Hsiung F, Ramirez-Weber FA, Iwaki DD, Kornberg TB. Dependence of Drosophila wing imaginal disc cytonemes on Decapentaplegic. Nature. 2005;437:560–563. doi: 10.1038/nature03951. [DOI] [PubMed] [Google Scholar]
- 12.Davey RA, Zuo Y, Cunningham JM. Identification of a receptor-binding pocket on the envelope protein of friend murine leukemia virus. J Virol. 1999;73:3758–3763. doi: 10.1128/jvi.73.5.3758-3763.1999. [DOI] [PMC free article] [PubMed] [Google Scholar]
- 13.Zavorotinskaya T, Qian Z, Franks J, Albritton LM. A point mutation in the binding subunit of a retroviral envelope protein arrests virus entry at hemifusion. J Virol. 2004;78:473–481. doi: 10.1128/JVI.78.1.473-481.2004. [DOI] [PMC free article] [PubMed] [Google Scholar]
- 14.Ponti A, Machacek M, Gupton SL, Waterman-Storer CM, Danuser G. Two distinct actin networks drive the protrusion of migrating cells. Science. 2004;305:1782–1786. doi: 10.1126/science.1100533. [DOI] [PubMed] [Google Scholar]
- 15.Chen C, Weisz OA, Stolz DB, Watkins SC, Montelaro RC. Differential effects of actin cytoskeleton dynamics on equine infectious anemia virus particle production. J Virol. 2004;78:882–891. doi: 10.1128/JVI.78.2.882-891.2004. [DOI] [PMC free article] [PubMed] [Google Scholar]
- 16.Mothes W, Boerger AL, Narayan S, Cunningham JM, Young JA. Retroviral entry mediated by receptor priming and low pH triggering of an envelope glycoprotein. Cell. 2000;103:679–689. doi: 10.1016/s0092-8674(00)00170-7. [DOI] [PubMed] [Google Scholar]
- 17.Bates P, Young JA, Varmus HE. A receptor for subgroup A Rous sarcoma virus is related to the low density lipoprotein receptor. Cell. 1993;74:1043–1051. doi: 10.1016/0092-8674(93)90726-7. [DOI] [PubMed] [Google Scholar]
- 18.Watkins SC, Salter RD. Functional connectivity between immune cells mediated by tunneling nanotubules. Immunity. 2005;23:309–318. doi: 10.1016/j.immuni.2005.08.009. [DOI] [PubMed] [Google Scholar]
- 19.Gupta N, DeFranco AL. Visualizing lipid raft dynamics and early signaling events during antigen receptor-mediated B-lymphocyte activation. Mol Biol Cell. 2003;14:432–444. doi: 10.1091/mbc.02-05-0078. [DOI] [PMC free article] [PubMed] [Google Scholar]
- 20.Onfelt B, et al. Structurally distinct membrane nanotubes between human macrophages support long-distance vesicular traffic or surfing of bacteria. J Immunol. 2006;177:8476–8483. doi: 10.4049/jimmunol.177.12.8476. [DOI] [PubMed] [Google Scholar]
- 21.Ziv NE, Smith SJ. Evidence for a role of dendritic filopodia in synaptogenesis and spine formation. Neuron. 1996;17:91–102. doi: 10.1016/s0896-6273(00)80283-4. [DOI] [PubMed] [Google Scholar]
- 22.Niell CM, Meyer MP, Smith SJ. In vivo imaging of synapse formation on a growing dendritic arbor. Nature Neurosci. 2004;7:254–260. doi: 10.1038/nn1191. [DOI] [PubMed] [Google Scholar]
- 23.Melikyan GB, Barnard RJ, Abrahamyan LG, Mothes W, Young JA. Imaging individual retroviral fusion events: from hemifusion to pore formation and growth. Proc Natl Acad Sci USA. 2005;102:8728–8733. doi: 10.1073/pnas.0501864102. [DOI] [PMC free article] [PubMed] [Google Scholar]
- 24.Ochoa GC, et al. A functional link between dynamin and the actin cytoskeleton at podosomes. J Cell Biol. 2000;150:377–389. doi: 10.1083/jcb.150.2.377. [DOI] [PMC free article] [PubMed] [Google Scholar]
- 25.Pelkmans L, Kartenbeck J, Helenius A. Caveolar endocytosis of simian virus 40 reveals a new two-step vesicular-transport pathway to the ER. Nature Cell Biol. 2001;3:473–483. doi: 10.1038/35074539. [DOI] [PubMed] [Google Scholar]
- 26.Klement V, Rowe WP, Hartley JW, Pugh WE. Mixed culture cytopathogenicity: a new test for growth of murine leukemia viruses in tissue culture. Proc Natl Acad Sci USA. 1969;63:753–758. doi: 10.1073/pnas.63.3.753. [DOI] [PMC free article] [PubMed] [Google Scholar]
Associated Data
This section collects any data citations, data availability statements, or supplementary materials included in this article.


