Abstract
Context:
Generalizability theory is an appropriate method for determining the reliability of measurements obtained across more than a single facet. In the clinical and research settings, ankle-complex laxity assessment may be performed using different examiners and multiple trials.
Objective:
To determine the reliability of ankle-complex laxity measurements across different examiners and multiple trials using generalizability theory.
Design:
Correlational study.
Setting:
Laboratory.
Patients or Other Participants:
Forty male university students without a history of ankle injury.
Main Outcome Measure(s):
Measures of right ankle-complex anteroposterior and inversion-eversion laxity were obtained by 2 examiners. Each examiner performed 2 anteroposterior trials, followed by 2 inversion-eversion trials for each ankle at 0° of ankle flexion. Using generalizability theory, we performed G study and D study analyses.
Results:
More measurement error was found for facets associated with examiner than with trial for both anteroposterior and inversion-eversion laxity. Inversion-eversion measurement was more reliable than anteroposterior laxity measurement. Although 1 examiner and 1 trial had acceptable reliability (G coefficient ≥ .848), increasing the number of examiners increased reliability to a greater extent than did increasing the number of trials.
Conclusions:
Within the range of examiner and trial facets studied, any combination of examiners or trials (or both) above 1 can change ankle laxity measurement reliability from acceptable (1 examiner, 1 trial) to highly reliable (3 examiners, 3 trials). Individuals may respond to examiners and their procedural nuances differently; thus, standardized procedures are important.
Keywords: correlation analysis, measurement reliability, ankle laxity
Key Points
Generalizability theory in ankle laxity research is useful in determining reliability of measurements.
Inversion-eversion measurement was more reliable than anteroposterior laxity measurement.
More measurement error was associated with examiner facets than with trial facets for both anteroposterior and inversion-eversion laxity.
Clinical measurement of ankle joint and subtalar joint instability traditionally involves stress radiography and manual examination techniques, such as the anterior drawer, talar tilt, and inversion-eversion stress tests.1–5 Inherent subjectivity, unreliability, and lack of practicality have been cited as limitations to these assessment procedures and instruments.6,7 Recently, a portable ankle arthrometer was developed that quantifies anteroposterior (AP) load displacement and inversion-eversion (IE) rotation.8–11 The ankle arthrometer allows for the instrumented assessment of ankle-complex laxity by measuring the motion of the ankle-subtalar joint complex via a 6-degrees-of-freedom spatial-kinematic linkage system.11–13 Large coefficients for intratester reliability (AP displacement: range, .91 to .82; IE rotation: range, .93 to .99) and intertester reliability (AP displacement: .80; IE rotation: .98) have been reported.10,11,14–16
Generalizability theory (G theory) has been presented as a way to refine the designs of measurement procedures in an attempt to yield reliable data.17–20 Serving as an alternative to the more familiar classical measurement theory, which yields the less useful intraclass correlation coefficients,21,22 G theory addresses the dependability of measurements and allows for the simultaneous estimation of multiple sources of variance, including interactions.18,19,20 If the measurement errors associated with the different facets of the study interact with one another, G theory reliability estimates may be markedly different from classical test theory reliability estimates.19
In G theory, a distinction is made between 2 types of studies: G studies and D studies. A G study quantifies the amount of variance associated with the different facets (factors) that are being examined. A D study provides information about which protocols are optimal for a particular measurement situation by generating generalizability (G) coefficients that can be interpreted as reliability coefficients across various facets of the study. In the G study analysis, repeated-measures analysis of variance quantifies the amount of variance associated with each facet and any interactions. These sources of variance are used to determine which facets or interactions contribute the most to measurement error. Decisions then can be made regarding the manipulation or control of sources of variance. The D study provides information that is used to make decisions concerning the most stable and efficient measurement protocols.18 Traditional test-retest reliability coefficients are limited to only 2 scores, whereas intraclass models allow any number of repeated scores. However, when using G theory, it is possible to include any number of factors that can influence reliability. For example, when assessing body composition using skinfold measurement techniques, many factors can affect reliability, such as the participants, the caliper, the tester, the day, the amount of training, the skinfold site, and the number of trials taken at a given site. These variables contribute to either true score variation among participants or measurement error. With G theory, all of these variables and others that are thought to be potential sources of error can be incorporated into a model that estimates reliability.20
In the clinical and research settings, ankle-complex laxity assessment may be performed with different examiners and over multiple trials to increase reliability2,11,14,15; thus, it appears important to determine measurement reliability based on G theory.17,20 In this study, we demonstrate the application of generalizability analysis to investigating the amount of variation associated with the facets of different examiners and multiple trials in the assessment of AP and IE ankle-complex laxity. We examined various models to determine which combination of examiners and trials produced the most acceptable reliability.
Methods
Participants
Forty male university students (age = 23.8 ± 4.4 years, height = 86.7 ± 14.8 kg, mass = 170 ± 15.8 cm) without a history of ankle injury volunteered to undergo testing. The institutional review board of the university approved the study. All participants gave informed consent.
Instrumentation
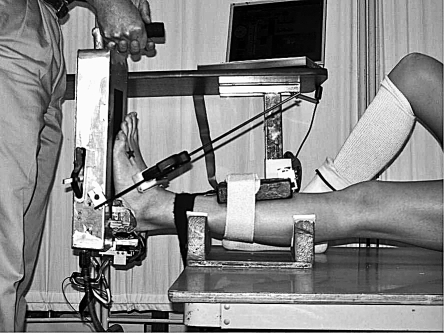
Measurement of ankle-subtalar joint laxity was performed using an instrumented ankle arthrometer (Blue Bay Research, Inc, Navarre, FL).10,14,15 The arthrometer consists of an adjustable foot plate with nonskid material on the surface to which the foot is secured via adjustable dorsal and calcaneal foot clamps (Figure 1). A load-measuring handle attached to the foot plate enables loads to be applied to the skeletal and soft tissues of the ankle-subtalar joint complex. A pad attached to the tibia connects to the foot plate via a 6-degrees-of-freedom spatial-kinematic linkage system that measures all components of motion (3 rotations and 3 translations) of the foot plate relative to the tibial pad.9 The spatial kinematic linkage of the arthrometer measures the relative motion between the arthrometer foot plate and a reference pad attached to the tibia. Measurement quantifies the AP load displacement and IE rotational motion characteristics of the ankle-subtalar joint complex and represents the sum of the motions occurring in the ankle (talocrural) and subtalar (talocalcaneal) joints.11,12 High reliability of measurement has been shown for total laxity versus 1-way laxity of the neutral, unloaded ankle-joint complex.13 Thus, total AP displacement and total IE rotation are reported as ankle-complex laxity.
Figure 1. Ankle arthrometer.
A laptop computer with an analog-to-digital converter was used to simultaneously calculate and record data. A custom software program written in LabVIEW (version 7; National Instruments, Austin, TX) recorded AP displacement (millimeters) and IE rotation (degrees of range of motion), along with the corresponding AP load and IE torque.
Test Procedures
Before reporting to the laboratory on the day of testing, each participant refrained from physical activity to avoid joint and soft tissue temperature changes that could affect ankle laxity. Volunteers participated in 1 test session, at which all ankle laxity measurements were obtained. Two examiners with experience in testing (ie, more than 1000 hours spent working with the ankle arthrometer) measured laxity of the right ankle of each participant.14 Testing order was counterbalanced between examiners. Each examiner performed 2 AP trials, followed by 2 IE trials for each ankle at 0° of ankle flexion. The 0° of ankle flexion angle was measured from the plantar surface of the foot relative to the anterior tibial pad using an electrogoniometer within the arthrometer. The ankle arthrometer was removed and reapplied between examiners and trials.
Based on procedures previously reported for the ankle arthrometer, AP loading was performed first, followed by IE loading.10,15,16 The knee was positioned in 0° to 10° of flexion and a restraining strap was applied 1 cm above the malleoli to prevent lower leg movement during loading. Once the foot was secured on the foot plate, the tibial pad was positioned 5 cm above the ankle malleoli and was secured to the lower leg with hook-and-loop straps. The ankle was positioned at zero AP load and zero IE moment at a neutral (0°) flexion angle, which was defined as the measurement reference position. Starting at the measurement reference position, anterior loading was applied first, followed by posterior loading. Total displacement was the sum of anterior translation and posterior translation at the 125-N force load. For IE rotation, the ankles were loaded to 4 N⋅m of inversion-eversion torque. Starting at the measurement reference position, inversion loading was applied first, followed by eversion loading. Total IE rotation (degrees of range of motion) was the sum of inversion and eversion rotation.
Statistical Analysis
G Study
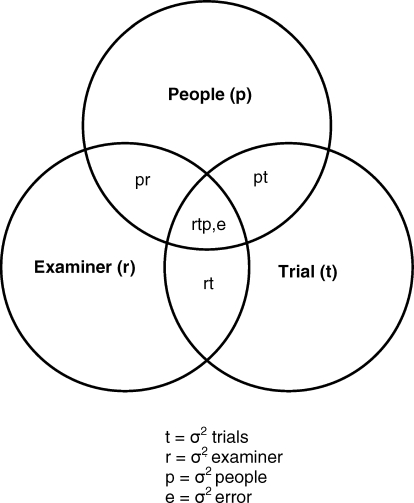
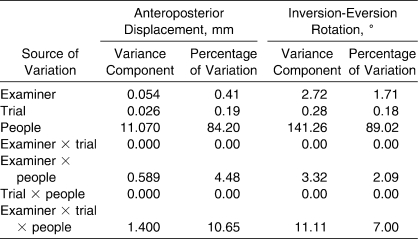
A fully crossed, 2-facet random-effects analysis of variance (ANOVA) was calculated for each of the 2 dependent measures (universe scores = AP and IE laxity). From the results of the random-effects ANOVAs, variance components were computed for (1) examiner, trial, and people facets; (2) examiner, trial, and people interactions; and (3) the residual variance component (Figure 2). The percentage of the total variance for each variance estimate was calculated by dividing each variance estimate by the total variance. Data were analyzed with SPSS (version 15.0; SPSS Inc, Chicago, IL) to calculate variance components and the ANOVAs.
Figure 2. Venn diagram for a 2-facet design (p × r × t).
D Study
Follow-up D studies to estimate reliability coefficients were conducted using examiner, trial, and people as facets. Reliability coefficients higher than .80 were considered desirable. If a negative variance estimate resulted from sampling error, zero was substituted for the negative variance estimate for computational purposes.20 Follow-up D studies estimated both G and φ coefficients for making relative and absolute interpretations. In G theory, differentiation between relative (G coefficient) and absolute (φ coefficient) differences in the measures is important. The G coefficient reflects the “relative” amount of variation associated with a given facet or its associated interactions. In relation to the total variation, a given percentage of the variance is associated with the particular facet. To investigate the absolute variation (φ coefficient), we obtained absolute error variance by summing the estimated error variances for the examiner, trial, and interaction variance components.23
Results
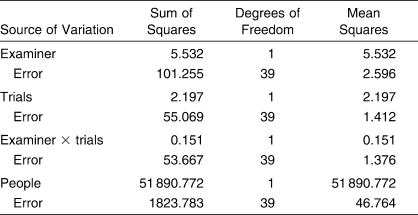
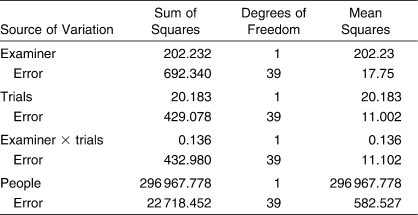
Marginal means for each facet across AP and IE laxity are reported in Table 1. The ANOVA source tables for AP and IE laxity are shown in Tables 2 and 3, respectively. For the G study phase of the investigation, variance components and percentage of variations for AP and IE laxity are shown in Table 4. The G study results for AP laxity showed that the largest percentage of variance was among people, accounting for approximately 84% of the total variation. Approximately 10% of the variance was undifferentiated error associated with the people × trial × examiner interaction. The largest remaining source of partitioned variance was the people × examiner interaction, which accounted for approximately 4.5% of the variation. The remaining facets and interactions (examiner, trial, trial × people, and examiner × trial interaction) were collectively associated with only 0.66% of the variation.
Table 1.
Laxity Characteristics of the Ankle Complex Across Examiners and Trials (Mean ± SD)
Table 2.
Anteroposterior Displacement: Analysis of Variance Source Table
Table 3.
Inversion-Eversion Rotation: Analysis of Variance Source Table
Table 4.
Generalizability Study Variance and Percentage of Variation Components for Ankle Complex Laxity
The G study results for IE laxity were similar to those for AP laxity. The largest percentage of variance was among people, accounting for approximately 89%. The second largest source of variance was the examiner × trial × people interaction, which accounted for 7% of the variance, followed by the examiner × people interaction, accounting for approximately 2% of the variance. The remaining facets and interactions collectively accounted for 1.89% of the variance.
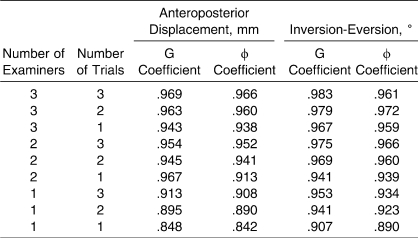
The D study results presented in Table 5 show acceptable reliability coefficients (G and φ coefficients > .80) for both AP and IE laxity. In addition, Table 5 shows the effects of the various levels of trials and examiners on reliability. The projected coefficients for AP and IE laxity also display a range of reliability coefficients (AP = .842 to .969, IE = .890 to .979), depending on the combination of trials and examiners.
Table 5.
D Study Results Using G and φ Coefficients of Ankle Complex Laxity for Examiner-Trial Combinations
Discussion
Generalizability theory is used to determine measurement reliability when multiple sources of variation can contribute to measurement error. This type of analysis cannot be performed using the more traditional interclass reliability models, because only 2 scores are used to compute a reliability coefficient with these models. Compared with classical reliability theory, G theory possesses 3 major advantages for determining the most efficient and reliable protocol for arthrometric measurement of ankle-complex laxity: (1) More than 2 scores per person can be used. (2) Different sources of variability and the extent of those sources can be examined. (3) Procedures are used to determine the effects of varying the number of examiners and trials on measurement reliability.18,19,20
We used G theory analysis to examine ankle-complex laxity measurement to determine the most practical and efficient protocol for the clinician assessing ankle laxity. The D study results showed that 1 trial with 1 examiner yielded acceptable G and φ coefficients that ranged from .842 to .907. Even higher coefficients (.983) were found as more examiners and trials were added to the analysis (Table 5). This is a useful finding, in that the reliability of the test improved as the number of scores increased, and it further reveals the importance of collectively examining different and potential variables that affect measurement reliability of ankle-complex laxity.20
Measurement reliability is important if quantitative assessment with the portable ankle arthrometer is to be used to differentiate normal ankle laxity from ankle instability. Knowing the most efficient and precise protocol for measurement and which facets account for the greatest variance is important to help standardize procedures for its use. First, examiner training is required to learn to operate the device properly, so knowing the intertester reliability is important.14 Second, having different examiners taking preinjury and postinjury assessments can affect laxity measurements. Third, performing bilateral ankle laxity measurements can be relatively time consuming (15 to 20 minutes per session), so knowing the fewest number of trials necessary to obtain a reliable measurement is also important. This factor would be particularly essential when testing large numbers of ankles in a session, as is the case when measurements are performed as part of the preparticipation physical examination. Fourth, in situations in which high levels of precision are important (ie, when comparing injured with uninjured ankles or determining the effects of rehabilitation on ankle stability), it is necessary to know how much precision is gained by performing additional trials in a session. Last, although they are not painful, the arthrometer clamps positioned on the foot during testing may not be physically comfortable for some individuals, so performing the fewest number of trials while still retaining acceptable reliability is another consideration when examining measurement reliability.
Our results concur with previously reported reliability coefficients for instrumented measurement of ankle-complex laxity.10,14 For both AP and IE laxity, G study measures associated with examiner variance were greater than trial variance measures. The D study results showed that increasing the number of examiners influenced the stability of the coefficients to a greater extent than increasing the number of trials. These results concur with those of Hubbard et al,14 who reported good to excellent intraclass correlation coefficients (.80 to .99) between novice and experienced testers categorized by the number of hours logged in the use of the arthrometer. However, despite finding acceptable reliabilities, they also reported differences in AP displacement and IE rotation between the testers. They speculated that differences in laxity measurements between examiners could have been attributed to a procedural nuance caused by different rates of loading when performing the tests, which may have affected the viscoelastic properties of the tissues and, thus, the shape of the hysteresis curve.
Kovaleski et al10 reported additional sources of arthrometer measurement error, including an absence of muscle relaxation during loading, reflexive muscle tightening of the ankle caused by overtightening the clamps during loading, varying the pressure of the dorsal and heel clamps, and not testing at the same ankle flexion angle for comparative purposes. Previous authors have shown that the ankle complex is most lax at neutral when AP loading and most lax in plantar flexion when IE loading. Therefore, the ankle must be examined at the same flexion angle when side-to-side comparisons are made. It is important to note that most of the variation associated with the examiner component was examiner × people variation for both the AP and IE laxity measurements. Some participants could have responded differently to the 2 examiners by experiencing a different degree of apprehension regarding having their foot clamped or secured to the foot plate. Increased apprehension could have led to increased reflexive muscle tightening or an inability to relax. Reliability may have been influenced differentially depending on how tightly each examiner secured the foot clamps or how comfortable the participant was made to feel psychologically before and during measurement.
Conclusions
Application of G theory in ankle laxity research is useful in determining how many measurements are needed across the facets of examiners and trials in order to obtain reliable scores. The IE measurement was more reliable than the AP laxity measurement. The greatest amount of measurement error was for examiner facets compared with trial facets for both AP and IE laxity. Although 1 trial and 1 examiner had acceptable reliability, increasing the number of examiners improved reliability to a greater extent than increasing the number of trials. Within the range of examiner and trial facets studied, any combination of trials and examiners greater than one can change ankle laxity measurement reliability from acceptable (1 examiner, 1 trial) to highly reliable (3 examiners, 3 trials).
Footnotes
Robert J. Heitman, EdD, contributed to conception and design, acquisition of the data, and drafting and final approval of the paper. John E. Kovaleski, PhD, ATC, contributed to conception and design; acquisition and analysis and interpretation of the data; and drafting, critical revision, and final approval of the article. Steven F. Pugh, PhD, contributed to conception and design, acquisition of the data, and drafting, critical revision, and final approval of the paper.
References
- 1.van Hellemondt F.J, Louwerens J.W.K, Sijbrandij E.S, van Gils A.P.G. Stress radiography and stress examination of the talocrural and subtalar joint on helical computed tomography. Foot Ankle Int. 1997;18(8):482–488. doi: 10.1177/107110079701800805. [DOI] [PubMed] [Google Scholar]
- 2.Hertel J, Denegar C.R, Monroe M.M, Stokes W.L. Talocrural and subtalar joint instability after lateral ankle sprain. Med Sci Sports Exerc. 1999;31(11):1501–1508. doi: 10.1097/00005768-199911000-00002. [DOI] [PubMed] [Google Scholar]
- 3.Christensen J.C, Dockery G.L, Schuberth J.M. Evaluation of ankle ligamentous insufficiency using the Telos ankle stress apparatus. J Am Podiatr Med Assoc. 1986;76(9):527–531. doi: 10.7547/87507315-76-9-527. [DOI] [PubMed] [Google Scholar]
- 4.Rijke A.M, Jones B, Vierhout P.A. Stress examination of traumatized lateral ligaments of the ankle. Clin Orthop Relat Res. 1986;210:143–151. [PubMed] [Google Scholar]
- 5.Martin D.E, Kaplan P.A, Kahler D.M, Dussault R, Randolph B.J. Retrospective evaluation of graded stress examination of the ankle. Clin Orthop Relat Res. 1996;328:165–170. doi: 10.1097/00003086-199607000-00026. [DOI] [PubMed] [Google Scholar]
- 6.Fujii T, Luo Z, Kitaoka H.B, An K.N. The manual stress test may not be sufficient to differentiate ankle ligament injuries. Clin Biomech (Bristol, Avon) 2000;15(8):619–623. doi: 10.1016/s0268-0033(00)00020-6. [DOI] [PubMed] [Google Scholar]
- 7.Frost S.C, Amendola A. Is stress radiography necessary in the diagnosis of acute or chronic ankle instability. Clin J Sport Med. 1999;9(1):40–45. doi: 10.1097/00042752-199901000-00008. [DOI] [PubMed] [Google Scholar]
- 8. Hollis JM, inventor; Blue Bay Research, assignee. Ankle Laxity Measurement System. US patent 5,402,800. April 4, 1995.
- 9.Kinzel G.L, Hall A.S, Jr, Hillberry B.M. Measurement of the total motion between two body segments, I: analytical development. J Biomech. 1972;5(1):93–105. doi: 10.1016/0021-9290(72)90022-x. [DOI] [PubMed] [Google Scholar]
- 10.Kovaleski J.E, Gurchiek L.R, Heitman R.J, Hollis J.M, Pearsall A.W., IV Instrumented measurement of anteroposterior and inversion-eversion laxity of the normal ankle joint complex. Foot Ankle Int. 1999;20(12):808–814. doi: 10.1177/107110079902001210. [DOI] [PubMed] [Google Scholar]
- 11.Kovaleski J.E, Hollis J.M, Heitman R.J, Gurchiek L.R, Pearsall A.W., IV Assessment of ankle-subtalar-joint complex laxity using an instrumented ankle arthrometer: an experimental cadaveric investigation. J Athl Train. 2002;37(4):467–474. [PMC free article] [PubMed] [Google Scholar]
- 12.Hollis J.M, Blasier R.D, Flahiff C.M. Simulated lateral ankle ligamentous injury: change in ankle stability. Am J Sports Med. 1995;23(6):672–677. doi: 10.1177/036354659502300606. [DOI] [PubMed] [Google Scholar]
- 13.Siegler S, Wang D, Plasha E, Berman A.T. Technique for in vivo measurement of the three-dimensional kinematics and laxity characteristics of the ankle joint complex. J Orthop Res. 1994;12(3):421–431. doi: 10.1002/jor.1100120315. [DOI] [PubMed] [Google Scholar]
- 14.Hubbard T.J, Kovaleski J.E, Kaminski T.W. Reliability of intratester and intertester measurements derived from an instrumented ankle arthrometer. J Sport Rehabil. 2003;12(3):208–220. [Google Scholar]
- 15.Hubbard T.J, Kaminski T.W, Vander Griend R.A, Kovaleski J.E. Quantitative assessment of mechanical laxity in the functionally unstable ankle. Med Sci Sports Exerc. 2004;36(5):760–766. doi: 10.1249/01.mss.0000126604.85429.29. [DOI] [PubMed] [Google Scholar]
- 16.Wilkerson G.B, Kovaleski J.E, Meyer M, Stawiz C. Effects of the subtalar sling ankle taping technique on combined talocrural-subtalar joint motions. Foot Ankle Int. 2005;26(3):239–246. doi: 10.1177/107110070502600310. [DOI] [PubMed] [Google Scholar]
- 17.Ragan B.G, Kang M. Reliability: current issues and concerns. Athl Ther Today. 2005;10(6):30–33. [Google Scholar]
- 18.Shavelson R.L, Webb N.M. Generalizability Theory: A Primer. Thousand Oaks, CA, Sage: pp. 27–40. [Google Scholar]
- 19.Naizer G. Basic concepts in generalizability theory: a more powerful approach to evaluating reliability. http://www.eric.ed.gov. ERIC Document Reproduction Service No. ED341729. Accessed October 1, 2007.
- 20.Morrow J.R. Generalizability theory. In: Safrit M.J, Wood T.M, editors. Measurement Concepts in Physical Education and Exercise Science. Champaign, IL: Human Kinetics; 1989. pp. 73–96. [Google Scholar]
- 21.Shrout P.E, Fleiss J.L. Intraclass correlation: uses in assessing rater reliability. Psychol Bull. 1979;86(2):420–428. doi: 10.1037//0033-2909.86.2.420. [DOI] [PubMed] [Google Scholar]
- 22.Denegar C.R, Ball D.W. Assessing reliability and precision of measurement: an introduction to intraclass correlation and standard error of measurement. J Sport Rehabil. 1993;2(1):35–42. [Google Scholar]
- 23.Morrow J.R, Fridye T, Monaghen S.D. Generalizability of the AAHPERD Health Related Skinfold Test. Res Q Exercise Sport. 1986;57(3):187–195. [Google Scholar]


