

Abstract
Nitric oxide is emerging as an important modulator of many physiological processes including olfaction, yet the function of this gas in the processing of olfactory information remains poorly understood. In the antennal lobe of the moth, Manduca sexta, nitric oxide is produced in response to odor stimulation, and many interneurons express soluble guanylyl cyclase, a well-characterized nitric oxide target. We used intracellular recording and staining coupled with pharmacological manipulation of nitric oxide and soluble guanylyl cyclase to test the hypothesis that nitric oxide modulates odor responsiveness in olfactory interneurons through soluble guanylyl cyclase-dependent pathways. Nitric oxide synthase inhibition resulted in pronounced effects on the resting level of firing and the responses to odor stimulation in most interneurons. Effects ranged from bursting to strong attenuation of activity and were often accompanied by membrane depolarization coupled with a change in input resistance. Blocking nitric oxide activation of soluble guanylyl cyclase signaling mimicked the effects of nitric oxide synthase inhibitors in a subset of olfactory neurons, while other cells were differentially affected by this treatment. Together, these results suggest that nitric oxide is required for proper olfactory function, and likely acts through soluble guanylyl cyclase-dependent and -independent mechanisms in different subsets of neurons.
Keywords: Olfaction, Nitric oxide, Soluble guanylyl cyclase, Odor coding, Insect
Introduction
Nitric oxide (NO) is now recognized as an important modulator of multiple neuronal processes, including olfaction (reviewed in Breer and Shepherd 1993; Garthwaite and Boulton 1995; Prast and Philippu 2001). Over the past 15 years, nitric oxide synthase (NOS) immunohistochemistry and/or NADPH diaphorase staining of the olfactory pathway has provided indirect anatomical evidence for NO modulation in every animal model examined (Bredt et al. 1991; Elphick et al. 1995; Müller and Hildebrandt 1995; Hopkins et al. 1996; Kendrick et al. 1997; Alonso et al. 1998; Nighorn et al. 1998; Fujie et al. 2002). A well-characterized target of NO, soluble guanylyl cyclase (sGC) has also been localized to neurons within the olfactory pathway (Bicker et al. 1996; Hopkins et al. 1996; Kendrick et al. 1997; Elphick and Jones 1998; Nighorn et al. 1998; Collmann et al. 2004; Fujie et al. 2005), thus providing further evidence for a role for NO in the processing of olfactory information.
Recent evidence in the hawkmoth, Manduca sexta, suggests that NO is produced in the antennal lobe (AL; insect olfactory bulb) in response to odor stimulation (Collmann et al. 2004). The patterns of NO production are spatially focused and depend on the identity and concentration of the odor stimulus. Individual odor patterns elicited with NO-sensitive markers were also similar to those observed with Ca2+ sensitive dyes (Hansson et al. 2003), leading to the hypothesis that odor-dependent local increases in Ca2+ levels could stimulate NOS activation. In M. sexta, NOS is found in the olfactory receptor neurons (ORNs) while sGC has been localized to a variety of secondary neurons including many projection neurons (PNs), some GABAergic neurons [either local interneurons (LNs) or PNs], and the uniquely identified serotonin-immunoreactive neuron (Collmann et al. 2004). Based upon these results, it appears that NO is produced in a given glomerulus whenever the particular set of ORNs innervating that glomerulus is stimulated. NO then likely diffuses throughout the glomerulus where it can interact with both sGC and non-sGC-containing neuronal targets.
Currently, few studies have directly examined the physiological mechanisms underlying the function of NO signaling in the olfactory system. The most extensive work has been in the mollusk, where NO is required for maintenance of oscillations in the procerebral lobe (Gelperin 1994, 2000; Inoue et al. 2000), the secondary olfactory center in terrestrial mollusks. The function of NO has not yet been examined in the tenticular organ, the region of the brain where at least 10% of the primary receptor neurons synapse in glomerular structures (Chase and Tolloczko 1986). A number of behavioral studies also support a role for NO in olfactory discrimination in mammals (Kendrick et al. 1997; Samama and Boehm 1999), insects (Müller 1996; Hosler et al. 2000), and mollusks (Teyke and Gelperin 1999; Sakura et al. 2004).
The primary aim of this study was to examine the possible influences of NO on both the intrinsic membrane and synaptic properties of individual olfactory neurons in the M. sexta AL. The effects of two NOS antagonists were examined through the combined use of in vivo superfusion and intracellular single-unit recording techniques. In some preparations, the effects of blocking NO synthesis were examined on the odor-driven responses of olfactory LNs and PNs. In other experiments, the NO binding site on sGC was blocked in order to test whether NO effects were likely to be mediated by sGC. These effects were compared to NOS inhibition across preparations (or in some cases, in the same preparation). Double-labeling experiments combining intracellular staining with sGC-immunoreactivity (sGCir) were also used to correlate the observed physiological effects with the presence or absence of sGC in the same neuron. The results from this study illuminate NO's role as an important modulator of both basal and synaptically driven activity in the olfactory system.
Materials and methods
Preparation
Manduca sexta (L.) (Lepidoptera: Sphinigdae) were reared on artificial diet in the laboratory from eggs. Two to four day-old males were dissected and prepared for intracellular recordings by established procedures (Christensen and Hildebrand 1987). Following dissection, the AL was desheathed with fine forceps, and physiological saline (containing in mM: 150 NaCl, 3 CaCl2, 3 KCl, 10 N-tris [hydroxymethyl] methyl-2-aminoethanesulfonic acid buffer, and 25 sucrose, pH 6.9; Christensen et al. 1993) was superfused across the brain continuously (~1 ml/min).
Stimulation and recording
Briefly, once the neuron was impaled and its firing activity stabilized, resting spike activity was recorded for 10 s in order to calculate the cell's average basal firing rate. Its responses to different stimulus types (electrical antennal nerve and odor stimulation) were then measured (see below). Next, hyperpolarizing and depolarizing current pulses were injected into most neurons, and the voltage change was measured in order to calculate input resistance and membrane conductance. The resting membrane potential (RMP) and the action potential amplitude of the neuron were also monitored throughout the recording. These manipulations were repeated during the pharmacological treatments (see below), and once again after the treatments were reversed by washing with fresh physiological saline solution.
Olfactory stimulation
The method of stimulus delivery has been described in detail (Christensen and Hildebrand 1987), with some minor modifications. A constant air stream flowed over the antenna and was positioned 2 cm away from the antenna on the ipsilateral side of the AL being examined. Odor stimuli occurred when a solenoid controlled by computer (Tucker Davis, RP2 stimulator, Osceola, FL, USA) allowed another air stream to flow into an odor-containing syringe, with the tip of the syringe positioned within the constant air stream. Each syringe contained an odorant on a piece of filter paper. Most odor stimuli consisted of two pulses (200 ms each), with a 5 s interval between pulses.
The olfactory stimuli tested in the study include: (1) B: bombykal (E, Z-10,12-hexadecadienal, the primary 16-carbon aldehyde component of the female's sex pheromone; (2) C: C15 (E, Z-11,13-pentadecadienal, a 15-carbon aldehyde mimic of the second essential component of the sex pheromone); (3) Bl: pheromone blend (1:1 mixture of C-15 and bombykal) (4) V: pheromone vehicle (cyclohexane; Sigma), (5) H: hibiscus oil blend (Select Oils, Tulsa, OK, USA); (6) M: Methyl salicylate (Sigma); (7) L: Linalool (Sigma); (8) Y: Cyclohexanone (Sigma); and (9) O: control air (blank). Pheromonal components, dissolved in cyclohexane, were diluted to 10 or 20 ng/μl; all other odorants, dissolved in mineral oil, were diluted to 10 μg/μl, except hibiscus oil which was not diluted (used as a positive control for odor responses among plant-volatile receptive neurons). Both vehicles (cyclohexane and mineral oil) as well as an empty syringe were tested as negative controls, although some plant volatile-responsive neurons were also responsive to V. Multiple (2-6) odors were presented to each animal, but not all odors elicited a response by the neuron (see Tables 1, 2). Odors that did elicit a response were tested throughout the recording protocol.
Table 1.
The effects of blocking NO synthesis in antennal lobe neurons
| Neuron ID | Morphology | Physiology | Drug | Resting activity | Δg | Odor response | sGCir |
|---|---|---|---|---|---|---|---|
| PN1 | MC-PN | 7NI | Bursts | ↓ | ↓ Bl, B, C | Yes | |
| PN2 | MC-PN | 7NI | Bursts | ↑ | X: V | No | |
| PN3 | MC-PN | 7NI | Bursts | ↓ | No | ||
| PN4 | MGC-PN | 7NIa | Bursts | ↓ | ↓ Bl, C, B | No | |
| PN5 | AC-PN | 7NIa | Bursts | ↓ | Yes | ||
| PN6 | AC-PN | 7NI | Bursts | ↔ | X: Bl, B, C | No | |
| PN7 | PN | 7NI | Bursts | ↓ | X: H | ||
| PN8 | PN | 7NI | Bursts | ↓ | ^ Bl | ||
| PN9 | MGC-PN | 7NI | Bursts | ↓ | X: Bl, C | ||
| PN10 | AC-PN | LNAME | Bursts | ↓ | |||
| PN11 | AC-PN | L-NAME | Increase | ↓ | ^ H; ↓ Bl, M, L | Yes | |
| PN12 | PN | 7NIa | Increase | ||||
| PN13 | PN | 7NI | Increase | ||||
| PN14 | POa-PN | L-NAME | Decrease | ↓ | ↓ Bl, V; ↔: H | Yes | |
| PN15 | PN | 7NI | Decrease | ||||
| LN16 | Ia-LN | 7NI | Bursts | ↑ | No | ||
| LN17 | Ia-LN | 7NI | Bursts | ↔ | ↓ M; ↑ Bl, H; | No | |
| LN18 | Ib-LN | 7NI | Increase | ↔ | X: Bl, C; ↑B | No | |
| LN19 | Ib-LN | 7NI | Increase | ↓ | ↓ Bl, H, L; ↑ M | Yes | |
| LN20 | LN | 7NI | Increase | ↓ | |||
| LN21 | Ib-LN | L-NAME | Decrease | ↓ | ↓ Y | No | |
| LN22 | IIb-LN | L-NAME | Decrease | ↔ | ↑ Bl, H, L, M | No | |
| LN23 | Ib-LN | 7NI | No change | ↔ | ↑ Bl, O | No | |
| TOTALS | 15 | 8 | 7NI:18; L-N:5 | B: 12; I: 6; D: 4; N:1 | 20 | X: 6; ↓: 7; ↑: 4; ^: 2 | 5/15 ir |
Morphological types of neurons were determined by Lucifer yellow dye Wlling, and classiWed according to: (1) cell body location (MC medial cell body cluster; AC anterior cell body cluster; POa PNs in the lateral cell body cluster (LC) with projections leaving the AL via the outer cerebral tract, as deWned by Homberg et al. 1988); or (2) ramiWcations (PNs MGC macroglomerular complex; all the MGC neurons had cell bodies in the MC; LNs were categorized according to Matsumoto and Hildebrand (1981): (1) Ia-LNs have a major branch leading to arborizations only to a subset of the regular, plant-speciWc glomeruli; (2) Ib-LNs have equal arborizations to most regular glomeruli; (3) IIb-LNs have equal arborizations to most regular glomeruli and the MGC). Neurons were also characterized physiologically by electrically shocking the antennal nerve (Christensen et al. 1993). PN9 was categorized as MGC because of its response to pheromone. PN10 was categorized as an AC PN due to large spike amplitude and spontaneous burst-like behavior. Resting activity, change in conductance (Δg), and odor responses are characterized based on a >20% change from baseline, including decreases (↓), increases (↑), and no change from baseline (N, ↔ or < 20% change from baseline) when drug was applied. X indicates the response to odor was abolished during drug application. ^Indicates a loss of an inhibitory response to odor in which the odor stimulation normally caused a prolonged inhibition, but no increase in spike rate. Individual odors [B bombykal; C C15; Bl: pheromone blend (1:1 mixture of B and C); V cyclohexane (vehicle); H hibiscus oil; M methyl salicylate; L linalool; Y cyclohexanone; O control air (blank)] often caused multiple response types within the same neuron
Indicates that ODQ was also applied (see Table 2)
Table 2.
The effects of blocking sGC signaling in antennal lobe neurons
| Neuron ID | Morphology | Physiology | Drug | Resting activity | Δg | Odor response | sGCir |
|---|---|---|---|---|---|---|---|
| PN24 | MGC-PN | ODQ | Bursts | ↓ | ↓ C ; ↑ Bl | No | |
| PN25 | AC-PN | ODQ | Bursts | ↓ | X: H; ↓ M; ↑ Bl; | Yes | |
| PN5 | AC-PN | ODQa | Bursts | Yes | |||
| PN26 | AC-PN | ODQ | Increase | ↓ | X: M; ↓ Bl; ↑ L | No | |
| PN12 | PN | ODQa | Increase | ↔ | |||
| PN27 | MGC-PN | ODQ | Decrease | ↓ | X: C; ↓ Bl, B | Yes | |
| PN4 | MGC-PN | ODQa,b | Decrease | ↓ | ↓ Bl, C; ↑ B | No | |
| LN28 | Ib-LN | ODQ | Burst | ↔ | ↓ Bl, M; ↑ O | Yes | |
| LN29 | Ib-LN | ODQ | Increase | ↓ | No | ||
| LN30 | LC CB | LN | ODQ | Increase | ↔ | X: H | Yes |
| LN31 | Ib-LN | ODQ | Decrease | ↓ | Yes | ||
| LN32 | Ib-LN | ODQ | No change | ↔ | ↑ Bl | No | |
| LN33 | Ia-LN | ODQ | No change | ↔ | No | ||
| LN34 | Ib-LN | ODQ | No change | Yes | |||
| TOTALS | 13 | 2 | 14 | B: 4; I: 4; D: 3; N: 3 | 12 | X: 4; ↓: 6; ↑: 6 | 7/13 ir |
Morphological and physiological categorization and all other abbreviations are defined in the Table 1 legend. LN30 was filled with LY dye and had a cell body in the LC. It was also characterized physiologically as a LN
Indicates 7NI was also applied (see Table 1)
Note the difference in resting activity observed in PN4 when 7NI was applied
Pharmacology
The NOS inhibitor, N-Nitro-L-arginine methyl ester (L-NAME; Sigma) was dissolved in 0.5% dimethyl sulfoxide (DMSO) and physiological saline, raised to pH 6.9, and bath applied at the minimal effective dose as determined by preliminary extracellular recording experiments (15 mM; reported in Wilson et al. 2003; Wilson 2005). Similar concentrations of L-NAME were also previously used in molluscan preparations (Gelperin 1994). The NOS inhibitor 7-Nitroindazole (7NI; Sigma) and the sGC blocker, 1H-[1,2,4]Oxadiazolo[4,3-a]quinoxalin-1-one (ODQ; Sigma), were also dissolved in DMSO and physiological saline at a concentration of 500 μM. Bath application of DMSO did not cause changes in activity in any AL neurons tested during preliminary extracellular recording experiments (Wilson 2005), so the reported effects are likely drug-specific. All drugs were bath-applied to the entire brain at 1 ml/min.
Intracellular recordings
Sharp glass borosilicate capillary electrodes (1 mm outer diameter, 0.75 or 0.58 mm inner diameter; Sutter Instruments, Novato, CA, USA) were made on a laser puller (P-2000; Sutter Instruments). For a majority of the recordings, the tip of the microelectrode was filled with a 3% solution of Lucifer yellow (LY; Sigma) dye in 0.2 M LiCl and the shaft was filled with 2 M LiCl (some electrodes were filled with 2 M KCl; electrode resistances ranged from 50-500 MΩ). The electrode was then placed into the AL, and recordings were obtained from coarse neurites in which synaptic potentials were readily detectable and responded to injected current (described in Christensen et al. 1998a). All recordings were amplified (10× with Dagan Instruments IX2-700, Minneapolis, Minnesota), monitored on an oscilloscope, digitized at 20 kHz (using Digidata 1200 series Interface, Axon Instruments, Foster City, CA, USA) and collected on Axoscope software (Axon Instruments). The data were analyzed with custom-made programs written in MatLab (The Mathworks, Natick, MA; Carolina Reisenman, Hong Lei, Jinhui Zhang, programmers, University of Arizona). Neuron activity was only analyzed if the recording could be held long enough to apply a saline wash for >4 min (many other neurons showed similar effects but could not be held long enough to wash out the drug). Neurons were identified as PNs or LNs based on previously characterized physiological responses to antennal nerve shock (Christensen and Hildebrand 1987; Christensen et al. 1993, 1998a) or morphologically from LY dye fills (below).
Morphology and immunocytochemistry
Following saline wash, neurons were injected with LY by passing hyperpolarizing current (0.2-1 nA) for 3-10 min. The duration of intracellular recordings was variable, but were, at a minimum 15 min (to allow for the drug application and wash), and at a maximum 90 min (when two drugs were applied and washed). After the experiments were completed, the brain was excised and immersed in 2.5% formaldehyde fixative solution, pH 7.2, for at least 3 h, dehydrated through a graded series of ethanol solutions, and cleared with methyl salicylate (Sigma-Aldrich). Cleared brains were imaged as whole mounts (optical sections, 2-3 μM thick) with a laser-scanning confocal microscope (either a Nikon PCM 2000, equipped with a 457 nm argon laser or a Zeiss 510 Meta LSCM with argon laser, 458 line, LY filters) and operated by either Simple PCI software (C-Imaging Systems, Cranberry Township, PA, USA) or Zeiss 510 Meta, version 3.2 software (Germany). Images were processed and false-colored with Simple PCI software or Corel Photopaint. Once the morphology of the neuron was characterized, the brain was rehydrated through a graded ethanol series, washed with PBS, embedded in agarose, and sectioned with a vibrating microtome (100 μM thick sections). Sectioned tissue was blocked with 5% normal donkey serum in 0.5% TritonX-100 in PBS for one hour at room temperature. The Anti-M. sexta sGC α subunit 1 (MsGCα1) custom polyclonal antiserum (Bethyl Laboratories Inc., Montgomery, TX, USA) against the peptide CIREALKDYGIGQANSTDVDT was applied to the sections overnight at room temperature (1:2,500). The following day, the sections were washed and donkey anti-goat Cy3 secondary antibody (Jackson ImmunoResearch, West Grove, PA, USA) was applied at 1:250 in blocking solution either overnight at 4°C or 4 h at room temperature. Sections were mounted in 60% glycerol in PBS and imaged on the laser-scanning confocal microscope, and false-colored with Simple PCI software. Each neuron was then examined for sGCir by merging images of single optical sections (3 μM) of the cell body region captured during LY excitation (~457λ) and Cy3 excitation (~545λ). If the LY-dyed cell body was present during Cy3 excitation, the neuron was considered to be double-labeled, and thus highly sGCir. All double labels were identified by the first author and confirmed blindly by the confocal technician, Patricia Jansma (University of Arizona).
Data analysis
Resting activity was calculated by measuring the mean firing rate/s for 10 s of spontaneous, non-evoked activity. If spontaneous activity was not recorded, the resting activity was calculated during a blank odor control which did not elicit a change in response. Bursting activity was calculated by measuring interspike intervals: if a neuron fired >2 times with an interspike interval of < 50 ms, the activity was considered a burst. The burst rate, period between bursts, spikes/burst, and burst duration were calculated over the 10 s resting activity period. If burst/s increased >20% (see below) during drug application, the neuron was categorized as “bursting”. Significance was only tested in neuronal populations greater than n = 4. In populations <4, or when activity was examined in the same neuron over time, the mean change during the drug application was scored based on a 20% difference from baseline (scores increased and decreased if >20%, or no change if <20%). The 20% criterion was selected because the fluctuation of resting activity and conductance was less than 10% in control experiments where only saline was applied (resting activity change = 2.7 ± 5.9%; bursting activity change = 0.5 ± 2%; conductance change = 4.1 ± 3.5%; n = 6). Thus any change over 20% should capture only drug effects and not the natural variability of individual neuron activity.
For odor responses, the net number of spikes during the response was calculated by totaling the number of spikes during 1 s after the stimulus onset, then subtracting the number of spikes 1 s before the stimulus onset. All preparations tested with odor stimulations had at least one modified odor response when drugs were applied. Modified responses were categorized as follows: (a) abolished if there was a disappearance in excitation (no net increase in spikes; X) or a disappearance of inhibition (a hyperpolarization response replaced with a depolarization or spike production; ^); (b) a decrease in excitation (<20% number of spikes elicited from baseline response; ↓); and (c) an increase in excitation (a >20% increase in number of spikes elicited from baseline response; ↑).
Results
Effects of blocking NO synthesis
Resting activity changes in olfactory interneurons after NOS inhibition
The necessity of NO for olfactory interneuron function was tested by blocking NO synthesis with the application of two well-characterized (Moore and Handy 1997) NO synthesis inhibitors, 7NI and L-NAME (see also Wilson et al. 2003; Wilson 2005). Both 7NI and L-NAME resulted in similar changes in the resting level of firing in both PNs and LNs (Table 1) as detected through intracellular, in vivo recordings.
PNs showed dramatic changes when NO synthesis was inhibited, and the observed changes in background firing could be differentiated into three distinct types: (1) induced bursts of firing (Fig. 1a), (2) tonic increases in firing rate (Fig. 1b), or (3) decreases in firing rate (Fig. 1c; these effects were defined by a greater than 20% change from baseline activity; see Materials and methods). The PN bursts were regular and rhythmic, although the periodicity of the bursts varied across PNs (mean change from baseline: (1) burst rate 1.4 ± 0.9 bursts/s, +560%; (2) period -620 ± 26 ms, -67%; (3) spikes/burst 13.5±15, +190%; and (4) burst duration -13 ± 9 ms, -5%). In several PNs, the bursts were accompanied by a depolarization in the RMP (Fig. 1b; PN1, PN9, PN12, PN15; mean change 19.0 ± 3.0 mV, +31%) and a decrease in the action potential amplitude (Fig. 1a; PN1, PN5, PN9, PN15; mean change -6.9 ± 5.0 mV, -20%). Bursting PNs also exhibited an overall increase in firing rate (Fig. 1d; mean change 3.7 ± 2.5 spikes/s). Three PNs displayed an increase in firing rate without the presence of bursts when NO production was blocked (Fig. 1b, d; mean change 4.2 ± 1.1 spikes/s) and the final two PNs responded with a net decrease in activity (Fig. 1c, d; mean change -2.5 ± 0.92 spikes/s). The mean activity returned to baseline or near baseline levels after the NOS inhibitors were washed from the preparation (Fig. 1d).
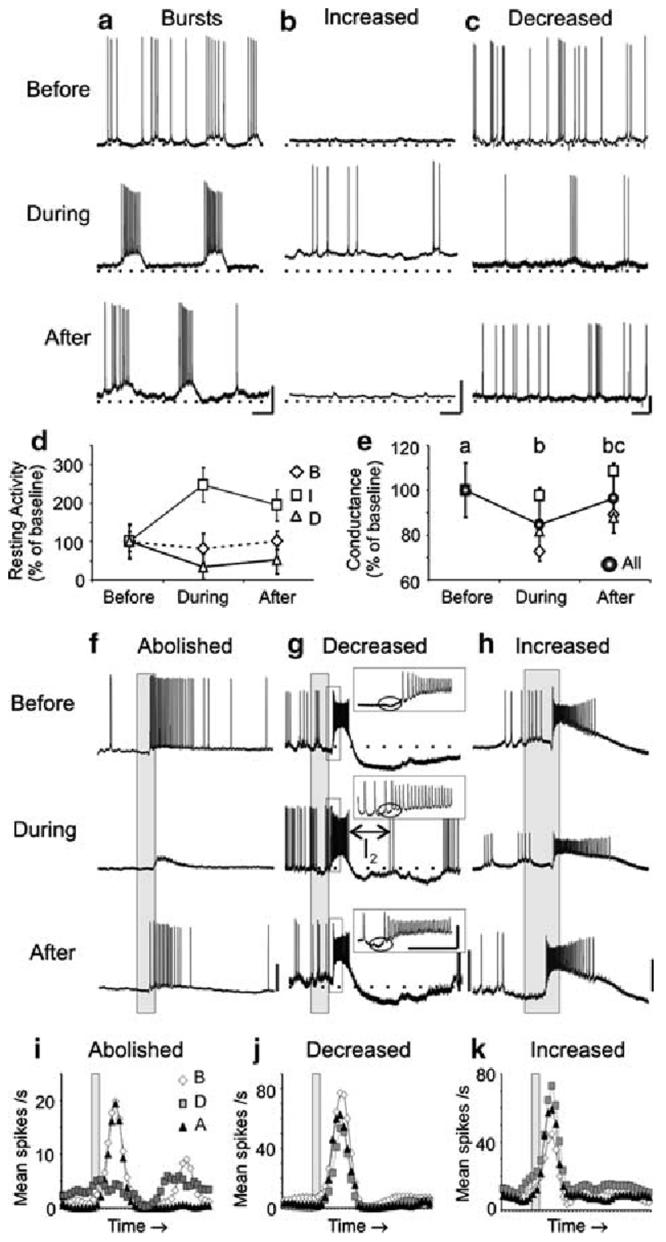
Fig. 1.

Inhibition of NO synthesis modified the resting and odor-evoked activity of PNs.a-c, Representative traces are shown for three PNs before, during, and after treatment with either 500 μM 7NI or 15 mM L-NAME (see Table 1 for specific drug used). NOS inhibition resulted in: rhythmic bursting (a n = 10; PN5 shown), increased firing rates (b n = 3; PN12), and decreased firing rates (c n = 2; PN15) in different subsets of PNs. A rise in the resting membrane potential (RMP; dotted line, b, c n = 4) and a reduction in action potential amplitude (a n = 4) were also observed in some PNs. d The average resting firing activity was plotted as a percentage of baseline levels (± SEM) for each PN subset. e-f PN odor responses, measured by net number of spikes, (see Materials and methods) were also significantly abolished (e, g PN6; n = 6; repeated measures ANOVA df = 2; F = 15.6; P < 0.001; Tukey's post-hoc test: P < 0.05) or decreased (f, h PN1; n = 4; dF = 2; F = 6.86; P < 0.05; Tukey's post-hoc test P < 0.05) after NO synthesis inhibition. f The inhibitory potential (I1 circle) that precedes the bout of action potentials in the PN odor response was also missing in this PN. Calibration a-c 20 mV and 250 ms; e-h 20 mV and 200 ms (gray bar)
The effects of NOS inhibition were also examined in LNs (Fig. 2). As observed in PNs, the responses could be differentiated into: induced bursts (Fig. 2a, d; mean change 16 ± 5.9 spikes/s), tonic increases in activity (Fig. 2b, d; mean change 6.9 ± 6.5 spikes/s), and decreases in activity (Fig. 2c, d; mean change -9.1 ± 6.9 spikes/s). One LN failed to meet the criterion for a response to 7NI treatment because it showed only a 12% decrease in resting activity after 7NI application (LN23; Table 1). The LN bursts (Fig. 2a), unlike the PN bursts (Fig. 1a), were composed of variable clusters of spikes that occurred at infrequent, irregular intervals. In addition, both bursting LNs also displayed a depolarized RMP (mean change 6.6 ± 9.7 mV, +20%) and the bursting LN in Fig. 2a also showed irregular action potential amplitudes (mean change -25 mV, -51%).
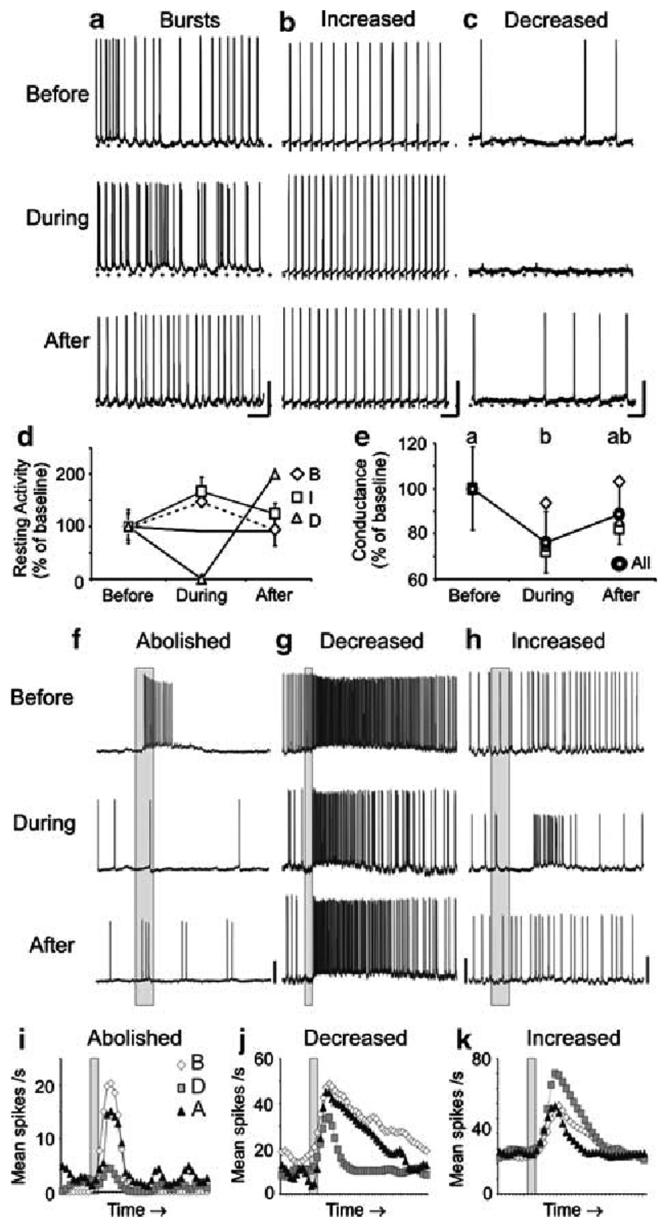
Fig. 2.

Inhibition of NO synthesis also modified the resting and odor-evoked activity of LNs. a-c Representative traces are shown for three LNs before, during, and after treatment with either 500 μM 7NI or 15 mM L-NAME (Table 1). Similarly to PNs, NOS inhibition in LNs resulted in: bursting (a n = 2; LN16; LN bursts were arrhythmic; compare to Fig. 1a), increased firing rates (b n = 3; LN19), and decreased firing rates (c n = 2; LN21) in different subsets of LNs. One LN had no change in activity when NO synthesis was blocked (Table 1). Changes in the RMP and action potential amplitude were also observed in bursting LNs (a n = 2). d The average resting firing activity was plotted as a percentage of baseline levels (± SEM) for each LN subset. e-g LN odor responses, like PN odor responses, were also abolished (e, h; LN22; n = 2; significance not measured, n < 4) and decreased (f, i; LN 21; n = 3), but also increased (g, j; LN23; n = 4; repeated measures ANOVA df = 2; F = 164; P < 0.0001; Tukey's post-hoc test: P < 0.001) after NO synthesis inhibition. Calibration a-c 20 mV and 250 ms; e-j 20 mV and 200 ms (gray bar)
Odor-evoked activity changes in olfactory interneurons after NOS inhibition
In order to test whether decreasing levels of NO would have an effect on the synapse-dependent, odor-evoked activity of olfactory neurons, the responses of PNs (Fig. 1e-h) and LNs (Fig. 2e-j) to individual odors or odor blends were monitored during NO synthesis inhibition. Three major changes in the odor responses were observed: (1) complete abolishment of the response (Figs. 1e, g; 2e, h), (2) decrease in mean number of spikes (Fig. 1f, h; 2f, i), and (3) increase in mean number of spikes (Fig. 2g, j). Abolished odor responses during NO inhibition were characterized by a complete lack of spike activity (PNs n = 6, Fig. 1e, g; LNs n = 2, Fig. 2e, h) or the loss of an inhibitory potential (n = 2 PNs; Table 1) when the odor was applied. Often, the neuron could still produce spikes (Fig. 1e), but failed to show an increase in spike rate. In other cases, small excitatory potentials could be observed (Fig. 2e), but the threshold necessary for spiking was not reached. Further, Wve of the six PNs that lost their ability to respond to odor also exhibited bursting activity at rest (Table 1). This result indicates that the olfactory processing capabilities of most bursting PNs tested with odor (n = 5/7) were effectively disabled under conditions of reduced NO levels.
Several AL neurons, including both PNs (n = 4; Fig. 1f, h) and LNs (n = 3; Fig. 2f, i) were found to decrease their response to odor during NOS inhibition (a decline in the mean number of spikes elicited by odor). Other changes were also sometimes evident in these neurons. In one PN for example (Fig. 1f), the inhibitory potential (I1) which often precedes the excitatory phase of spikes in a PN odor response (Christensen and Hildebrand 1987), was abolished when NO was blocked. Finally, four LNs showed increased odor responses during NOS inhibition (Fig. 2g, f). This response type was not observed in PNs.
Notably, the type of resting activity change did not predict any change in odor response (Table 1), except that the odor responses were always modified when there was a change in the resting activity. Responses to both pheromone and plant volatile odors were also modified (Table 1), which shows that NO is likely required for the proper processing of pheromone components and general environmental odorants.
Inhibiting NO synthesis led to changes in cell input resistance
The results presented thus far suggest that both PNs and LNs require minimal levels of NO to maintain basal and synaptically-driven activity. In order to test whether NO is involved in maintaining membrane properties in individual neurons and to better understand the mechanisms behind the diverse changes seen in the resting activity when NO synthesis was blocked, the resting input resistance was calculated by injecting known current steps into AL neurons and measuring the resulting voltage changes (Fig. 3). NOS inhibition resulted in dramatic differences in the amounts of voltage change seen after injection of both depolarizing and hyperpolarizing current steps into individual neurons. The voltage deflections also exhibited non-linearities (Fig. 3a), suggesting the presence of slowly inactivated voltage-gated channels that are typically masked during basal conditions. The mean membrane conductance across all PNs (Fig. 3c) and all LNs (Fig. 3d) decreased significantly when NO production was blocked (mean change PNs -0.72 ± 0.27 nS; LNs: -0.44 ± 0.43 nS). While most neurons in all activity classes showed an overall decrease in membrane conductance, the bursting LNs showed an average increase in membrane conductance when NO was blocked (Fig. 3d; mean change 0.68 ± 0.22 nS). These results suggest that blocking NO synthesis results in modifications in cell-specific membrane permeability, and that the presence of NO is required for the maintenance of baseline membrane channel activity. It further suggests that different subpopulations of LNs can respond differently to NO. Immunohistochemistry lends support to the idea of heterogeneity within the LN population. In some cases, filled LNs (n = 14) were stained to determine if they expressed high levels of sGC. One specific recognizable morphological type of LN, Type Ib, consistently contained sGCir (Fig. 7a-d), while both Type Ia (Fig. 7e-h), and Type IIb (Table 1) did not.
Fig. 3.
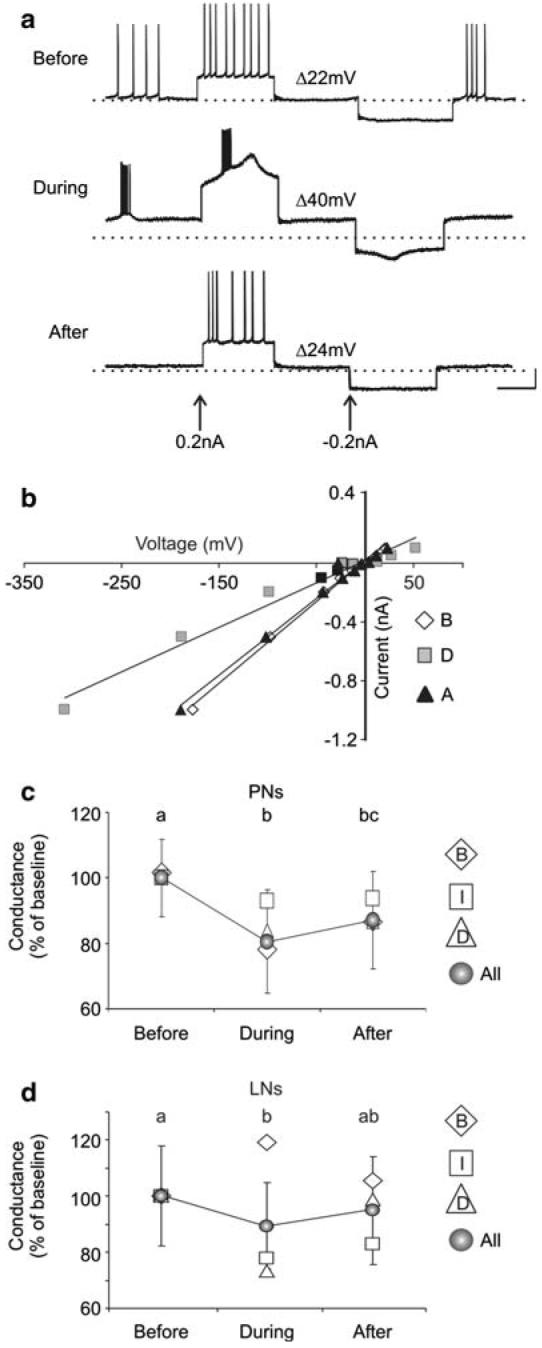
NO inhibition modified resting input resistance in both PNs and LNs. a Current injections during NO inhibition revealed dramatic voltage changes (†V; +45%) in this representative PN (PN1). b The input conductance for PN1, calculated from the slope of the regression line when the peak voltage was plotted against multiple current steps, dropped by 54% (from 5.4 to 3.6 nS) when NO synthesis was inhibited. c The average input conductance for all PNs (all) and by activity class (B bursting; I increased; D decreased) was plotted as a percentage of baseline levels (SEM is only shown for average of all PNs). The average conductance decreased significantly during NOS inhibition (means coded by different lowercase letters differed significantly; n = 12; repeated measures ANOVA df = 2; F = 26.7; P < 0.001; Tukey's post-hoc test: P < 0.001). d The mean conductance decreased significantly for all LNs (n = 8; repeated measures ANOVA df = 2; F = 3.4; P < 0.05; Tukey's post-hoc test: P < 0.01), however the bursting LNs (n = 2) showed an average increase in conductance (+16%). Calibration 20 mV, 500 ms
Fig. 7.

Immunohistochemistry revealed many olfactory neurons do not contain high levels of sGC-immunoreactivity. A subset of neurons in this study (Tables 1, 2) was labeled with lucifer yellow (LY) dye and subsequently tested for sGC-immunoreactivity (sGCir). a A whole-mount view of a LY filled Type Ib LN (LN28, see Fig. 5a) with a cell body in the lateral cell body cluster (dashed oval c) and no ramifications in the MGC (dashed oval in a). b The AL was frontally sectioned (100 μM sections) and c, labeled with the MsGCα1/Cy3 antibody (images show single optical sections 3 μM). A magnified view of the cell body is shown in the inset. d LN28 contained strong levels of sGCir. e-h, Another LN, Type Ia (LN17), was found to contain little or no sGCir. i-l sGC-immunohistochemistry in PN4 (Fig. 6d, e) revealed that while neighboring PNs appeared to contain strong labeling, this PN and its projection (arrow) did not contain high levels of sGCir. Calibration 100 μM; inset is 20 μM. Orientation D: dorsal; L: lateral
Effects of sGC inhibition
The results from the previous section suggest that both PNs and LNs require NO to maintain resting and synaptically-driven, odor-evoked activity. We therefore wanted to know whether the mechanisms of NO action are dependent on sGC signaling in AL interneurons, and if so, which interneurons: PNs, LNs, or a subset of each? To begin answering these questions, we tested for putative NO-sGC interactions by applying a well-known sGC inhibitor, ODQ, which blocks the heme binding site of NO on sGC (Garthwaite et al. 1995). ODQ was applied while recording the resting and odor-evoked activity from both PNs (Fig. 4; Table 2) and LNs (Fig. 5; Table 2).
Fig. 4.
Inhibitors of sGC signaling caused similar modifications as NO synthesis inhibitors in the resting and odor-evoked activity in a subset of PNs. a-c Representative traces are shown for three PNs before, during, and after treatment with 500 μM ODQ. As found with NOS inhibition, sGC inhibition resulted in: rhythmic bursting (a n = 3; PN5 shown, compare to Fig. 1a), increased firing rates (b n = 2; PN12, compare to Fig. 1b), and decreased firing rates (c n = 2; PN27), coupled with changes in the RMP and action potential amplitude in a subset of PNs (a n = 2). d The average resting activity plot revealed the bursting PN firing rate decreased during sGC inhibition, which deviates from the increased firing rate observed in the PNs during NOS inhibition (Fig. 1d). e The average conductance of all PNs decreased significantly during sGC inhibition (n = 6; repeated measures ANOVA df = 2; F = 9.41; P < 0.001; Tukey's post-hoc test: P <0.01). f-k PN odor responses during sGC inhibition were also abolished (f, i; PN 26; n = 3; significance not measured, n < 4), decreased (g, j; PN27; n = 4; df = 2; F = 48.4; P < 0.0001; Tukey's post-hoc test: P < 0.001), and, unlike during NOS inhibition, increased (h, k PN24; n = 4; dF = 2; F = 36.5; P < 0.0001; Tukey's post-hoc test: P < 0.01). g The I1 (inset, circle) and the I2 (see Results) were also modified in this PN during sGC inhibition. Calibration a-c 20 mV and 250 ms; f-k 20 mV and 200 ms (gray bar)
Fig. 5.
Inhibitors of sGC signaling caused similar modifications in the resting and odor-evoked activity as NO synthesis inhibitors in a subset of LNs. a-c Representative traces are shown for three LNs before, during, and after treatment with 500 μM ODQ. As found with NOS inhibition, sGC inhibition resulted in: arrhythmic bursting (a n = 1; LN28 shown), increased firing rates (b n = 2; LN29), and decreased firing rates (c n = 1; LN31), coupled with changes in the RMP and action potential amplitude in the bursting LN (a). e The average conductance of all LNs decreased significantly during sGC inhibition (n = 4; repeated measures ANOVA df = 2; F = 16.5; P < 0.001; Tukey's post-hoc test: P < 0.001). f-k LN odor responses during sGC inhibition were also abolished (f, i LN30; n = 1; significance not measured, n < 4), decreased (g, j; LN28; n = 1), and increased (h, k; LN32; n = 2). Calibration a-c 20 mV and 250 ms; f-k 20 mV and 200 ms (gray bar)
The effects of blocking NO activation of sGC were similar to NO synthesis inhibition in a subset of olfactory interneurons
As observed during NOS inhibition (Figs. 1, 2), the effects on basal firing rates in a subset of PNs and LNs could be clearly differentiated into three distinct types when NO activation of sGC was blocked: (1) induced bursts of firing (PNs Fig. 4a, d; mean change -5.0 ± 3.7 spikes/s; LNs Fig. 5a, d; mean change 5.5 spikes/s), (2) tonic increases in firing rate (PNs Fig. 4b, d; mean change 6.8 ± 7.2 spikes/s; LNs Fig. 5b, d; mean change 2.9 ± 2.1 spikes/s), or (3) decreases in firing rate (PNs Fig.4c, d; mean change -5.7 ± 0.71 spikes/s; LNs Fig. 5c, d; mean change -0.6 spikes/s). Notably, in two neurons (PN 5, PN12), sequential application of NOS and sGC inhibitors revealed similar modifications in the resting activity (compare Figs. 1a-4a; Fig. 1b-4b), which strongly suggests that NO activation of sGC mediated the observed effects. Decreases in the action potential amplitude and increases in resting membrane conductance were also observed in two PNs during sGC inhibition (Fig. 4).
There were some subtle differences in the effects of sGC inhibition and NOS inhibition. While the burst duration (+30 ± 39 ms, +49%) and spikes/burst (2.3 ± 2.1, +74%) were similar during both NOS and sGC inhibition, the burst rate (-0.53 ± 0.9 bursts/s, -30%) and periodicity (+480 ± 310ms, +92%) were different. These differential effects were observed in PN5 when 7NI (Fig. 1a) and ODQ (Fig. 4a) were applied sequentially (the mean inter-burst interval is 350 ± 10 ms in Fig. 1a, 600 ± 30 ms in Fig. 4a). Also decreased spiking activity was observed in bursting PNs during sGC inhibition (Fig. 4d). Notably, the decrease in activity was only observed in two of the bursting PNs (the other bursting PN showed a 50% increase in activity). The bursting LN exhibited irregular and sporadic bouts of action potentials (mean change from baseline: (1) burst rate 3.9 bursts/s, +350%; (2) period -760 ms, -79%; (3) spikes/burst 4.6, +19%; and (4) burst duration -6.9 ms, -13%) that were not as pronounced as those seen during NOS inhibition (Fig. 2a).
The mean membrane conductance of PNs (Fig. 4e; mean change: -1.1 ± 0.44 nS) and LNs (Fig. 5e; mean change: -0.97 ± 0.42 nS) also significantly decreased during sGC inhibition (see also Table 2). All categories of neurons based on resting activity classifications showed decreases in membrane conductance, including the bursting LNs, which showed an anomalous increase in membrane conductance during NOS inhibition (Fig. 3d).
As found for NOS inhibition (Figs. 1e-h, 2e-j), both PNs and LNs had modified odor responses when sGC was blocked (Figs. 4f-k, 5f-k), and the resting activity changes did not predict any odor response changes (Table 2). All odor response categories were observed: (a) complete abolishment of response (Figs. 4f, i; 5f, i), (b) decrease in mean number of spikes (Figs. 4g, j; 5g, j), and (c) increase in mean number of spikes (Figs. 4h, k; 5h, k). Abolished odor responses during sGC inhibition (PNs n = 3, Fig. 4f, i; LNs n = 1, Fig. 5f, i) appeared similar to NOS inhibition, including the inability to reach spike threshold (Fig. 4a). Decreases in spike rate during the odor response were also similar in PNs (n = 5; Fig. 4g, j) and LNs (n = 1; Fig. 5g, j). As found with NOS inhibition, the early inhibitory phase, I1 of one PN odor response completely disappeared (Fig. 4g, inset). However, unlike NOS inhibition, the duration of the I2, or the after-hyperpolarization phase, was also substantially reduced (Fig. 4g, arrow). Finally, unlike NOS inhibition, both LNs (n = 2; Fig. 5h, k) and PNs (n = 4; Fig. 4h, k) showed increased odor responses during sGC inhibition.
The effects of blocking NO activation of sGC were not the same as NOS inhibition in a subset of olfactory interneurons
While most of the olfactory neurons showed similar responses to NOS and sGC inhibition, there were some notable exceptions. First, three LNs showed no measurable difference from saline control application (see Materials and methods) in both the basal activity levels (Fig. 6a, b: mean change from baseline: -1.2 ± 0.75 spikes/s; 8%) and membrane conductance (Fig. 6c: mean change from baseline: 0.04 ± 0.01 nS; 5%) when sGC was blocked. Next, in PN4, NOS and sGC inhibition caused discernable differnces in the resting (Fig. 6d) and odor-evoked (Fig. 6e) activity. 7NI application caused the neuron to burst at a high rate (mean change from baseline (1) burst rate 1 bursts/s, +20%; (2) period 360 ms, +35%; (3) spikes/burst 1.5, +50%; and (4) burst duration 4.5 ms, +8%); however, the overall firing rate stayed the same as baseline (mean change -0.7 spikes/s; -4%). In contrast, ODQ application caused no measurable bursts and a large decrease in overall firing rate (mean change -6.2 spikes/s; -54%). The resting membrane conductance decreased in both cases when NOS and sGC inhibitors were applied (mean changes, 7NI -0.19 nS, -62%; ODQ -0.11 nS, -30%) however, NOS in the RMP (mean change, 7NI 9 mV; 23%; ODQ 0.1 mV; 1%) and a decrease in the action potential amplitude (mean change, 7NI -9 mV; -37%; ODQ 2 mV; 4%). This cumulus-macroglomerular complex (MGC) PN also exhibited a multi-phasic, burst-like response to pheromone when NO levels were decreased, but not when sGC was inhibited (Fig. 6e). ODQ treatment instead led to an increased delay to response-burst onset (mean change 200 ms; 66%). Immunohistochemistry lends support to the idea that NO may not act through sGC in all PNs. Although about 90% of PNs contain sGCir (Collmann et al. 2004), PN4, which showed disparate effects when NOS and sGC inhibitors were applied (Fig. 6e-f), did not contain detectable sGCir (Fig. 7i-l) when stained after recording. While this result does not rule out the possibility that low levels of sGC protein were present, but not detected with this method, the large differences in the activity suggests that sGC was likely not the primary target of NO in this PN.
Fig. 6.

sGC inhibition caused differential effects in the resting and odor-evoked in a subset of neurons. a-c A subset of LNs (n = 3) showed no change (X) in resting activity (a, b; LN33 shown) and conductance (c) when sGC was inhibited (changes were similar to those observed during control saline application, see Materials and methods). d, e The effects of NOS and sGC inhibition on the resting (d) and odor-evoked (e) activity were directly compared in PN4. d PN4's resting activity became burst-like after NOS inhibition, but no bursting activity was observed after sGC inhibition. e Odor-evoked activity also differed during NOS and sGC inhibition. NOS inhibition caused a decrease in net spikes and the appearance of bursting, intermittent firing, while sGC inhibition caused a more moderate decrease in net spikes and an increased delay to onset. Calibration a, d 20 mV and 250 ms; e 20 mV and 200 ms (gray bar)
Discussion
A role for NO as a tonic neuromodulator
All of the neurons in this study, with the exception of one LN that did not meet the established criterion (Table 1), showed changes in basal activity when NO signaling was inhibited (Figs. 1a-d; 2a-d). The pervasive effects on basal activity strongly suggest that a certain level of NO is present at all times and is therefore in a position to act as a tonic regulator of AL neuron function. Since expression of NOS has only been documented in ORNs (Nighorn et al. 1998; Collmann et al. 2004), this suggests that these neurons have spontaneous activity that results in a tonic level of NO in all olfactory glomeruli. This need not be classic synaptic activity. Since NOS is calcium sensitive, activation of a calcium flux through the actions of another neuromodulator such as serotonin may be sufficient to cause production of NO.
Modification of basal levels of NO consistently caused changes in the membrane conductance. Increasing basal NO levels likely results in an increase in membrane conductance (blocking NO caused decreases in conductance Fig. 3). In these neurons, NO may be “priming” olfactory neurons for odor input by maintaining a set firing threshold (Fig. 2e). One subset of neurons, the bursting LNs, showed the opposite effect (Fig. 3d) suggesting that NO caused a decrease in membrane conductance in these neurons. Even within the class of neurons that showed decreases in membrane resistance however, inhibition of NOS could result in different types of overall activity changes. This heterogeneity in response to NO is likely the result of a combination of differences in the specific molecular phenotype in each neuron and differences in the synaptic circuitry that regulates the amount and type of synaptic input.
A role for NO in shaping the odor response
The presence of NO was required for maintaining odor responsiveness in all neurons tested in this study. The effects on odor responses, including complete abolishment (Figs. 1e, g; 2e, h), reduction (Figs. 1f, 1h; 2f, i), or increases (Fig. 2g, j) in excitation suggest that NO could be important for maintaining both spiking thresholds (Fig. 2e) through membrane channel modification and inter-synaptic signaling events. These inter-synaptic signaling events include the loss of synaptic inhibition provided by presynaptic LNs to PNs (Fig. 1f; Christensen et al. 1993; Lei et al. 2002). Thus, NO is likely to directly affect inter-and intraglomerular LN responses to odor, which then indirectly affects post-synaptic PN responses. Disinhibitory pathways, where LNs likely synapse onto and inhibit other LNs (Waldrop et al. 1987; Christensen et al. 1993, 1998a, 1998b), were also compromised and likely resulted in the appearances of increased responses to odor (Fig. 2g, j) even when an individual LN was not directly affected by a loss of NO signaling (LN23; Table 2). Additionally, cell autonomous effects of NO on the PNs themselves are also likely. Changes in odor response onset were sometimes observed (Fig. 1f); this phenomenon could be a result in a reduction in driving force through LN inhibition (Christensen et al. 1993) or changes in PN membrane properties. Thus the effects of NO on the processing of odor information are likely to be multifaceted resulting in both greater efficacy of the LN network and increased sensitivity of PNs. EVects on emergent properties such as PN synchrony or oscillatory behavior are also possible. Such phenomena have been well described in the mollusk where increased NO in the procerebral lobe is thought to aid in encoding the odor's identity through modifications in the frequency of field potential oscillations (Gelperin 1994). However, in the mollusk, NO (and sGC) are distributed across all procerebral lobe neurons (Fujie et al. 2002, 2005), whereas in M. sexta, NO is restricted only to the ORNs (Nighorn et al. 1998; Collmann et al. 2004). The differences in the functional anatomy might confer differences in the function of NO signaling in the two systems.
Putative molecular targets of NO
Blocking sGC signaling and inhibition of NOS caused similar resting and odor-evoked activity changes in many neurons (Figs. 4, 5). NO binding of sGC causes increased production of cyclic guanosine monophosphate (cGMP) which leads to downstream signaling events that can include direct activation of cyclic nucleotide gated channels and activation of cGMP-dependent protein kinases (PKGs). PKGs can phosphorylate other ion channels or activate phosphatases to modify ion channels (White 1999). One likely target of NO-sGC signaling is potassium (K+) channels. NOS inhibition likely affected the efflux of K+ ions which depolarized cells and could explain (a) the observed rise in RMP, as well as (b) a decrease in spike amplitude due to the lowered driving force on sodium ions (Figs. 1, 2, 4, 5).
There was also evidence for non-sGC mediated effects of NO. Many AL neurons did not contain detectable levels of sGCir (Fig. 7), and one responded differently when NO and sGC were blocked (Fig. 6d, e). These results, although not definitive, demonstrate that NO is likely not the only mediator of NO signaling in the M. sexta olfactory system. One likely possible mechanism is through S-nitrosylation of ion channels (see Ahern et al. 2002 for a review). This could include modification of Na+ channels (Li et al. 1998) and GABA receptors (Castel and Vaudry 2001). Modification of Na+ channels could cause the reversal potential to become more positive than the RMP, thus causing the rise in the RMP (Figs. 1a, 2a) coupled with the increase in input resistance (Figs. 3, 4e, 5e) in many neurons. Also, if S-nitrosylation modifies GABA receptors on PNs and LNs in the AL, inhibitory signaling in the AL could be compromised if NO was blocked. Evidence for such a loss of inhibition was observed in both PNs and LNs when NO was blocked (Figs. 4g, 5h). Finally, as described for a cGMP-dependent pathway, modulation of K+ channels directly by S-nitrosylation would also result in changes in excitability.
In summary, these findings suggest that NO plays a major role in shaping the odor response by modulating both the resting membrane conductance and resting firing activity of AL neurons. Furthermore, many neurons require NO signaling to maintain their responses to odor. While NO likely targets sGC in many neurons to exert these effects, there is evidence that suggests that other mechanisms such as S-nitrosylation of ion channels, or modulation of upstream circuitry, also play a role. The lack of sGCir in many neurons suggests that NO likely affects only a small subset of LNs and most PNs through sGC, while most LNs and a small subset of PNs are affected by NO through other signaling pathways.
Acknowledgments
This work was supported by the National Institutes of Health-National Institute on Deafness and Other Communication Disorders Grants DC04292 to A.N. and DC005652 to T.C., and through a Ruth L. Kirschstein Individual Predoctoral Fellowship DC006368 to C.W. The authors also wish to thank Dr. Hong Lei, Dr. Carolina Reisenman, Dr. Andrew Dacks, and Jinhui Zhang for help with data and statistical analyses, as well as members of the Hildebrand laboratory for helpful discussions. We also appreciate help from Patricia Jansma for assistance with confocal microscopy, and Suzanne Mackzum for rearing M. sexta at the Arizona Research Laboratories, Division of Neurobiology. The experiments comply with the “Principles of animal care”, publication No. 86-23, revised 1985 of the National Institute of Health, and also with the current laws of the United States of America.
Abbreviations
- 7NI
7-Nitroindazole
- AC
Anterior cell body cluster
- AL
Antennal lobe
- cGMP
Cyclic guanosine monophosphate
- LC
Lateral cell body cluster
- L-NAME
N-Nitro-L-arginine methyl ester
- LNs
Local interneurons
- LY
Lucifer yellow
- MC
Medial cell body cluster
- MGC
Macroglomerular complex
- NO
Nitric oxide
- NOS
Nitric oxide synthase
- ODQ
1H-[1,2,4]Oxadiazolo[4,3-a]quinoxalin-1-one
- ORN
Olfactory receptor neuron
- PNs
Projection interneurons
- PIa
Projections via the inner cerebral tract
- POa
Projections via the outer cerebral tract
- RMP
Resting membrane potential
- sGC
Soluble guanylyl cyclase
- sGCir
sGC-immunoreactive
References
- Ahern G, Klyachko V, Jackson M. cGMP and S-nitrosylation: two routes for modulation of neuronal excitability by NO. TINS. 2002;25:510–517. doi: 10.1016/s0166-2236(02)02254-3. doi:10.1016/S0166-2236(02)02254-3. [DOI] [PubMed] [Google Scholar]
- Alonso JR, Porteros A, Crespo C, Arevalo R, Brinon JG, Weruaga E, Aijon J. Chemical anatomy of the macaque monkey olfactory bulb: NADPH-diaphorase/nitric oxide synthase activity. J Comp Neurol. 1998;402:419–434. doi:10.1002/(SICI)1096-9861(19981221)402:3<419::AID-CNE9>3.0.CO;2-C. [PubMed] [Google Scholar]
- Bicker G, Schmachtenberg O, De Vente J. The nitric oxide/cyclic GMP messenger system in olfactory pathways of the locust brain. Eur J Neurosci. 1996;8:2635–2643. doi: 10.1111/j.1460-9568.1996.tb01558.x. doi:10.1111/j.1460-9568.1996.tb01558.x. [DOI] [PubMed] [Google Scholar]
- Bredt DS, Glatt CE, Hwang PM, Fotuhi M, Dawson TM, Snyder SH. Nitric oxide synthase protein and mRNA are discretely localized in neuronal populations of the mammalian CNS together with NADPH diaphorase. Neuron. 1991;7:615–624. doi: 10.1016/0896-6273(91)90374-9. doi:10.1016/0896-6273(91)90374-9. [DOI] [PubMed] [Google Scholar]
- Breer H, Shepherd GM. Implications of the NO/cGMP system for olfaction. Trends Neurosci. 1993;16:5–9. doi: 10.1016/0166-2236(93)90040-s. doi:10.1016/0166-2236(93)90040-S. [DOI] [PubMed] [Google Scholar]
- Castel H, Vaudry H. Nitric oxide directly activates GABA(A) receptor function through a cGMP/protein kinase-independent pathway in frog pituitary melanotrophs. J Neuroendocrinol. 2001;13:695–705. doi: 10.1046/j.1365-2826.2001.00683.x. doi:10.1046/j.1365-2826.2001.00683.x. [DOI] [PubMed] [Google Scholar]
- Chase R, Tolloczko B. Synaptic glomeruli in the olfactory system of a snail, Achatina fulica. Cell Tissue Res. 1986;246:567–573. doi:10.1007/BF00215198. [Google Scholar]
- Christensen T, Hildebrand J. Male-specific, sex pheromone-selective projection neurons in the antennal lobes of the moth Manduca sexta. J Comp Physiol A. 1987;160:553–569. doi: 10.1007/BF00611929. doi:10.1007/BF00611929. [DOI] [PubMed] [Google Scholar]
- Christensen TA, Waldrop B, Harrow I, Hildebrand JG. Local interneurons and information processing in the olfactory glomeruli of the moth Manduca sexta. J Comp Physiol. 1993;173:385–399. doi: 10.1007/BF00193512. doi:10.1007/BF00193512. [DOI] [PubMed] [Google Scholar]
- Christensen TA, Waldrop BR, Hildebrand J. GABAergic mechanisms that shape the temporal response to odors in moth olfactory projection neurons. In: Murphy C, editor. Olfaction and taste. Ann N Y Acad Sci; NY: 1998a. pp. 475–481. [DOI] [PubMed] [Google Scholar]
- Christensen TA, Waldrop BR, Hildebrand JG. Multitasking in the olfactory system: context-dependent responses to odors reveal dual GABA-regulated coding mechanisms in single olfactory projection neurons. J Neurosci. 1998b;18:5999–6008. doi: 10.1523/JNEUROSCI.18-15-05999.1998. [DOI] [PMC free article] [PubMed] [Google Scholar]
- Collmann C, Carlsson MA, Hansson BS, Nighorn A. Odorant-evoked nitric oxide signals in the antennal lobe of Manduca sexta. J Neurosci. 2004;24:6070–6077. doi: 10.1523/JNEUROSCI.0710-04.2004. doi:10.1523/JNEUROSCI.0710-04.2004. [DOI] [PMC free article] [PubMed] [Google Scholar]
- Elphick MR, Jones IW. Localization of soluble guanylyl cyclase alpha-subunit in identified insect neurons. Brain Res. 1998;800:174–179. doi: 10.1016/s0006-8993(98)00522-8. doi:10.1016/S0006-8993(98)00522-8. [DOI] [PubMed] [Google Scholar]
- Elphick M, Rayne R, Riveros-Moreno VV, Moncada S, Shea M. Nitric oxide synthesis in locust olfactory interneurones. J Exp Biol. 1995;198:821–829. doi: 10.1242/jeb.198.3.821. [DOI] [PubMed] [Google Scholar]
- Fujie S, Aonuma H, Ito I, Gelperin A, Ito E. The nitric oxide/cyclic GMP pathway in the olfactory processing system of the terrestrial slug Limax marginatus. Zool Sci. 2002;19:15–26. doi: 10.2108/zsj.19.15. doi:10.2108/zsj.19.15. [DOI] [PubMed] [Google Scholar]
- Fujie S, Yamamoto T, Murakami J, Hatakeyama D, Shiga H, Suzuki N, Ito E. Nitric oxide synthase and soluble guanylyl cyclase underlying the modulation of electrical oscillations in a central olfactory organ. J Neurobiol. 2005;62:14–30. doi: 10.1002/neu.20046. doi:10.1002/neu.20046. [DOI] [PubMed] [Google Scholar]
- Garthwaite J, Boulton CL. Nitric oxide signaling in the central nervous system. Annu Rev Physiol. 1995;57:683–706. doi: 10.1146/annurev.ph.57.030195.003343. doi:10.1146/annurev.ph.57.030195.003343. [DOI] [PubMed] [Google Scholar]
- Garthwaite J, Southam E, Boulton CL, Nielsen EB, Schmidt K, Mayer B. Potent and selective inhibition of nitric oxide-sensitive guanylyl cyclase by 1H-[1,2,4]oxadiazolo[4,3-a]quinoxalin-1-one. Mol Pharmacol. 1995;48:184–188. [PubMed] [Google Scholar]
- Gelperin A. Nitric oxide mediates network oscillations of olfactory interneurons in a terrestrial mollusc. Nature. 1994;369:61–63. doi: 10.1038/369061a0. doi:10.1038/369061a0. [DOI] [PubMed] [Google Scholar]
- Gelperin A, Flores J, Raccuia-Behling F, Cooke IR. Nitric oxide and carbon monoxide modulate oscillations of olfactory interneurons in a terrestrial mollusk. J Neurophysiol. 2000;83:116–127. doi: 10.1152/jn.2000.83.1.116. [DOI] [PubMed] [Google Scholar]
- Hansson BS, Carlsson MA, Kalinova B. Olfactory activation patterns in the antennal lobe of the sphinx moth, Manduca sexta. J Comp Physiol A. 2003;189:301–308. doi: 10.1007/s00359-003-0403-5. [DOI] [PubMed] [Google Scholar]
- Homberg U, Montague RA, Hildebrand JG. Anatomy of antenno-cerebral pathways in the brain of the sphinx moth Manduca sexta. Cell Tissue Res. 1988;254:255–281. doi: 10.1007/BF00225800. doi:10.1007/BF00225800. [DOI] [PubMed] [Google Scholar]
- Hopkins DA, Steinbusch HW, Markerink-van Ittersum M, De Vente J. Nitric oxide synthase, cGMP, and NO-mediated cGMP production in the olfactory bulb of the rat. J Comp Neurol. 1996;375:641–658. doi: 10.1002/(SICI)1096-9861(19961125)375:4<641::AID-CNE6>3.0.CO;2-1. doi:10.1002/(SICI)1096-9861(19961125)375:4<641::AID-CNE6>3.0.CO;2-1. [DOI] [PubMed] [Google Scholar]
- Hosler JS, Buxton KL, Smith BH. Impairment of olfactory discrimination by blockade of GABA and nitric oxide activity in the honeybee antennal lobes. Behav Neurosci. 2000;114:514–525. doi: 10.1037/0735-7044.114.3.514. doi:10.1037/0735-7044.114.3.514. [DOI] [PubMed] [Google Scholar]
- Inoue T, Watanabe S, Kawahara S, Kirino Y. Phase-dependent filtering of sensory information in the oscillatory olfactory center of a terrestrial mollusk. J Neurophysiol. 2000;84:1112–1115. doi: 10.1152/jn.2000.84.2.1112. [DOI] [PubMed] [Google Scholar]
- Kendrick KM, Guevara-Guzman R, Zorrilla J, Hinton MR, Broad KD, Mimmack M, Ohkura S. Formation of olfactory memories mediated by nitric oxide. Nature. 1997;388:670–674. doi: 10.1038/41765. doi:10.1038/41765. [DOI] [PubMed] [Google Scholar]
- Lei H, Christensen TA, Hildebrand JG. Local inhibition modulates odor-evoked synchronization of glomerulus-specific output neurons. Nat Neurosci. 2002;5:557–565. doi: 10.1038/nn0602-859. doi:10.1038/nn859. [DOI] [PubMed] [Google Scholar]
- Li Z, Chapleau MW, Bates JN, Bielefeldt K, Lee HC, Abboud FM. Nitric oxide as an autocrine regulator of sodium currents in baroreceptor neurons. Neuron. 1998;20:1039–1049. doi: 10.1016/s0896-6273(00)80484-5. doi:10.1016/S0896-6273(00)80484-5. [DOI] [PubMed] [Google Scholar]
- Matsumoto S, Hildebrand J. Olfactory mechanisms in the moth Manduca sexta: response characteristics and morphology of central neurons in the antennal lobes. Proc R Soc Lond. 1981;213:249–277. [Google Scholar]
- Moore PK, Handy RL. Selective inhibitors of neuronal nitric oxide synthase—is no NOS really good NOS for the nervous system? Trends Pharmacol Sci. 1997;18:204–211. doi: 10.1016/s0165-6147(97)01064-x. [DOI] [PubMed] [Google Scholar]
- Müller U. Inhibition of nitric oxide synthase impairs a distinct form of long-term memory in the honeybee, Apis mellifera. Neuron. 1996;16:541–549. doi: 10.1016/s0896-6273(00)80073-2. doi:10.1016/S0896-6273(00)80073-2. [DOI] [PubMed] [Google Scholar]
- Müller U, Hildebrandt H. The nitric oxide/cGMP system in the antennal lobe of Apis mellifera is implicated in integrative processing of chemosensory stimuli. Eur J Neurosci. 1995;7:2240–2248. doi: 10.1111/j.1460-9568.1995.tb00645.x. doi:10.1111/j.1460-9568.1995.tb00645.x. [DOI] [PubMed] [Google Scholar]
- Nighorn AJ, Gibson NJ, Rivers DM, Hildebrand JG, Morton DB. The nitric oxide-cGMP pathway may mediate communication between sensory afferents and projection neurons in the antennal lobe of Manduca sexta. J Neurosci. 1998;18:7244–7255. doi: 10.1523/JNEUROSCI.18-18-07244.1998. [DOI] [PMC free article] [PubMed] [Google Scholar]
- Prast H, Philippu A. Nitric oxide as modulator of neuronal function. Prog Neurobiol. 2001;64:51–68. doi: 10.1016/s0301-0082(00)00044-7. doi:10.1016/S0301-0082(00)00044-7. [DOI] [PubMed] [Google Scholar]
- Sakura M, Kabetani M, Watanabe S, Kirino Y. Impairment of olfactory discrimination by blockade of nitric oxide activity in the terrestrial slug Limax valentianus. Neurosci Lett. 2004;370:257–261. doi: 10.1016/j.neulet.2004.08.025. doi:10.1016/j.neulet.2004.08.025. [DOI] [PubMed] [Google Scholar]
- Samama B, Boehm N. Inhibition of nitric oxide synthase impairs early olfactory associative learning in newborn rats. Neurobiol Learn Mem. 1999;71:219–231. doi: 10.1006/nlme.1998.3869. doi:10.1006/nlme.1998.3869. [DOI] [PubMed] [Google Scholar]
- Teyke T, Gelperin A. Olfactory oscillations augment odor discrimination not odor identification by Limax CNS. Neuroreport. 1999;10:1061–1068. doi: 10.1097/00001756-199904060-00030. [DOI] [PubMed] [Google Scholar]
- Waldrop B, Christensen TA, Hildebrand J. GABA-mediated synaptic inhibition of projection neurons in the antennal lobes of the sphinx moth, Manduca sexta. J Comp Physiol. 1987;161:23–32. doi: 10.1007/BF00609452. doi:10.1007/BF00609452. [DOI] [PubMed] [Google Scholar]
- White RE. Cyclic GMP and ion channel regulation. Adv Second Messenger Phosphoprotein Res. 1999;33:251–277. doi: 10.1016/s1040-7952(99)80013-5. [DOI] [PubMed] [Google Scholar]
- Wilson C. Ph.D thesis. University of Arizona; 2005. An examination of the effects and possible targets of nitric oxide in olfactory neurons in the moth, Manduca sexta. [Google Scholar]
- Wilson C, Christensen T, Nighorn A. The effects of nitric oxide on synaptic inhibition in the antennal lobe of Manduca sexta. Soc Neurosci Abstr. 2003;821:19. [Google Scholar]