Abstract
Almost all RNAs can fold to form extensive base-paired secondary structures. Many of these structures then modulate numerous fundamental elements of gene expression. Deducing these structure–function relationships requires that it be possible to predict RNA secondary structures accurately. However, RNA secondary structure prediction for large RNAs, such that a single predicted structure for a single sequence reliably represents the correct structure, has remained an unsolved problem. Here, we demonstrate that quantitative, nucleotide-resolution information from a SHAPE experiment can be interpreted as a pseudo-free energy change term and used to determine RNA secondary structure with high accuracy. Free energy minimization, by using SHAPE pseudo-free energies, in conjunction with nearest neighbor parameters, predicts the secondary structure of deproteinized Escherichia coli 16S rRNA (>1,300 nt) and a set of smaller RNAs (75–155 nt) with accuracies of up to 96–100%, which are comparable to the best accuracies achievable by comparative sequence analysis.
Keywords: RNA secondary structure, prediction, ribosome, pseudo-free energy, dynamic programming
Essentially all RNA molecules, even those with seemingly random sequences, have the ability to form extensive internal base pairs (1–3). This internal structure has profound consequences for RNA function. At large scales, long RNAs fold to form complex regulatory motifs like those found in the 5′ and 3′ untranslated regions of mRNAs and viral genomes and in large structured RNAs like ribozymes (4). On small scales, the extent of local structure over regions spanning 10–50 nt modulates whether an RNA motif can function in translation initiation by the ribosome, is accessible for interaction with the splicing machinery, or binds small siRNAs and miRNAs (5–7).
To understand these fundamental cellular processes, it must be possible to reliably establish the structure of an RNA based on a single sequence. Accurate RNA secondary structures reflecting a single biological state are essential to deduce structure–function relationships in the many RNAs (i) for which a structure cannot be inferred by comparative analysis, (ii) that switch between distinct base-paired conformations to carry out their biological function, or (iii) that are in the process of folding to a functional state.
Two broad classes of approaches are used to score RNA secondary structure predictions for single sequences: empirical free-energy parameters (7) and knowledge based (8–10). The current best-performing algorithms achieve a sensitivity (percentage of known base pairs predicted correctly) of 40–70% (8–12). Prediction accuracies are higher for shorter RNAs, for base pairs with low contact order (the number of nucleotides that separate the paired nucleotides), and when chemical modification information is used to constrain folding (11, 12). Accuracies tend to be poor for longer RNAs, and there are important short RNAs for which the prediction sensitivity is zero (12, 13).
Results
Structure of Escherichia coli 16S rRNA, as Predicted by a Best-of-Category Algorithm.
We focused on 16S ribosomal RNA (rRNA) because its structure is known and it contains numerous typical RNA motifs (14, 15). We predicted the secondary structure of 16S rRNA by using the program RNAstructure (11), whose algorithm is among the most accurate currently available (8). RNAstructure finds the lowest free energy structure by using empirical thermodynamic parameters fit against a large database of model structures with known stability (11, 16). We also implemented a maximum allowable distance between base pairs of 600 nt, because 99% of base pairs in rRNAs involve pairings of less than this distance (12, 17). Throughout this work, we only consider the lowest free energy structure output by RNAstructure because, even if more accurate structures are predicted at higher folding free energies, there is no general way to identify these as improved structures.
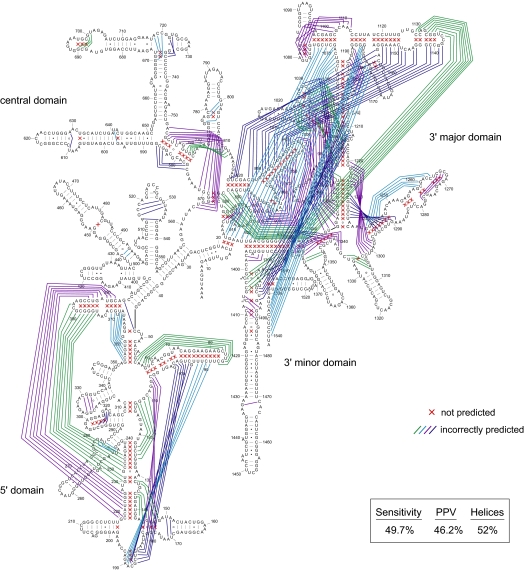
Prediction errors can be of 2 classes. Either known base pairs are missed or base pairs are predicted that do not exist in the accepted target structure. These errors are reported by 2 prediction accuracy measures, sensitivity and positive predictive value (PPV; the percentage of predicted base pairs in the known structure). By using thermodynamic information alone, prediction sensitivity and PPV for E. coli 16S rRNA are 49.7% and 46.2%, respectively (errors are illustrated with red x's and lines; Fig. 1).
Fig. 1.
Accuracy of secondary structure prediction for E. coli 16S rRNA by using free energy minimization alone. Base pairs determined by comparative sequence analysis (32) but not predicted by free energy minimization are represented by red x's; predicted pairs not present in the covariation structure are indicated by lines.
A critical objective of RNA secondary structure prediction is to create models useful for developing biological hypotheses regarding RNA function. This objective can be well met by defining the overall topology of an RNA in terms of the constituent helices and their connectivity. Thus, we also calculate the prediction sensitivity for helices. There are 69 helices in the covariation structure for 16S rRNA, defined as a continuous stack of 3 or more canonical base pairs interrupted by no more than a single nucleotide bulge. Overall, 52% of helices in 16S rRNA are predicted in the lowest-free-energy structure. Errors are distributed unevenly throughout the RNA and, for example, 71% (15 of 21) of helices in the 3′ major domain are not predicted correctly (Fig. 1). All 3 metrics, sensitivity of base pairs, PPV, and sensitivity of helices, support the same conclusion. For 16S rRNA, the predicted secondary structure is correct in some regions; whereas, in other regions, the structure is completely wrong (Fig. 1 and Table 1).
Table 1.
Prediction accuracy for 16S rRNA as a function of experimental information
| Experimental constraints | Target | Base pairs |
Helices |
|
|---|---|---|---|---|
| Sensitivity | PPV | Sensitivity | ||
| None | 1 | 49.7 | 46.2 | 52 |
| SHAPE | 1 (covariation model) | 84.2 | 80.9 | 90 |
| SHAPE | 2 (with omit regions) | 91.1 | 83.1 | 95 |
| SHAPE | 3 (with local refolding) | 97.2 | 95.1 | 98 |
| Moderate and strong chemical modification prohibited at internal base pairs | (omit pseudoknots) | 71.8 | 67.4 | 75 |
| Moderate chemical modification prohibited at internal base pairs; sites of strong reactivity required to be single stranded | (omit pseudoknots) | 66.7 | 64.2 | 70 |
The structure of 16S rRNA has been assessed by using conventional chemical modification reagents (DMS, kethoxal, and CMCT) (18). Prediction accuracies using RNAstructure improve when positions judged to have strong or moderate reactivities are prohibited from participating in Watson–Crick base pairs except at the end of helices or adjacent to GU pairs: the resulting sensitivity and PPV are 71.8% and 67.4%, respectively; 75% of helices are predicted correctly [Table 1 and supporting information (SI) Fig. S1]. However, predictions at 75% sensitivity are still characterized by many regions with large errors (Fig. S1). An alternate, widely used, 2-criterion approach for interpreting chemical modification data, prohibiting sites of chemical modification from forming internal base pairs and forcing sites of strong reactivity to be single-stranded, actually reduces accuracy: sensitivity and PPV decrease to 66.7% and 64.2%, only 70% of helices are predicted correctly (Table 1).
In sum, these calculations emphasize the persistent and unmet challenges in secondary structure prediction. Neither thermodynamic-based prediction nor prediction constrained by conventional chemical mapping data yield an accurate structure for 16S rRNA. Developing useful biological hypotheses by using RNA secondary structures predicted at even 75% sensitivity is difficult. Moreover, widespread prediction of elements that are not in the accepted structure, as reflected in a poor PPV, underscores the difficulty, or impossibility, of designing instructive experiments guided by this level of accuracy.
Redefining the RNA Secondary Structure Prediction Problem.
Current thermodynamic parameters are spectacularly useful for predicting the stability of individual helices and hairpins (7, 19). However, several factors make it difficult to predict large RNA structures. First, many structures have predicted folding free energies within 1 kcal/mol of that for the most stable structure. Second, kinetic processes and protein–RNA interactions may modulate RNA folding. Third, local interactions exhibit complex sequence-dependent interactions (20, 21) and it may not be possible to account for all interactions with a tractable number of parameters.
Local nucleotide flexibility can be measured at the vast majority of positions in any RNA by use of SHAPE (selective 2′-hydroxyl acylation analyzed by primer extension) chemistry (22, 23). SHAPE is approaching conventional DNA sequencing in terms of the facility and straightforwardness with which it can be performed (24–27). In a SHAPE experiment, RNA is treated with an electrophile that reacts selectively, but sparsely, with the 2′-hydroxyl position at conformationally flexible nucleotides to form a 2′-O-adduct. 2′-O-adducts are then detected by primer extension. SHAPE reactivities report the extent to which a nucleotide is constrained by base pairing or other interactions (22, 24, 27–29). We therefore sought to redefine the RNA secondary structure prediction problem to use quantitative, nucleotide-resolution SHAPE information in concert with thermodynamic parameters for RNA folding.
SHAPE Analysis of E. coli 16S and 23S rRNAs.
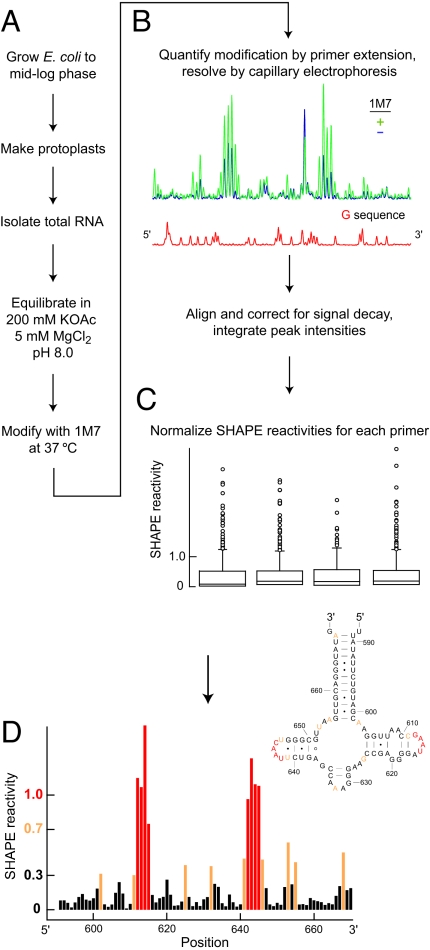
Total RNA was purified from E. coli bacteria by using a nondenaturing protocol, equilibrated under conditions that stabilize native RNA structure (Fig. 2A), and treated with 1-methyl-7-nitroisatoic anhydride (1M7) (24). Sites of adduct formation were detected by a high-throughput SHAPE approach in which the primer extension reactions, performed by using color-coded fluorescently labeled DNA primers, are resolved by capillary electrophoresis (Fig. 2B) (24, 25). SHAPE reactivities for each primer read, covering 350–600 nt, were normalized by using model-free statistics to a scale spanning 0 to ≈2, where 1.0 is the average intensity for highly reactive positions (Fig. 2C). Nucleotides with normalized SHAPE reactivities >0.7 or 0.3–0.7 are considered highly and moderately reactive, respectively, and are colored red and yellow. Unreactive nucleotides, with SHAPE reactivities <0.3, are black (Fig. 2D).
Fig. 2.
Analysis of E. coli rRNA structure by SHAPE. (A) Total RNA isolation under nondenaturing conditions and modification with a SHAPE electrophile. (B) Resolution of SHAPE reactivities by capillary electrophoresis. (C) Calculation of normalized SHAPE reactivities by box-plot analysis (31). (D) Histogram of SHAPE data and superposition on the secondary structure for E. coli 23S rRNA.
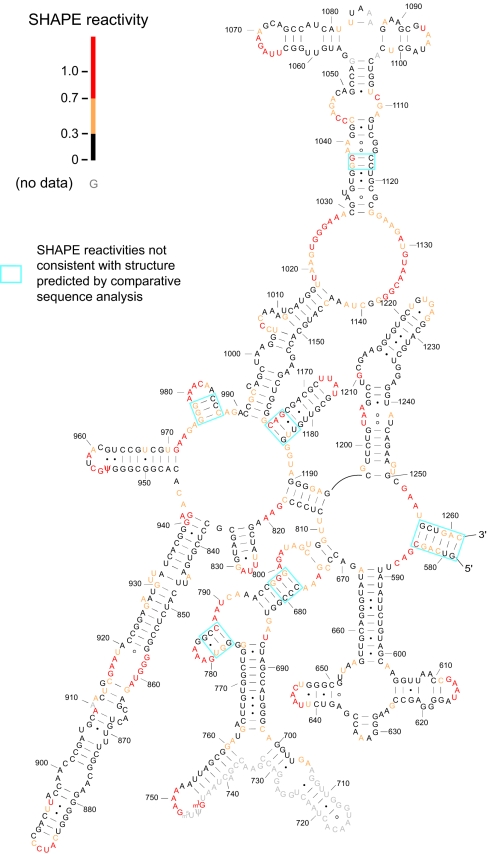
We analyzed 91% and 95% of the nucleotides in E. coli 16S and 23S rRNAs (1,542 and 2,904 nt, respectively). In many regions, including domain II of 23S rRNA, agreement between SHAPE reactivities and the secondary structure determined by comparative sequence analysis is essentially perfect (Fig. 3). Nucleotides that participate in canonical base pairs are unreactive; whereas, nucleotides in loops, bulges, and other connecting regions are reactive (compare black with red and yellow nucleotides; Fig. 3).
Fig. 3.
SHAPE data superimposed on domain II of the covariation-based structure (32) of E. coli 23S rRNA. Nucleotides are colored by their SHAPE reactivities; nucleotides with no data are gray; positions at which SHAPE reactivities are not consistent with the covariation structure are enclosed by blue boxes.
In a few regions, nucleotides expected to be base paired are scored as reactive by SHAPE (blue boxes, Fig. 3): these positions apparently reflect regions in which evolutionarily supported base pairs do not form when rRNA is isolated from bacteria. The number of such nucleotides is small, ≈9% of all nucleotides in the 16S and 23S rRNAs. SHAPE thus provides comprehensive, direct, and quantitative information regarding the structure of large RNAs.
ΔGSHAPE.
SHAPE reactivities report fine differences in local nucleotide flexibility (Fig. 3) (22, 27–29) and are strongly correlated with the extent of local disorder as measured by the NMR generalized order parameter (30). Because base pair formation also reduces local nucleotide flexibility and disorder, SHAPE reactivities are inversely correlated with the probability that a nucleotide forms a base pair. We therefore create a pseudo-free energy change term for RNA folding at nucleotide i as
This model has 2 free parameters, the intercept b and slope m. The intercept is negative and represents a favorable free energy increment for pairing nucleotides at which the SHAPE reactivity is low. The slope is positive and penalizes base pairing at nucleotides with high SHAPE reactivities. The ΔGSHAPE term was integrated into the dynamic programming algorithm in RNAstructure (11) as an additional nearest neighbor free energy change term (16).
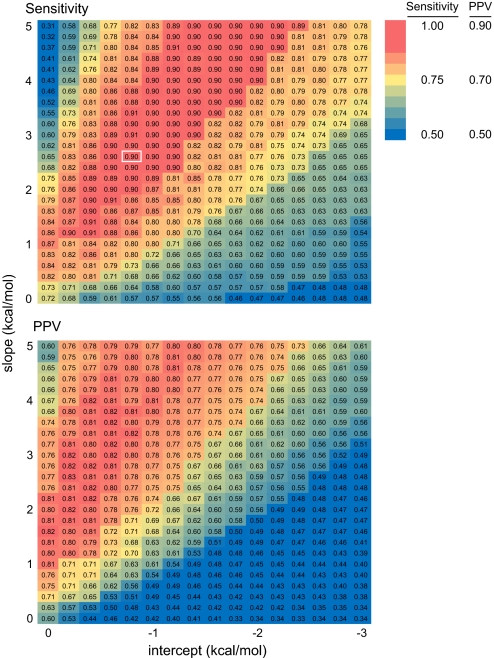
The slope and intercept were parameterized against 23S rRNA by using the secondary structure determined by comparative sequence analysis (15) as the target structure (Fig. 4). 23S rRNA is a good choice for parameterization because this single RNA encompasses a large database of diverse and nonredundant RNA motifs. In this analysis, we excluded nucleotides (14%) where SHAPE shows that base pairs in the comparative structure do not form or for which no SHAPE reactivity information was obtained (blue boxes and gray nucleotides, Figs. 3 and S2). In the absence of the ΔGSHAPE term, base pairs in 23S rRNA are predicted with a sensitivity and PPV of 72% and 60% (0,0 point; Fig. 4). As the absolute values of the intercept and slope increase, prediction accuracy improves to produce a large “sweet spot” corresponding to >89% sensitivity (in red, Fig. 4).
Fig. 4.
Accuracy of RNA secondary structures for E. coli 23S rRNA as a function of ΔGSHAPE pseudo-free energy change parameters.
The optimal parameter regions for both sensitivity and PPV are large. Good predictions are therefore obtained even if the ΔGSHAPE parameters are varied by large increments (Fig. 4). As general parameters for folding large RNAs, we selected a slope and intercept of 2.6 and −0.8 kcal/mol, respectively, because this point corresponds to a high prediction sensitivity, is adjacent only to other points in the sweet spot, and is as close as possible to the origin. We selected parameters centrally located in the optimal region to accommodate RNAs whose folding properties might differ from 23S rRNA. We chose a point close to the origin to impose the smallest bias in the nearest neighbor free energy calculation consistent with high prediction accuracy. The estimate of >89% correctly predicted base pairs in 23S rRNA (Fig. 4) is a conservative, lower limit because some regions in the deproteinized rRNA do not actually fold to the phylogenetically accepted structure.
16S rRNA Structure Determination.
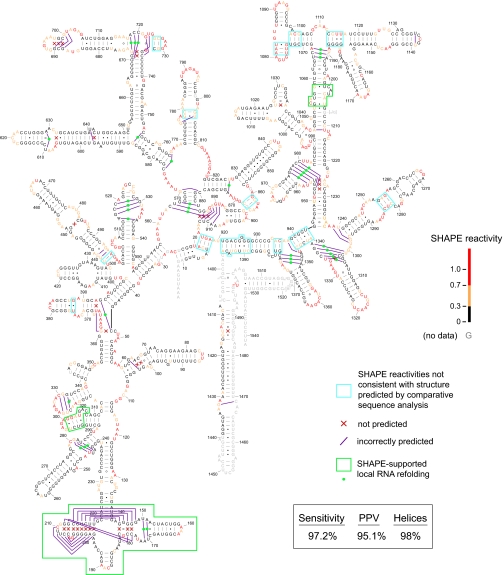
Use of ΔGSHAPE free energies, optimized against 23S rRNA, dramatically increase the prediction accuracy for E. coli 16S rRNA (compare Figs. 1 and 5). We considered 3 target structures when quantifying the overall prediction accuracy.
The structure determined by comparative sequence analysis. This is a conservative approach and assumes that all base pairs showing evolutionary covariation are maintained in the free RNA in the absence of ribosomal proteins.
The comparative structure after omitting regions (i) that clearly do not fold to this structure as judged by SHAPE or (ii) for which no structural data could be obtained. These “omit” regions are emphasized with blue boxes and gray nucleotide lettering, respectively (Fig. 5).
A structure that allows for local RNA refolding. Although we purified 16S and 23S rRNAs from cells under nondenaturing conditions (Fig. 2A), the deproteinized 16S rRNA clearly refolds in some regions (Fig. 5 and ref. 18). Many base pairs predicted by our algorithm are, in fact, strongly supported by SHAPE data. For this target, we thus allow alternative base pairings in regions where a well-defined local RNA refolding is more consistent with the experimental SHAPE reactivity than are the base pairs in the comparative structure. There are 43 such base pairs, corresponding to 6% of the nucleotides in 16S rRNA (in green, Fig. 5). We also allow local refolding at the 4-helix junction spanning positions 139–224 because direct experimental analysis supports the alternate model (Fig. S3).
Fig. 5.
Accuracy of SHAPE-directed secondary structure determination for E. coli 16S rRNA. ΔGSHAPE parameters were intercept and slope of −0.8 and 2.6 kcal/mol, respectively. Missed base pairs are indicated by red x's; incorrectly predicted base pairs are represented by purple lines. Nucleotides are colored by their SHAPE reactivities. Regions where SHAPE reactivities are not consistent with the accepted phylogenetic structure are indicated with blue boxes. Regions and specific base pairs where the experimental SHAPE information supports local refolding are indicated with green boxes and spheres, respectively.
Taking the secondary structure model established by comparative sequence analysis as the target structure (target 1), sensitivity and PPV for SHAPE-directed prediction of E. coli 16S rRNA are 84.2% and 80.9% (Table 1). The overall topology is also good: 90% of all helices are identified correctly.
If regions for which SHAPE reactivities are clearly incompatible with the comparative structure or for which no data could be obtained are omitted (target 2), sensitivity and PPV are 91.1% and 83.1%, respectively (Table 1). Moreover, the topology is almost exactly right: 95% of helices outside of the omit regions are predicted correctly.
Allowing for experimentally supported refoldings (target 3; identified with green dots and boxes, Fig. 5), sensitivity and PPV are 97.2% and 95.1%. Sixty-eight of the 69 helices are predicted correctly and thus the topology of the RNA is correct (Table 1 and Fig. 5).
Structure Determination for Nonribosomal RNAs.
To assess the generality of the SHAPE-directed approach, we also determined secondary structures for 3 smaller, pseudoknot free, RNAs: yeast tRNAAsp, domain II of the HCV internal ribosome entry sequence (HCV IRES), and the P546 domain of the bI3 group I intron. Inclusion of SHAPE constraints yields accurate structures in all cases. The structure of tRNAAsp is well predicted by thermodynamics parameters alone (95% sensitivity), but SHAPE data still provide sufficient information to yield a perfect prediction (100% sensitivity). The HCV IRES and bI3 intron RNAs are, like 16S rRNA, poorly predicted by thermodynamic information alone; critically, inclusion of SHAPE information results in nearly perfect predictions (Table 2; structures are provided in Fig. S4).
Table 2.
Prediction accuracies for nonribosomal RNAs
| RNA | Nucleotides | No constraints |
SHAPE |
||
|---|---|---|---|---|---|
| Sensitivity | PPV | Sensitivity | PPV | ||
| Yeast tRNAAsp | 75 | 95.2 | 95.2 | 100.0 | 100.0 |
| HCV IRES domain II | 95 | 56.5 | 59.1 | 95.7 | 100.0 |
| P546 domain, group I intron | 155 | 42.9 | 44.4 | 96.4 | 98.2 |
Discussion
By incorporating experimental SHAPE information as a pseudo-free energy change term in RNAstructure, we determine the structures of E. coli 16S rRNA and of 3 smaller RNAs almost perfectly (Fig. 5, Tables 1 and 2). Differences between the SHAPE-directed structures and the accepted target structures are usually small and short-range. At this level of difference, it is not clear whether the error lies in the predicted structure or in the accepted structure. SHAPE-directed secondary structure determination also gives excellent results for wide choices in the 2 free ΔGSHAPE parameters and is thus tolerant of experimental and procedural variability (Fig. 4).
16S rRNA is among the most comprehensive structure prediction challenges available. The secondary structure for 16S rRNA was established by comparative sequence analysis and 97% of the predicted base pairs are visualized in the crystal structure of intact 30S ribosomal subunits (15). This modeling accuracy required analysis of 7,000 sequences and refinement over 20 years. The 97% sensitivity obtained here for deproteinized 16S rRNA based on a single SHAPE analysis is comparable to that achieved by covariation analysis. We find that SHAPE-directed folding also yields excellent results for RNAs whose structures cannot be determined by covariation analysis such as folding intermediates (27–29) and intact viral genomes (25).
The simplicity of SHAPE chemistry and the availability of appropriate data analysis tools (this work and refs. 11 and 26) make this technology amenable to a wide variety of problems. There remain 2 major, addressable challenges. First, none of the 5 RNAs studied here form pseudoknots in their deproteinized forms and our algorithm does not allow this structure. In the future, experimentally based ΔGSHAPE pseudo-free energy approaches can clearly be incorporated into algorithms that predict secondary structures with pseudoknots. Second, extensions of the current experimental approach will be required for RNA regions in which base pairs either form only in context of higher-order tertiary interactions (24) or are so tightly constrained by such interactions that few nucleotides are reactive.
The high level of confidence demonstrated by SHAPE-directed RNA structure determination now makes it possible to analyze the plurality of RNA secondary structures that cannot be gleaned from comparative sequence analysis or that are changing in response to dynamic cellular processes. Such RNAs include authentic viral genomes, intact messenger RNAs, and noncoding RNAs in distinct functional states.
Materials and Methods
SHAPE Analysis of Native E. coli RNA.
Total RNA was isolated under nondenaturing conditions from midlog phase E. coli (DH5α) cultures and equilibrated in folding buffer [50 mM Hepes (pH 8.0), 200 mM potassium acetate (pH 8.0), and 5 mM MgCl2]. SHAPE experiments were initiated by addition of 1/10 vol of 1-methyl-7-nitro-isatoic anhydride in DMSO (1M7, 60 mM) (24). 2′-O-adducts were detected by primer extension. Fluorescently labeled cDNA products were quantified by using ShapeFinder, as described (25, 26). SHAPE reactivities from each primer read were placed on a normalized scale by dividing by the average intensity of the 10% most highly reactive nucleotides, after excluding outliers, identified by using a box plot analysis as reactivities >1.5× the interquartile range (31).
Incorporation of SHAPE Pseudo-Free Energy Change Terms into a Dynamic Programming Algorithm.
All structure calculations were performed using RNAstructure (11). ΔGSHAPE free energy change values were added to the free energy change for each nucleotide in a nearest neighbor stack, as described in ref. 16.
Software Availability.
ShapeFinder, used to process capillary electrophoresis data, is freely available to academic researchers at http://bioinfo.unc.edu. RNAstructure, which implements the ΔGSHAPE pseudo-free energy change term, is freely available at http://rna.urmc.rochester.edu. RNA secondary structure diagrams are based on models developed by comparative sequence analysis (15, 32) and were composed using xrna (http://rna.ucsc.edu/rnacenter/xrna/).
Additional details regarding the methods for RNA isolation, data processing, and structure calculations are available in the SI Text.
Supplementary Material
Acknowledgments.
This work was supported by National Institutes of Health Grants AI068462 (to K.M.W.) and GM076485 (to D.H.M.). K.E.D. and T.W.L. were supported by the National Science Foundation Grant MCB-0416941 (to K.M.W.) and by the UNC–Chapel Hill Office of Undergraduate Research, the Frances C. and William P. Smallwood Foundation, and J. Thurman Freeze and James H. McGuire fellowships. K.E.D is an Undergraduate Scholar of the Beckman Foundation.
Footnotes
The authors declare no conflict of interest.
This article is a PNAS Direct Submission.
This article contains supporting information online at www.pnas.org/cgi/content/full/0806929106/DCSupplemental.
References
- 1.Doty P, et al. Secondary structure in ribonucleic acids. Proc Natl Acad Sci USA. 1959;45:482–499. doi: 10.1073/pnas.45.4.482. [DOI] [PMC free article] [PubMed] [Google Scholar]
- 2.Workman C, Krogh A. No evidence that mRNAs have lower folding free energies than random sequences with the same dinucleotide distribution. Nucleic Acids Res. 1999;27:4816–4822. doi: 10.1093/nar/27.24.4816. [DOI] [PMC free article] [PubMed] [Google Scholar]
- 3.Buchmueller KL, Webb AE, Richardson DA, Weeks KM. A collapsed, non-native RNA folding state. Nat Struct Biol. 2000;7:362–366. doi: 10.1038/75125. [DOI] [PubMed] [Google Scholar]
- 4.Gesteland RF, Cech TR, Atkins JF. The RNA World. 3rd Ed. Cold Spring Harbor, NY: Cold Spring Harbor Laboratory Press; 2006. [Google Scholar]
- 5.Kozak M. Regulation of translation via mRNA structure in prokaryotes and eukaryotes. Gene. 2005;361:13–37. doi: 10.1016/j.gene.2005.06.037. [DOI] [PubMed] [Google Scholar]
- 6.Wang Z, Burge CB. Splicing regulation: From a parts list of regulatory elements to an integrated splicing code. RNA. 2008;14:802–813. doi: 10.1261/rna.876308. [DOI] [PMC free article] [PubMed] [Google Scholar]
- 7.Mathews DH, Turner DH, Zuker M. RNA secondary structure prediction. Curr Protoc Nucleic Acid Chem. 2007;11 doi: 10.1002/0471142700.nc1102s28. unit 11.2. [DOI] [PMC free article] [PubMed] [Google Scholar]
- 8.Dowell RD, Eddy SR. Evaluation of several lightweight stochastic context-free grammars for RNA secondary structure prediction. BMC Bioinformatics. 2004;5:71. doi: 10.1186/1471-2105-5-71. [DOI] [PMC free article] [PubMed] [Google Scholar]
- 9.Dima RI, Hyeon C, Thirumalai D. Extracting stacking interaction parameters for RNA from the data set of native structures. J Mol Biol. 2005;347:53–69. doi: 10.1016/j.jmb.2004.12.012. [DOI] [PubMed] [Google Scholar]
- 10.Do CB, Woods DA, Batzoglou S. CONTRAfold: RNA secondary structure prediction without physics-based models. Bioinformatics. 2006;22:e90. doi: 10.1093/bioinformatics/btl246. [DOI] [PubMed] [Google Scholar]
- 11.Mathews DH, et al. Incorporating chemical modification constraints into a dynamic programming algorithm for prediction of RNA secondary structure. Proc Natl Acad Sci USA. 2004;101:7287–7292. doi: 10.1073/pnas.0401799101. [DOI] [PMC free article] [PubMed] [Google Scholar]
- 12.Doshi KJ, Cannone JJ, Cobaugh CW, Gutell RR. Evaluation of the suitability of free-energy minimization using nearest-neighbor energy parameters for RNA secondary structure prediction. BMC Bioinformatics. 2004;5:105. doi: 10.1186/1471-2105-5-105. [DOI] [PMC free article] [PubMed] [Google Scholar]
- 13.Ding F, et al. Ab initio RNA folding by discrete molecular dynamics: from structure prediction to folding mechanisms. RNA. 2008;14:1164–1173. doi: 10.1261/rna.894608. [DOI] [PMC free article] [PubMed] [Google Scholar]
- 14.Wimberly BT, et al. Structure of the 30S ribosomal subunit. Nature. 2000;407:327–339. doi: 10.1038/35030006. [DOI] [PubMed] [Google Scholar]
- 15.Gutell RR, Lee JC, Cannone JJ. The accuracy of ribosomal RNA comparative structure models. Curr Opin Struct Biol. 2002;12:301–310. doi: 10.1016/s0959-440x(02)00339-1. [DOI] [PubMed] [Google Scholar]
- 16.Xia T, et al. Thermodynamic parameters for an expanded nearest-neighbor model for formation of RNA duplexes with Watson–Crick base pairs. Biochemistry. 1998;37:14719–14735. doi: 10.1021/bi9809425. [DOI] [PubMed] [Google Scholar]
- 17.Lu ZJ, Mathews DH. Efficient siRNA selection using hybridization thermodynamics. Nucleic Acids Res. 2008;36:640–647. doi: 10.1093/nar/gkm920. [DOI] [PMC free article] [PubMed] [Google Scholar]
- 18.Moazed D, Stern S, Noller HF. Rapid chemical probing of conformation in 16S ribosomal RNA and 30S ribosomal subunits using primer extension. J Mol Biol. 1986;187:399–416. doi: 10.1016/0022-2836(86)90441-9. [DOI] [PubMed] [Google Scholar]
- 19.Turner DH. Thermodynamics of base pairing. Curr Opin Struct Biol. 1996;6:299–304. doi: 10.1016/s0959-440x(96)80047-9. [DOI] [PubMed] [Google Scholar]
- 20.Mathews DH, Turner DH. Experimentally derived nearest-neighbor parameters for the stability of RNA three- and four-way multibranch loops. Biochemistry. 2002;41:869–880. doi: 10.1021/bi011441d. [DOI] [PubMed] [Google Scholar]
- 21.Chen G, Znosko BM, Jiao X, Turner DH. Factors affecting thermodynamic stabilities of RNA 3 x 3 internal loops. Biochemistry. 2004;43:12865–12876. doi: 10.1021/bi049168d. [DOI] [PubMed] [Google Scholar]
- 22.Merino EJ, Wilkinson KA, Coughlan JL, Weeks KM. RNA structure analysis at single nucleotide resolution by selective 2′-hydroxyl acylation and primer extension (SHAPE) J Am Chem Soc. 2005;127:4223–4231. doi: 10.1021/ja043822v. [DOI] [PubMed] [Google Scholar]
- 23.Wilkinson KA, Merino EJ, Weeks KM. Selective 2′-hydroxyl acylation analyzed by primer extension (SHAPE): Quantitative RNA structure analysis at single nucleotide resolution. Nat Protocols. 2006;1:1610–1616. doi: 10.1038/nprot.2006.249. [DOI] [PubMed] [Google Scholar]
- 24.Mortimer SA, Weeks KM. A fast acting reagent for accurate analysis of RNA secondary and tertiary structure by SHAPE chemistry. J Am Chem Soc. 2007;129:4144–4145. doi: 10.1021/ja0704028. [DOI] [PubMed] [Google Scholar]
- 25.Wilkinson KA, et al. High-throughput SHAPE analysis reveals structures in HIV-1 genomic RNA strongly conserved across distinct biological states. PLoS Biol. 2008;6:e96. doi: 10.1371/journal.pbio.0060096. [DOI] [PMC free article] [PubMed] [Google Scholar]
- 26.Vasa SM, et al. ShapeFinder: A software system for high-throughput quantitative analysis of nucleic acid reactivity information resolved by capillary electrophoresis. RNA. 2008;14:1979–1990. doi: 10.1261/rna.1166808. [DOI] [PMC free article] [PubMed] [Google Scholar]
- 27.Duncan CDS, Weeks KM. SHAPE analysis of long-range interactions reveals extensive and thermodynamically preferred misfolding in a fragile group I intron RNA. Biochemistry. 2008;47:8504–8513. doi: 10.1021/bi800207b. [DOI] [PMC free article] [PubMed] [Google Scholar]
- 28.Wilkinson KA, Merino EJ, Weeks KM. RNA SHAPE chemistry reveals non-hierarchical interactions dominate equilibrium structural transitions in tRNAAsp transcripts. J Am Chem Soc. 2005;127:4659–4667. doi: 10.1021/ja0436749. [DOI] [PubMed] [Google Scholar]
- 29.Wang B, Wilkinson KA, Weeks KM. Complex ligand-induced conformational changes in tRNAAsp revealed by single nucleotide resolution SHAPE chemistry. Biochemistry. 2008;47:3454–3461. doi: 10.1021/bi702372x. [DOI] [PubMed] [Google Scholar]
- 30.Gherghe CM, et al. Strong correlation between SHAPE chemistry and the generalized NMR order parameter (S2) in RNA. J Am Chem Soc. 2008;130:12244–12245. doi: 10.1021/ja804541s. [DOI] [PMC free article] [PubMed] [Google Scholar]
- 31.Chernick MR, Friis RH. Introductory Biostatistics for the Health Sciences. New York: Wiley; 2003. pp. 58–60. [Google Scholar]
- 32.Cannone JJ, et al. The comparative RNA web (CRW) site: An online database of comparative sequence and structure information for ribosomal, intron, and other RNAs. BMC Bioinformatics. 2002;3:2. doi: 10.1186/1471-2105-3-2. [DOI] [PMC free article] [PubMed] [Google Scholar]
Associated Data
This section collects any data citations, data availability statements, or supplementary materials included in this article.


