Abstract
Organogenesis, the process by which organs develop from individual precursor stem cells, requires that the precursor cells proliferate, differentiate, and aggregate to form a functioning structure. This process progresses through changes in 4 dimensions: time and 3 dimensions of space—4D. Experimental analysis of organogenesis, by its nature, cuts the 4D developmental process into static, 2D histological images or into molecular or cellular markers and interactions with little or no spatial dimensionality and minimal dynamics. Understanding organogenesis requires integration of the piecemeal experimental data into a running, realistic and interactive 4D simulation that allows experimentation and hypothesis testing in silico. Here, we describe a fully executable, interactive, visual model for 4D simulation of organogenic development using the mouse pancreas as a representative case. Execution of the model provided a dynamic description of pancreas development, culminating in a structure that remarkably recapitulated morphologic features seen in the embryonic pancreas. In silico mutations in key signaling molecules resulted in altered patterning of the developing pancreas that were in general agreement with in vivo data. The modeling approach described here thus typifies a useful platform for studying organogenesis as a phenomenon in 4 dimensions.
Keywords: 4D simulation, computational biology, pancreas, development
Organogenesis and morphogenesis have been of interest to many scientists in different fields for a long time. Understanding organogenesis not only explains how biological systems are formed but can also offer insight into their evolution (e.g., the shape of a leaf is, in part, an adjustment to varying habitats). In this article, we present a generic approach to the realistic 4D modeling of organogenesis based on experimental data. Furthermore, we describe how we applied this approach to modeling pancreatic organogenesis.
Four-Dimensional Modeling
Organogenesis, the development of a functioning, anatomically specialized organ from a relatively small number of relatively undifferentiated precursor cells, is critically influenced by factors involving multiple scales, dynamics, and 3D anatomic relationships. The importance of scales is evident in the scale-crossing chain of genetic and chemical reactions leading to cellular behavior and anatomic structuring that, in turn, feeds back down the scales to influence gene expression; indeed, the emergence of many important properties of living systems needs to take account of interactions that take place across different scales (1). The importance of dynamics is evident in the time dependency of developmental processes at every scale, and the importance of 3D anatomy is evident in the specific structure of the developing organ and its dependence on interactions with adjacent cells and molecular inducers.
Experimental data, because of the analytical nature of science, rarely, if ever, provide a smooth transition across scales; they are usually limited to snapshots of processes in place of dynamics and furnish only very crude, if any, 3D information. Because scale, dynamics, and 3D anatomy are of the essence in organogenesis, an adequate understanding of the process would be greatly enhanced by tools that would be able to integrate the piecemeal, static, and isolated experimental data into precisely flowing and transscaler 4D models. Moreover, the value of such modeling would be greatly enhanced if it would allow experimentation and hypothesis testing in silico as a guide to biological experimentation and if the modeling interface would provide visual representations intuitively comprehensible to experimentalists. This article reports a step in developing a realistic 4D approach to organogenesis.
Modeling Approach
In the current study, we focused on the development of the pancreas, a compound organ with a unique structure, essential for the exocrine digestion of foodstuffs and for the hormonal regulation of metabolism. We integrated the known mechanisms and processes, including histological images, using reactive animation (2), a previously developed technique that links a reactive executable model with an animated front end to form a visualized, interactive, and dynamic model. Previously, reactive animation was used to model T cell proliferation in the thymus gland and to model development of the lymph node by using a reactive model that was linked to a 2D interactive front end (2–4). For the current work, we extended reactive animation and designed a generic platform that enables interaction among reactive engines, 3D animation, and real-time analysis tools (5).
We formalized pancreatic organogenesis as an autonomous agent system by specifying statecharts (6) for organogenesis of the pancreas. Statecharts define the behavior of objects by using a hierarchy of states—possibly parallel states also—with transitions, events, and conditions. For example, to describe a receptor, we took a simplistic approach defining 2 states, Unbound and Bound, and 2 transitions to connect them. When executed, the active state of the receptor is set to Unbound. As the simulation advances, the active state moves to Bound when the required event is generated.
We defined a cell, the basic building block of an organ, as an entity that senses environmental signals and responds to them. In addition, we modeled the environment that surrounds the pancreas and supplies important inducing signals. To better visualize and manipulate the simulation, we linked the model to a 3D animated front end (in 3DGameStudio game engine) and to a mathematical interface (in Matlab). At run time, the front end visualizes the simulation continuously and provides the means to interact with it. Separately, the mathematical interface provides statistics and graphs of the simulation.
We present here a model that covers the primary stages of pancreatic organogenesis in the mouse. Although it is a partial introduction to a complex subject, the model has already furnished insights. We tested the model by comparing the results against related experimental data and theoretical work. Generally, the simulation captured pancreatic organogenesis and provided a dynamic description of the system. In particular, in silico analysis of the morphogenesis emerging from the simulation revealed a close visual resemblance to histological images of the pancreas. Although we did not have anything like this in mind when we started out, and although the model was not explicitly programmed to do so, the simulation gave rise to an emergent property that corresponds well with the primary transition clusters appearing early in the developing organ in vivo (7–9). Furthermore, we compared the simulation with in vivo ablation experiments of tissues in the surrounding environment by reproducing experimental results in silico. The results agreed with the biology by reproducing similar results and provided a dynamic analysis of the experiments.
Pancreatic Organogenesis
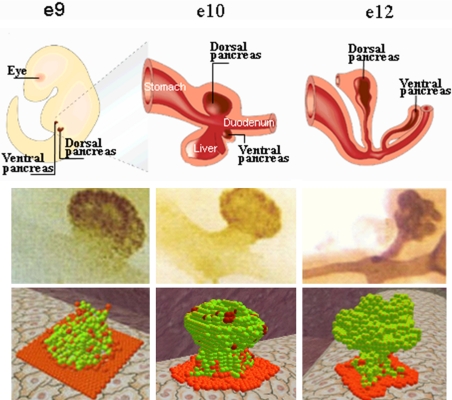
In mice, pancreatic organogenesis is initiated at the 8th embryonic day, and is roughly divided into 2 transitions, primary and secondary (10). During the primary transition, cells at the appropriate regions of the flat gut are specified as pancreatic and form a bud; during the secondary transition, the bud evolves to become a lobulated structure (Fig. 1Top) (7). The organogenesis process terminates when endocrine cells aggregate to form many sphere-like endocrine tissues, the islets of Langerhans, embedded within the exocrine pancreas. The pancreas develops simultaneously from a ventral site and a dorsal site; during organogenesis the ventral pancreas associates with the significantly larger dorsal pancreas.*
Fig. 1.
Pancreatic organogenesis. (Top) Illustration. (Middle) Histological images of the pancreas. (Bottom) Snapshots of the morphogenesis emerging from model.
Organogenesis depends on simultaneous interactions across different scales: Molecular and morphogenetic mechanisms act in concert to form an organ. The molecular mechanisms involve processes that regulate the differentiation and development of individual cells, whereas the morphogenic mechanisms gather the cells together to form a cauliflower-shaped organ. These processes do not occur independently but decisively affect each other. For example, the spatial location of a cell governs its molecular decisions, and, vice versa, the state of differentiation of a cell influences its spatial location (11, 12). Furthermore, studies have shown that mice lacking a normal extracellular matrix (ECM) around the developing pancreatic tissue fail to develop the organ. Thus, the ECM plays a crucial role in pancreatic organogenesis by generating signals that trigger intracellular processes, such as gene expression (13, 14). These intracellular processes govern cell function and cell migration.
An example of such a signaling process is pancreatic specification, which directs endodermal cells toward a pancreatic fate. Specification largely depends on 2 external signals from the notochord, activinβ and FGF2. These signals inhibit expression of proteins that repress the expression of the pancreatic marker, Pdx1 (15–18). Hence, an endodermal cell will not be specified as pancreatic unless it receives both signals from the notochord.
Results
Molecular Model Generates Histology.
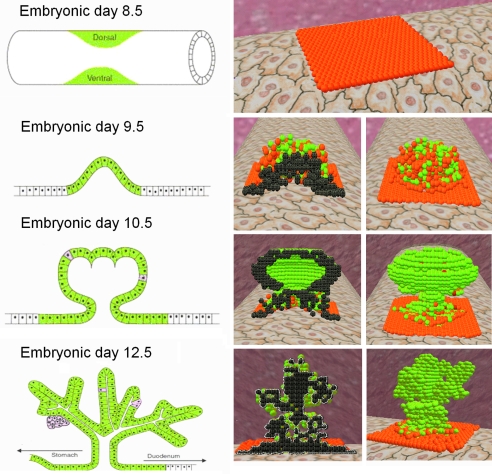
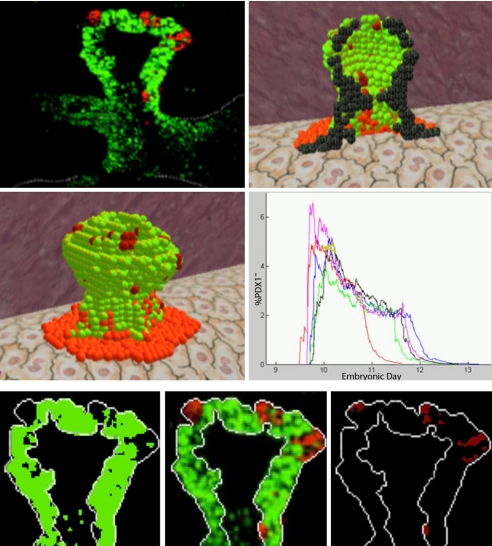
We tested the simulation by comparing the emerging structure against histological sections of the pancreas at different stages that correspond to the illustration (Fig. 1). We also compared the results to 2D illustration of pancreatic organogenesis (Fig. 2). Furthermore, we analyzed the simulation against a 2D histological image of pancreatic morphogenesis at the 10th embryonic day. The image provides a fluorescent cross-section of a pancreatic bud, in which Pdx1-positive cells are stained in green, whereas Pdx1-negative cells are labeled in red. We compared the image against the emerging structure and a cross-section image (Fig. 3Top) of the simulation, approximately at the same period. The simulation corresponds well with the histology, indicating that the 3D structure emerging from the simulation seems to capture pancreatic morphogenesis in the mouse. We also found visual similarity between the emerging structure and 3D histology of the pancreas (see ref. 19). The relevant clips are presented as Movie S1 and Movie S2 and information is available at http://research.microsoft.com/∼yakis/organogenesis.
Fig. 2.
Morphogenesis of the pancreas at 4 time points: Illustration (Left), a 2D cross-section of the simulated structure (Center), and the 3D emerging structure (Right).
Fig. 3.
Histological cross-section image vs. the simulation at embryonic day 10 (Top), the emerging Pdx1-negative red clusters and their analysis over time (Middle), and validation by using image-processing methods (Bottom).
The SI Text describes a test control which shows that the resemblance of the emerging in silico structure to the in vivo morphology depends on the specific molecular connection “rules” integrated into our model. See also Fig. S1.
Emergence of Primary Transition Clusters.
During the morphogenetic analysis, we noticed that the simulation, although never explicitly programmed to do so, exhibited clusters of pancreatic cells not expressing the key pancreatic gene Pdx1 but embedded deep in the epithelium of the pancreas. These clusters are reminiscent of a group of cells, termed primary transition cells, observed in vivo in the early pancreas. In vivo primary transition cells do not express Pdx1 but express hormones (often both insulin and glucagon). The in silico clusters aggregated at the top of the bud similarly to clusters of primary transition cells in vivo. Preliminary analysis revealed that early endocrine cells, like those in the simulation, do not express the pancreatic marker Pdx1 (7). Further study suggests that primary transition cells do not appear in the mature organ and probably migrate or undergo apoptosis (8, 20). For the sake of simplicity, we assumed that such cells die later in development and therefore do not appear in the mature organ.
Analyzing the model revealed that the Pdx1-negative pancreatic cells achieved a maximum at approximately day 10, when an average of ≈4% of the cells were Pdx1-negative (Fig. 3 Top). We then calculated the frequency of primary transition cells in vivo by analyzing images of the pancreatic buds stained for Pdx1 and glucagon and taken by using a confocal microscope (Fig. 3 Bottom). Interestingly, the frequency of primary transition cells in these embryos (≈6%) was similar to the observed frequency in the model.
The model suggests that the origin of this population is from cells that never expressed Pdx1 but were, rather, “trapped” in the budding epithelium. In vivo lineage-tracing experiments can provide a definitive test of this prediction. The model also shows that these clusters are formed by cells with a common ancestor and thus are a consequence of proliferation rather than aggregation. This prediction remains to be examined experimentally.
It is important to acknowledge that the modeling data do not prove that Pdx1-negative cell clusters are the in silico manifestation of primary transition cells. However, there are intriguing similarities between the 2 populations that beg this conclusion: In vivo and in silico cell populations appear at similar times during embryonic development and later disappear; both populations are Pdx1-negative; and the location of these cells, their overall frequency and their cluster size are also similar between in vivo and in silico populations.
Model Anticipates Experimental Findings.
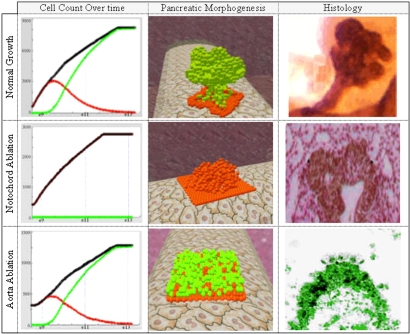
We further tested the model by reproducing ablation experiments in which the organism was engineered to lack certain tissues. To simulate such experiments, we disabled the function of relevant objects in the running simulation. Generally, our results captured the essence of similar in vivo experiments and provided a dynamic molecular and morphogenetic analysis (Fig. 4). When we disabled the notochord, the notochord-related factors, in particular FGF2 and activinβ, were not secreted to the ECM (i.e., the concentrations of these factors in the grid were below their thresholds). Because these factors regulate pancreatic specification, none of the cells were specified as pancreatic (i.e., the molecular mechanisms of specification were blocked). Interestingly, other morphogenetic processes were partly damaged; cells gathered to form the initial bud, but failed to develop the mature lobulated organ (Fig. 4 Middle). The results are consistent with similar in vivo experiments in which ablation of the notochord showed a bud that was not specified as pancreatic (15, 16). The histological 2D section (Fig. 4 Middle Right) shows the pancreatic bud that formed in a mouse lacking the notochord (H&E staining; adapted from ref. 21). As in the simulation, a branched bud was formed but was not specified as pancreatic (i.e., cells did not express the pancreatic marker Pdx1).
Fig. 4.
In silico ablation experiments: cell count over time (Left), the emerging 3D structure (Center), and histological images (Right). Red and green designate Pdx1− and Pdx1+ cells, and black designates the total.
In a similar experiment, the aorta was disabled and thus the concentrations of the BMP4 and FGF10 factors, which promote budding of pancreatic cells, were below their thresholds (14, 22). The results in this case showed that cells were specified normally as pancreatic, but failed to form the initial pancreatic bud (Fig. 4 Bottom). Furthermore, the cell population was reduced in size indicating that proliferation was partly damaged. The results concur with similar in vivo experiments that showed pancreatic cells that did not form a pancreatic bud. The 2D histological section image (Fig. 4 Bottom Right; adapted from ref. 22) displays the endodermal tissue that was specified as pancreatic but failed to form a bud (i.e., it expressed the pancreatic marker Pdx1 but did not form a structure).
Model Discloses Morphogenetic Behavior.
As mentioned above, pancreatic organogenesis is largely regulated by factors in the ECM that promote signaling in cells. Two factors, BMP4 and FGF10, promote pancreatic morphogenesis at the primary stages of the organogenesis (23, 24). BMP4 is the first to be expressed and promotes budding formation, whereas FGF10 is expressed later and promotes (among other things) patterning of the pancreatic bud (25). The tissues surrounding the pancreas regulate the concentrations of the mesenchymal factors (9, 14, 26). In our model, we defined areas in the extracellular space that contain different concentrations of these 2 factors. At run time, the concentrations are regulated by various objects, in particular by the aorta object, which also governs the blood vessels.
Theoretically, we may define infinitely many possible distributions of the factors in space, each described by an arrangement and a regulation effect (i.e., the way it promotes the factors in its vicinity) of blood vessels. Accordingly, the pancreatic structure, which emerged earlier, is described by a specific blood vessel layout and effect. In this section, we go beyond the simple ablation experiments discussed above and use the model to study pancreatic morphogenesis more generally by mutating the factors in the environment to extreme cases.
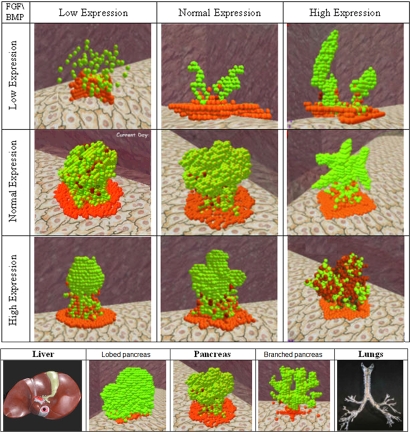
To study the role of the FGF10 and BMP4 factors on pancreatic morphogenesis, we mutated the blood vessels in space. At this stage, we preserved the layout of the arteries and mutated only their effect (i.e., the way they regulate BMP4 and FGF10 concentrations). We programmed the arteries to promote 3 different levels of expression for each factor—low, normal and high. Fig. 5Top displays snapshots of the simulation at equilibrium under the 9 possibilities. The results show that when the expression level of FGF10 was increased the morphogenesis tended toward a more branched structure. Likewise, when the expression level of BMP4 was increased the morphogenesis tended toward a more lobed structure. The extreme expression levels of the factors revealed an intensified impact of the factors when one was increased and the other was decreased. Decreasing FGF10 expression and increasing BMP4 expression led to a single lobe at the top of the pancreatic bud. Likewise, decreasing FGF10 expression and increasing BMP4 expression led to rather long finger-like structures. Interestingly, decreasing the expression of both factors led to a chaotic behavior of pancreatic cells and a loss of structure; whereas increasing both factors led to a hyperplastic morphogenesis and an enlarged Pdx1-negative population.
Fig. 5.
Pancreatic organogenesis under 3 levels of expression of BMP4 (vertical axis) and FGF10 (horizontal axis) (Upper) and different shapes of pancreatic morphogenesis (Lower).
In more advanced experiments, we mutated not only the effect of the blood vessels but also its positioning. Accordingly, we changed the layout of the blood vessels to promote different distributions of factors (i.e., FGF10 and BMP4) in the environment. The model revealed shapes that are different in nature from the genuine pancreatic structure. Initially, we defined condensed arteries, which promote a weak uniform expression of FGF10 and a strong concentrated expression of BMP4. Under these environmental conditions, the emerging structure was a massive lobed pancreas, somewhat similar to the shape of the liver (Fig. 5 Bottom Left). Furthermore, we defined a branched blood vessel layout that promoted a scattered expression of FGF10 and a uniform expression of BMP4. The emerging structure was highly branched, somewhat similar to the shape of the lungs (Fig. 5 Bottom Right). These results appear to describe how 2 independent and concurrent mechanisms generate the lobulated form by promoting behavior in individual cells. Interestingly, the aforementioned foregut organs, namely the liver and the lungs, are exposed to similar factors during their organogenesis (24, 27). These results suggest that blood vessels could play a role in branching morphogenesis of the embryonic pancreas, a prediction yet to be tested by in vivo experiments.
Discussion
The modeling of early pancreatic organogenesis described here suggests that it is useful to integrate experimental data into a running 4D simulation. 4D modeling can indeed provide a seamless and integrated view of a complex process that we usually analyze through piecemeal experimentation. The integration is illuminating:
Multiscale. Four dimensionality makes visually comprehensible the many scales of interaction that proceed concurrently—genetic, molecular, intracellular, intercellular, environmental, interorgan, and so forth.
Cross-scale. We see how organ structure and environment can determine molecular interactions and, vice versa, how molecular interactions can determine structure and environment.
Emergence. Four dimensionality discloses the emergence of new properties as the process unfolds across scales—molecular interactions lead to 3D organ structure.
Dynamics. Change with time, the essence of development, is visually perceptible.
It would appear that the 4D modeling is empowering as well as illuminating. Here, we demonstrate that we can carry out experiments in silico, which cannot replace “wet-lab” experimentation but can help direct the experimenter toward the more decisive experiment, saving time, resources, and animal manipulations.
Formulating and testing hypotheses, as we show here, are also feasible in 4D simulation. No less important, the very attempt to collect the data needed for a 4D model highlights missing data and directs our attention to key experimental questions that experimenters did not consider or did not believe worthwhile to ask; thus, modeling extends awareness.
During the last few years, increasing interdisciplinary work combines experimental results with theoretical models to explain the morphogenesis of different systems (see, e.g., refs. 28 and 29). Most of this work, unlike the present modeling, ignores multiple concurrent activities and focuses on a single mechanism in the system. The approach we used here integrates the piecemeal, static experimental data into a reactive model that is linked to a 3D animated front end for visualization and to a mathematical interface for analysis. As data accumulate, in particular data related to dynamic and morphogenetic aspects, the model may be further tested, calibrated, and extended.
In the case of pancreatic organogenesis, we started with a version of a “divide and conquer” concept, which is guided by decomposing a system into independent modules and reassembling them at run time. Accordingly, we defined 2 main modules, one specified the structural development based on sweeps-to-branched-skeleton algorithms, and the other formalized the molecular interactions in an individual cell (see ref. 30).
Although we found that this approach gave rise to some interesting ideas, it could not capture faithfully the process of organogenesis. As we continued to study the process, we advanced to the autonomous agent concept, which does not carry any artificial objects and thus seems more suitable for modeling biology. Accordingly, we defined a cell as an autonomous entity that senses the factors in its near environment and modeled the environment that surrounds the pancreas, which supplies important inducing signals. Pancreatic organogenesis, as it emerged from the model, qualitatively reproduced similar structure as in relevant histology; it starts from a flat sheet of cells and evolves to a lobed structure through budding and branching processes. Furthermore, the model anticipates in vivo observations, gives rise to intriguing ideas about pancreatic morphogenesis, and points to the possibility of analogous processes in morphogenesis in the liver and lungs.
We envision the future development of this work in 2 separate directions. First, coverage of the model must be extended to capture, among other things, the formation of the endocrine islets of Langerhans buried within the exocrine pancreas. We believe that in the long run, the pancreatic model may serve for carrying out in silico experiments that may lead to a better understanding of the pancreas and of pancreas-related diseases, such as diabetes. Second, the model may serve as a starting point for modeling organogenesis in other systems in biology, and it may help in the efforts to design an in silico organ or organism (see, e.g., refs. 1, 31, and 32). To this end, examination of the possibility of using the same approach to model the development of the C. elegans nematode, which is extensively used as a model organism in molecular and developmental biology, remains to be completed.
Methods
Modeling Technique.
To specify behavior of objects in the model, we use the language of statecharts (6), as it is implemented in the Rhapsody tool from I-Logix (acquired in 2006 by Telelogic, which, in turn, was recently acquired by IBM). Statecharts define behavior using a hierarchy of states with transitions, events, and conditions. The language can be compiled into executable code by using Rhapsody.
We linked the model to a 3D animated front end (in 3DGameStudio by Conitec Datasystems, Inc.), which visualizes the simulation and provides the means to interact with it. At run time, processes in the simulation are reflected in the front end in different ways, e.g., by color and position changes. Furthermore, the model is linked to a mathematical analysis (using Matlab) that displays various graphs and statistics of the simulation. A prerecorded run of the simulation is available at http://research.microsoft.com/yakis/runs.
The SI for this article contains 2 parts that provide details of the model. The SI Appendix details the biological elements that were included in the model, and the SI Text describes the statechart model of the cell in greater detail as well as the simulation at run time. See also Figs. S2–S13.
Modeling an Autonomous Cell.
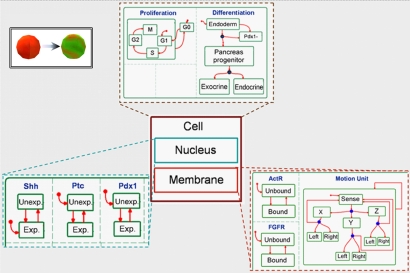
The behavior of the eukaryotic cell, which is the basic element of the model, is specified by using 3 distinct objects, namely the nucleus, membrane, and cell. The cell includes the specification of the different stages in the life cycle of the eukaryotic cell, and consists of the 2 other objects. The nucleus object specifies gene expression in a discrete fashion, whereas the membrane object specifies the response to external stimulations.
This setup is illustrated in Fig. 6, which shows the 3 objects and (parts of) their statecharts. The statechart of the cell object contains 2 concurrent components, specifying the proliferation and differentiation processes. The proliferation component defines a state for each stage of the cell cycle, whereas the differentiation component specifies a state for each developmental stage. The nucleus and the membrane objects are located inside the cell to indicate the (strong) composition relation among the 3 objects, i.e., that the nucleus and the membrane cannot exist without the cell containing them. The statechart for the nucleus specifies each gene as an independent component that can be either in an expressed state or an unexpressed state (denoted by Exp. and Unexp. in Fig. 6.). Fig. 6 shows the components of Sonic hedgehog (Shh), Patched (Ptc), and Pdx1, 3 of the genes involved in pancreatic organogenesis. Similarly, the statechart for the membrane specifies the cell's reactions to possible external stimulations. Two subcomponents within the membrane statechart in Fig. 6 specify the behavior of 2 receptors in the membrane, activin receptor, AcrR, and fibroblast growth factor receptor, FGFR. The receptors can either be in a Bound state or an Unbound state. The third component in the membrane statechart depicts the motion unit that continuously scans over the 6 possible directions to find the optimal move. The states themselves contain behavioral instructions for the cell. For example, in the membrane the state Bound of a receptor defines the specific genes it activates. Similarly, in the nucleus the expressed state contains instructions for genes to activate the expression of other genes. Which genes and which receptors affect which genes were specified according to data collected from the published literature on pancreas development. For example, inactivation of the SHH gene induces the expression of Ptc.
Fig. 6.
Modeling an autonomous cell. The 3 objects, cell, nucleus and membrane, accompanied by some of their statechart.
At the front end, the Cell is visualized as a sphere that changes properties to indicate molecular stages. For example, a red sphere denotes a cell in an endoderm state, whereas a green sphere denotes a cell in a pancreas progenitor state (Fig. 6 Top Left). This formalization defines the cell as a 3D animated autonomous entity that senses the environment and behaves accordingly.
Modeling the Extracellular Space.
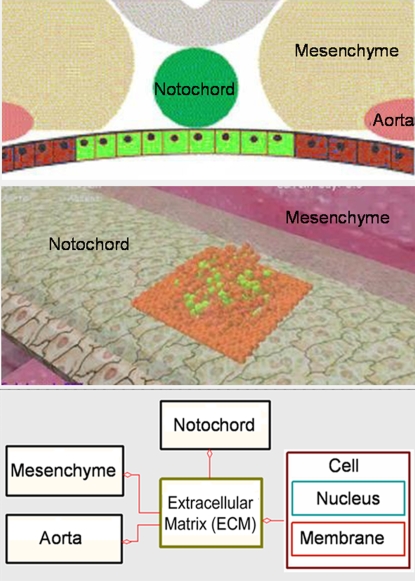
To model the extracellular space surrounding the pancreas, we defined an object representing the ECM, handling a 3D grid that overlays the pancreatic tissue. Accordingly, the space surrounding the organ is divided into 3D grid cubes with a fixed volume. The 3 tissues in the extracellular space—notochord, aorta, and mesenchyme—are defined as objects, and their behavior is specified based on what is recorded in the literature (see, e.g., refs. 7 and 11). These tissues are known to promote early stages of pancreatic development by secreting factors in the ECM. In the model, concentrations of relevant factors are stored in the ECM grid cubes and can be updated by the tissue objects (i.e., the notochord, aorta, and mesenchyme). For example, the notochord secretes several factors in the extracellular space, thus, in our model, the notochord object regulates concentrations of relevant factors in the ECM grid next to its specified location.
Based on the literature (e.g., Fig. 7Top) we designed an animated front end (Fig. 7 Middle) that visualizes the extracellular space in the model. Specifically, in the front-end, the mesenchyme is represented by a tissue-like space that changes its color when the aorta is present. A long tube, representing the endodermal gut, lies at the center of the ECM. The notochord, when it exists, is represented by a transparent green tube that lies above the gut. The behavior of the gut is outside the scope of the model and serves solely for visualization purposes.
Fig. 7.
Modeling the extracellular space. (Top) An illustration of the extracellular space. (Middle) The 3D animated front end. (Bottom) The interaction scheme between the objects.
The interaction scheme of the model is illustrated in Fig. 7 Bottom, where an interaction is feasible if a line connects 2 objects. For example, the notochord may interact with the ECM but cannot interact directly with the mesenchyme. To be faithful to the biology, we prevented direct interaction between tissues and cells. Nevertheless, cells indirectly interact with tissues when they sense concentrations of factors in the ECM that were previously produced by a tissue.
Supplementary Material
Acknowledgments.
We thank Avi Mayo for help in setting up the platform for modeling the extracellular environment and Judith Magenheim for providing histological images.† This work was supported in part by the John von Neumann Minerva Center for the Development of Reactive Systems and by a grant from the Kahn Fund for Systems Biology, both at the Weizmann Institute of Science. Part of D.H.'s work was carried out during a visit to the School of Informatics at the University of Edinburgh, Edinburgh, U.K. and was supported by a grant from the Engineering and Physical Research Council.
Footnotes
The authors declare no conflict of interest.
This article contains supporting information online at www.pnas.org/cgi/content/full/0808725105/DCSupplemental.
The current model focuses on the dorsal pancreatic development but can be extended to cover the similar process at the ventral tissue.
Data in Figs. 1 and 4 are reprinted from ref. 11 by permission of Macmillan Publishers Ltd. Data in Figs. 2 and 7 are reprinted from ref. 9 by permission of Elsevier. Data in Fig. 4 (21, 22) are reproduced with permission of the Company of Biologists. Data in Fig. 3 are reprinted from ref. 7 by permission of Wiley–Liss, Inc., a subsidiary of John Wiley & Sons, Inc.
References
- 1.Cohen IR, Harel D. Explaining a complex living system: Dynamics, multi-scaling and emergence. J R Soc Interface. 2007;4:175–182. doi: 10.1098/rsif.2006.0173. [DOI] [PMC free article] [PubMed] [Google Scholar]
- 2.Efroni S, Harel D, Cohen IR. Reactive animation: Realistic modeling of complex dynamic systems. IEEE Comput. 2005;38:38–47. [Google Scholar]
- 3.Efroni S, Harel D, Cohen IR. emergent dynamics of thymocyte development and lineage determination. PLoS Comput Biol. 2007;3:e13. doi: 10.1371/journal.pcbi.0030013. [DOI] [PMC free article] [PubMed] [Google Scholar]
- 4.Swerdlin N, Cohen IR, Harel D. The lymph node B cell immune response: Dynamic analysis in-silico. Proc IEEE special issue on Comput Syst Biol. 2008;96:1421–1443. [Google Scholar]
- 5.Harel D, Setty Y. Lecture Notes in Computer Science. Vol 5054. Cambridge, UK: Springer; 2008. Generic reactive animation: Realistic modeling of complex natural systems; pp. 1–16. [Google Scholar]
- 6.Harel D. Statecharts: A visual formalism for complex systems. Sci Comput Program. 1987;8:231–274. [Google Scholar]
- 7.Jensen J. Gene regulatory factors in pancreatic development. Dev Dyn. 2004;229:176–200. doi: 10.1002/dvdy.10460. [DOI] [PubMed] [Google Scholar]
- 8.Herrera PL. Adult insulin- and glucagon-producing cells differentiate from two independent cell lineages. Development. 2000;127:2317–2322. doi: 10.1242/dev.127.11.2317. [DOI] [PubMed] [Google Scholar]
- 9.Kim SK, MacDonald RJ. Signaling and transcriptional control of pancreatic organogenesis. Curr Opin Genet Dev. 2002;12:540–547. doi: 10.1016/s0959-437x(02)00338-6. [DOI] [PubMed] [Google Scholar]
- 10.Pictet RL, Clark WR, Williams RH, Rutter WJ. An ultrastructural analysis of the developing embryonic pancreas. Dev Biol. 1972;29:436–467. doi: 10.1016/0012-1606(72)90083-8. [DOI] [PubMed] [Google Scholar]
- 11.Edlund H. Pancreatic organogenesis—Developmental mechanisms and implications for therapy. Nat Rev Genet. 2002;3:524–532. doi: 10.1038/nrg841. [DOI] [PubMed] [Google Scholar]
- 12.Bort R, Zaret K. Paths to the pancreas. Nat Genet. 2002;32:85–86. doi: 10.1038/ng0902-85. [DOI] [PubMed] [Google Scholar]
- 13.Hogan KA, Bautch VL. Assembly and patterning of vertebrate blood vessels. Curr Top Dev Biol. 2004;62:55–85. doi: 10.1016/S0070-2153(04)62003-5. [DOI] [PubMed] [Google Scholar]
- 14.Lammert E, Cleaver O, Melton D. Induction of pancreatic differentiation by signals from blood vessels. Science. 2001;294:564–567. doi: 10.1126/science.1064344. [DOI] [PubMed] [Google Scholar]
- 15.Hebrok M, Kim SK, Melton DA. Notochord repression of endodermal sonic hedgehog permits pancreas development. Genes Dev. 1998;12:1705–1713. doi: 10.1101/gad.12.11.1705. [DOI] [PMC free article] [PubMed] [Google Scholar]
- 16.Apelqvist A, Ahlgren U, Edlund H. Sonic hedgehog directs specialised mesoderm differentiation in the intestine and pancreas. Curr Biol. 1997;7:801–804. doi: 10.1016/s0960-9822(06)00340-x. [DOI] [PubMed] [Google Scholar]
- 17.Jonsson J, Carlsson L, Edlund T, Edlund H. Insulin-promoter-factor 1 is required for pancreas development in mice. Nature. 1994;371:606–609. doi: 10.1038/371606a0. [DOI] [PubMed] [Google Scholar]
- 18.Offield MF, et al. PDX-1 is required for pancreatic outgrowth and differentiation of the rostral duodenum. Development. 1996;122:983–995. doi: 10.1242/dev.122.3.983. [DOI] [PubMed] [Google Scholar]
- 19.Jorgensen MC, et al. An illustrated review of early pancreas development in the mouse. Endocr Rev. 2007;28:685–705. doi: 10.1210/er.2007-0016. [DOI] [PubMed] [Google Scholar]
- 20.Herrera PL, Nepote V, Delacour A. Pancreatic cell lineage analyses in mice. Endocrine. 2002;19:267–278. doi: 10.1385/ENDO:19:3:267. [DOI] [PubMed] [Google Scholar]
- 21.Kim SK, Hebrok M, Melton DA. Notochord to endoderm signaling is required for pancreas development. Development. 1997;124:4243–4252. doi: 10.1242/dev.124.21.4243. [DOI] [PubMed] [Google Scholar]
- 22.Yoshitomi H, Zaret KS. Endothelial cell interactions initiate dorsal pancreas development by selectively inducing the transcription factor Ptf1a. Development. 2004;131:807–817. doi: 10.1242/dev.00960. [DOI] [PubMed] [Google Scholar]
- 23.Rossi JM, Dunn NR, Hogan BL, Zaret KS. Distinct mesodermal signals, including BMPs from the septum transversum mesenchyme, are required in combination for hepatogenesis from the endoderm. Genes Dev. 2001;15:1998–2009. doi: 10.1101/gad.904601. [DOI] [PMC free article] [PubMed] [Google Scholar]
- 24.Dong PD, et al. Fgf10 regulates hepatopancreatic ductal system patterning and differentiation. Nat Genet. 2007;39:397–402. doi: 10.1038/ng1961. [DOI] [PubMed] [Google Scholar]
- 25.Bhushan A, et al. Fgf10 is essential for maintaining the proliferative capacity of epithelial progenitor cells during early pancreatic organogenesis. Development. 2001;128:5109–5117. doi: 10.1242/dev.128.24.5109. [DOI] [PubMed] [Google Scholar]
- 26.Lammert E, Cleaver O, Melton D. Role of endothelial cells in early pancreas and liver development. Mech Dev. 2003;120:59–64. doi: 10.1016/s0925-4773(02)00332-5. [DOI] [PubMed] [Google Scholar]
- 27.Weaver M, Dunn NR, Hogan BL. Bmp4 and Fgf10 play opposing roles during lung bud morphogenesis. Development. 2000;127:2695–2704. doi: 10.1242/dev.127.12.2695. [DOI] [PubMed] [Google Scholar]
- 28.Gibson MC, Patel AB, Nagpal R, Perrimon N. The emergence of geometric order in proliferating metazoan epithelia. Nature. 2006;442:1038–1041. doi: 10.1038/nature05014. [DOI] [PubMed] [Google Scholar]
- 29.Nelson CM, Vanduijn MM, Inman JL, Fletcher DA, Bissell MJ. Tissue geometry determines sites of mammary branching morphogenesis in organotypic cultures. Science. 2006;314:298–300. doi: 10.1126/science.1131000. [DOI] [PMC free article] [PubMed] [Google Scholar]
- 30.Setty Y, Cohen IR, Mayo AE, Harel D. Algorithmic Bioprocesses. New York: Springer; 2009. on using divide and conquer in modeling natural systems. in press. [Google Scholar]
- 31.Noble D. The heart cell in silico: Successes, failures and prospects. Novartis Found Symp. 2002;247:182–194. discussion 194–187, 198–206, 244–152. [PubMed] [Google Scholar]
- 32.Harel D. A grand challenge for computing: Full reactive modeling of a multi-cellular animal. Bull Eur Assoc Theor Comput Sci. 2003;81:226–235. [Google Scholar]
Associated Data
This section collects any data citations, data availability statements, or supplementary materials included in this article.


