

Abstract
A combination of spectroscopy and DFT calculations has been used to define the geometric and electronic structure of the nitrite bound type 2 (T2) copper site at high and low pH in nitrite reductase from Rhodobacter sphaeroides. At high pH there is no electron transfer from reduced type 1 (T1) to the nitrite bound T2 copper, while protonation triggers T1 → T2 electron transfer and generation of NO. The DFT calculated reaction coordinate for the N-O bond cleavage in nitrite reduction by the reduced T2 copper suggests that the process is best described as proton transfer triggering electron transfer. Bidentate nitrite binding to copper is calculated to play a major role in activating the reductive cleavage of the nitrite bond through backbonding combined with stabilization of the −OH product by coordination to the Cu2+.
1. Introduction
Bacterial denitrification is a multi step process where nitrate is reduced to dinitrogen by prokaryotic organisms. Nitrite reductases (NiRs) catalyze the one electron reduction of nitrite to nitric oxide in the second step of bacterial denitrification.1,2 There are two types of known NiRs: the copper and the heme containing NiRs produced from the structural genes nirK and nirS, respectively. Heme containing NiRs are found in various denitrifying bacteria, including Pseudomonas aeruginosa, Paracoccus denitrificans, Paracoccus pantotropha, and Pseudomonas stutzeri.3 These are homodimeric enzymes (∼120 kDa) containing one heme c and one heme d1 site per subunit.4,5 The heme c accepts an electron from soluble cytochrome c551 or azurin and transfers it to heme d1 which is the site of nitrite reduction. Copper NiRs are 110 kDa homotrimeric enzymes. Each monomer contains a T1 copper (also called blue copper)6 center which is the electron transfer site ∼ 12.5 Å away from a “normal” T2 copper center which is the site of nitrite reduction.7 The T1 copper site is situated in a monomer subunit, while the T2 site is bound between two subunits. The T1 copper is ligated by two histidine imidazoles, a cysteine thiolate and a methionine thioether bond. The T2 center has a tetrahedral geometry with three histidines and a water derived ligand.8,9,10,11,12 The T1 is connected to the T2 center through a cys-his pathway for rapid electron transfer (Figure 1).
Figure 1.
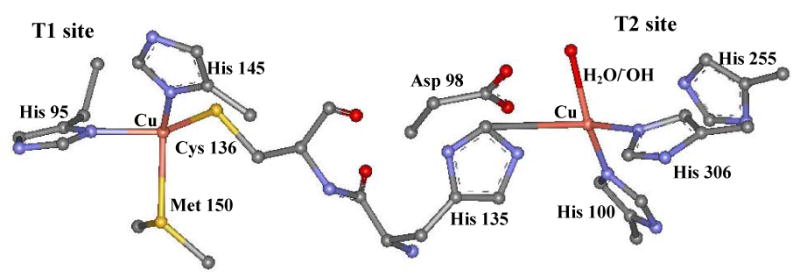
T1 and T2 copper sites of NiR (PDB ID: 2AFN)
High resolution crystallographic data are available for both the resting and nitrite bound forms of NiR.13,14,15,16,17 Regarding the mechanism of nitrite reduction, there is a debate as to whether nitrite first binds to the oxidized T2 center, after which an electron is transferred from the T1 to the T2 center, or if the T2 center is first reduced, followed by nitrite binding.2,3,9,10,18,19,20 There are crystallographic, ligand binding, electrochemical and kinetic data suggesting the possibility of both of the above routes.18,20,21 Steady state kinetic turnover experiments for nitrite reduction as a function of pH indicate the existence of two pKas, where the lower pKa (∼5) has been invoked as the protonation equilibrium of an Asp residue and the higher pKa (∼7) has been ascribed as the pKa of a His residue.22 Pulsed radiolysis experiments for electron transfer from the T1 to the nitrite bound T2 site as a function of pH also show similar behavior.23,24
We have recently shown that the T1 site can be selectively reduced when nitrite is bound to the T2 site at high pH.25 In the present study we use a combination of absorption, MCD, X and Q band EPR spectroscopies along with DFT calculations to characterize this active site which is not obscured by the dominant spectral features of the T1 copper. We then study the effect of pH on the substrate bound T2 copper using EPR and resonance Raman spectroscopies. DFT calculations are used to analyze these results and elucidate the nature of the pH effect. pH perturbation studies further show that protonation triggers electron transfer from the T1 to the T2 site which is key for reactivity. Reaction coordination calculations evaluate the pathway for the N-O bond cleavage reaction. Different modes of nitrite binding to the T2 copper active site have been evaluated. These studies define key geometric and electronic structural features required for the activation of nitrite for the reductive cleavage of its NO bond.
2. Experimental Methods
Materials
All reagents were of the highest grade commercially available and were used without further purification. RsNIR was isolated and purified (pH∼7.2) as previously reported.22,26 Glassed samples for MCD experiments were prepared by adding 50% (v/v) buffer/glycerol-(O-d)3. Addition of glycerol had no effect on the EPR spectra of the enzymes. Concentrations of samples used for spectroscopy were ∼0.5mM. For the T1 reduced nitrite bound samples, one equivalent of nitrite was added to the enzyme, followed by anaerobic reduction with ascorbate which reduces the T1 Cu (pH 7.5-8.2) in a nitrogen glove box. NADH with phenazine methosulfate could also be used in the place of ascorbate. For the pH drop experiments, the same sample preparation was used and excess reductant was removed by buffer exchange, followed by dropping the pH to a buffered solution (twice the enzyme volume and buffer strength) of pH 5 such the final pH is ∼5.6. For the detection of NO, this pH dropped low pH solution was added to reduced myoglobin solution and Fe2+-NO myoglobin formation was monitored using absorption spectroscopy. Oxidized nitrite bound samples were prepared by adding 2-4 fold excess nitrite to the enzyme.
Spectroscopic Studies
Low-temperature absorption spectroscopy was performed on a double beam spectrophotometer (Cary 500) using a liquid helium cryostat (Janis Research Super Vari-Temp). MCD data were collected on CD spectro-polarimeters (JASCO J810 with a S20 PM tube for the UV/Vis region, and J200 with an InSb detector for the near-IR region) with sample compartments modified to accommodate magnetocryostats (Oxford Instruments, SM4-7T). EPR spectra were obtained using a Bruker EMX spectrometer, ER 041 XG microwave bridge, and ER 4102ST cavity. All X band samples were run at 77 K in a liquid nitrogen finger dewar. A Cu standard (1.0 mM CuSO4.5H2O with 2 mM HCl and 2 M NaClO4) was used for spin quantitation of the EPR spectra. Q band spectra were obtained at 77 K using an ER 051 QR microwave bridge, an ER 5106QT resonator, and an Oxford continuous flow CF935 cryostat. EPR spectra were baseline-corrected and simulated using XSophe (Bruker). For a given enzyme, X and Q band EPR spectra were simultaneously fit in order to constrain the simulation parameters (g values were obtained from Q band and hyperfine couplings from X band EPR spectra). Raman spectra were obtained using a series of lines from Kr+ (Coherent 190CK) and Ar+ (Coherent Sabre 25/7) ion lasers with incident power ranging from 10 to 50 mW in an ∼135° backscattering configuration. Scattered light was dispersed through a triple monochromator (Spex 1877 CP, with 1200, 1800, and 2400 groove/mm gratings) and detected with a back-illuminated CCD camera (Princeton Instruments ST-135). Samples contained in NMR tubes were immersed in a liquid nitrogen finger dewar. Background spectra of charcoal in the same NMR tube were subtracted to remove the quartz scattering.
Computational Details
All calculations were performed using Gaussian 03 revision C02.27 The B3LYP functional was employed for both geometry optimization and single point calculations.28, 29 For Cu, N, O atoms 6-311g* basis set was used and a 6-31g* basis set was used for C and H atoms. Single point calculations were performed using a 6-311+g* basis set on all atoms. For solvent correction a PCM model with an ε =4.0 was applied.30 The stability of the wavefunction was tested using the “stable” key word. The spin densities were calculated using the Mulliken population analysis and the coefficients were calculated using PYMOLYZE.31,32 The computational model derived from the crystal structure of the resting (pdb id: 1AS7) and the nitrite bound (pdb id: 1AS6, 1AS8) NiR included the three co-ordinated histidine residues and three second sphere residues, aspartate 98, histidine 255 and isoleucine 257 (Figure 2). Additionally two H2O molecules were included, one that H-bonds to both asp 98 and his 255 and another that H-bonds to the exchangeable ligand. The terminal methyl carbons of individual amino acid residues were frozen in the models. The potential energy surfaces were calculated with full geometry optimizations. For every N-O distance, three points were calculated, where a proton was shifted from the aspartate to the nitrite. Single point calculations were performed on these optimized geometries to obtain energies, while ensuring appropriate spin polarization of the ground state wavefunction.
Figure 2.

Computational model for nitrite bound NiR active site with second sphere residues (residue numbers from PDB id: 1AS6).
3. Results and Analysis
3.1. Spectroscopy
3.1.1. High pH
The absorption and MCD spectra of the T1 reduced nitrite bound T2 NiR are shown in Figure 3. In contrast to the intense T1 copper features, all the T2 Cu2+ absorption features are relatively weak. The absorption and MCD spectra were simultaneously fit to the minimum number of resolvable transitions (Table 1). The four lowest energy bands (1-4) are assigned as d→d transitions as these are intense in MCD but relatively weak in absorption.
Figure 3.

Low temperature solution data A) absorption spectrum, 10K B) MCD spectrum of T1 reduced nitrite bound (T1 Cu+, T2 Cu2+-NO2-) NiR at pH 7.5. The Gaussian-resolved bands obtained from a simultaneous fit of the absorption and MCD spectra are shown by dashed lines.
Table 1.
Gaussian resolved peak positions for absorption and MCD spectra of T1 reduced nitrite bound (T1 Cu+, T2 Cu2+-NO2-) NiR, pH 7.5
| Band | Energy (cm-1) |
Assignment | C/D |
|---|---|---|---|
| 1 | 8539 | dz2 | - |
| 2 | 10315 | dxy | - |
| 3 | 12649 | dxz/dyz | 0.062 |
| 4 | 14050 | dxz/dyz | -0.208 |
| 5 | 15459 | His CT | -0.050 |
| 6 | 17542 | oop NO2- CT | -0.030 |
| 7 | 20647 | His+NO2- CT | 0.008 |
| 8 | 22366 | His+NO2- CT | 0.009 |
| 9 | 24641 | His+NO2- CT | -0.005 |
| 10 | 26697 | His+NO2- CT | -0.002 |
Bands 3 and 4 show a pseudo-A term in the MCD spectrum (i.e. derivative shaped, oppositely signed C term transitions) and are characteristic of the dxz and dyz transitions (to the dx2-y2 half occupied valence orbital, vide infra) which have effective spin-orbit coupling. Bands 1 and 2 are assigned as dz2 and dxy transitions respectively, based on the signs of the MCD spectrum.33 The ligand field splitting pattern implies a square pyramidal geometry of the nitrite bound T2 site, consistent with the reported crystal structure.34,35 The higher energy bands are NO2- and His to Cu2+ CT transitions; these will be assigned with the help of TD-DFT calculations in Section 3.2.1.3.
Figure 4 shows the Q and X band EPR spectra of T1 reduced nitrite bound NiR. The g values of the enzyme have been extracted from Q band EPR data, which show that the active site has a rhombic EPR signal with gz = 2.30 > gy = 2.155 > gx = 2.03 > 2.00 reflecting some dz2 mixing into a dominating dx2-y2 ground state. The g values are higher than those observed in most tetragonal Cu2+ complexes. The g and A values are presented in Table 2.
Figure 4.

EPR spectra (bold lines) and simulations (dotted lines) at 77K A) Q band B) X band of T1 reduced nitrite bound (T1 Cu2+, T2 Cu2+-NO2-) NiR at pH 7.5. a denotes residual T1 signal.
Table 2.
EPR parameters of T1 reduced nitrite bound NiR, pH 7.5
| gz | gy | gx | Az | Ay | Ax (×10-4 cm-1) | |
|---|---|---|---|---|---|---|
| T2-NO2- | 2.30 | 2.155 | 2.03 | 120 | 60 | 25 |
3.1.2. Low pH
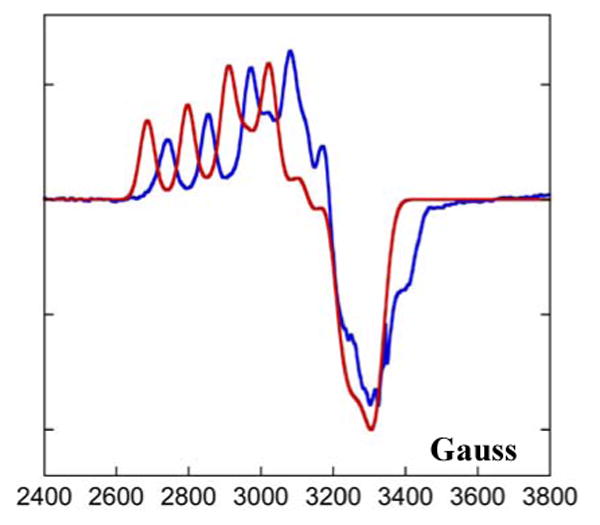
The EPR signal of the nitrite bound form of the enzyme (T1 Cu2+ + T2 Cu2+-NO2-) shows a pH effect. There is a distinct change in the EPR spectrum of the enzyme from pH 8.2 to pH 5.5 (Figure 5A), especially in the low field region, which is characteristic of the lowest hyperfine features of the T2 g// region (Figure 5B). Since electron transfer occurs from the reduced T1 to the nitrite bound oxidized T2 form at low pH (T1 Cu+ → T2 Cu2+-NO2-, vide infra), the nitrite bound T2 Cu2+ had to be studied in the presence of the oxidized T1 site.
Figure 5.

Overlay of the X band EPR spectra of oxidized nitrite bound NiR (T1 Cu2+, T2 Cu2+-NO2-) at pH 8.2 (blue) and pH 5.5 (red) obtained at 77K: A) complete spectrum B) blow-up.
The EPR spectrum of oxidized nitrite bound NiR has features from both the T1 as well as the T2 Cu center. To isolate whether the pH effect of the nitrite bound form was due to the perturbation of the T2 site or the T1 site or both, resonance Raman spectroscopy was used. The T1 copper center has well characterized signature peaks in the resonance Raman spectrum. The resonance Raman spectra taken on the T1 site of the nitrite bound NiR at high and low pH (Figure 6) clearly demonstrate that the T1 site is not significantly perturbed upon lowering the pH. Hence the pH effect in the EPR spectra of nitrite bound NiR is due to perturbation of the T2 site. The pKa of this effect is 6.4 (Figure S1).
Figure 6.

Overlay of the Resonance Raman spectra of oxidized nitrite bound NiR (T1 Cu2+, T2 Cu2+-NO2-) at pH 8.2 (blue) and pH 5.5 (red) excited at 458 and obtained at 77K.
In order to extract the change in the EPR parameters of the nitrite bound T2 Cu2+ with pH, Q and X band EPR data (Figure 7, Table 3) were simultaneously fit where the T1 contribution was obtained from the high pH EPR data of the type 2 depleted (T2D) derivative (see reference 36 and Figure S2 for details). The sum of this and the nitrite bound T2 with T1 reduced reproduced the nitrite bound high pH spectrum. The T1 EPR parameters in the T2D derivative were not significantly perturbed with pH. The resultant low pH nitrite bound T2 site EPR spectrum (simulated) is compared to the high pH nitrite bound T2 spectrum (experimental data) in Figure 8. The most significant difference in the high and low pH EPR spectra is the shift of the g// value from 2.30 to 2.345 on going from high to low pH. The gx and gy also shift to slightly higher values with lowering pH. The A values do not have a significant change with pH.
Figure 7.

EPR spectra (bold lines) and simulations (dotted lines) of oxidized nitrite bound NiR (T1 Cu2+, T2 Cu2+-NO2-) at 77K A) Q band, pH 8.2 B) X band, pH 8.2 C) Q band, pH 5.5 D) X band pH 5.5.
Table 3.
EPR parameters of T1 and nitrite bound T2 (T1 Cu2+, T2 Cu2+-NO2-) centers of NiR, pH 8.2 and 5.5
| Nitrite bound NiR, pH 8.2 | Nitrite bound NiR, pH 5.5 | ||
|---|---|---|---|
| T1 | gx | 2.03 | 2.03 |
| gy | 2.05 | 2.05 | |
| gz | 2.19 | 2.19 | |
| Ax | 40 | 40 | |
| Ay | 0 | 0 | |
| Az | 67 | 67 | |
| T2 | gx | 2.03 | 2.04 |
| gy | 2.155 | 2.162 | |
| gz | 2.30 | 2.345 | |
| Ax | 25 | 25 | |
| Ay | 60 | 70 | |
| Az | 120 | 120 | |
Figure 8.
EPR spectra of T1 reduced nitrite bound form (T1 Cu+, T2 Cu2+-NO2-), pH 8.2 (blue) and generated spectra of T1 reduced nitrite bound form from simulation, pH 5.5 (red).
3.1.3. Ligand Field Analysis
From ligand field theory, the metal hyperfine coupling is given by:
| Equation 1a |
| Equation 1b |
where, Pd[Cu2+] = 400 × 10-4 cm-1, κ [Cu2+] = 0.43 and g⊥ = (gx + gy)/2. This results in a calculated β2 = 0.64 (β2 reflects the covalency, i.e. the percentage Cu 3d character in the singly occupied molecular orbital) at high pH. Also from ligand field theory, the g// value of a Cu2+ site is inversely proportional to the dxy to dx2-y2 transition energy (Equation 2), thus a relatively low energy dxy excited state could contribute to the high g// value observed for the nitrite bound T2 site of NiR. Taking D4h CuCl42- as a reference, as it has 63% Cu character in the ground state similar to that observed experimentally for NiR (β2 = 0.64), the g// value of the nitrite bound T2 site could be estimated from the relative energies of the dxy to dx2-y2 transition (Equation 2). Δg// is the deviation of g// from the spin-only value (2.0023), and Exy is the dxy to dx2-y2 transition energy (for D4h CuCl42-,g// ∼ 2.22, Exy = 12500 cm-1). The Exy for NiR from abs/MCD is 10320 cm-1 (Table 1), which gives g// ∼ 2.27 which is reasonably close to that experimentally observed value of 2.30 (Table 2, 3).
| Equation 2 |
The other interesting spectroscopic feature of the ground state of this site is its rhombic splitting of g⊥. Using a ground state wavefunction with some dz2 mixing into a dominantly dx2-y2 orbital produces a significant rhombic splitting of g⊥. The experimental Δg⊥ is reproduced with 7% dz2 mixing as shown in the Supporting Information.
There is a significant increase in the g// value (g// = 2.345) in going to the low pH form. From equation 2 this reflects a weaker ligand field at low pH, which is consistent with TD-DFT calculations (vide infra). Using the experimental g values of the nitrite bound T2 form at low pH (Table 3), the lack of change in the experimental A values is calculated (equation 1) to reflect a decrease in the covalency of the site (β2 = 0.68) on lowering the pH.
In summary the NO2- bound T2 copper active site shows a pH effect in its spectroscopic properties with a pKa of 6.4. There are three ionizable residues that are possible candidates for this pH effect: the highly conserved aspartate (directly H-bonded to the axial ligand), histidine residues or the substrate NO2- itself. All the three possibilities have been proposed in literature and will be evaluated below using DFT calculations.
3.2. Computational
In this section a computational model of the active site at high pH is developed by comparing geometric and spectroscopic parameters to the DFT calculations. This will then be extended to develop a low pH model consistent with the experimental data.
3.2.1. High pH
The computational models tested for the high pH form are shown in Scheme 1A, B. Aside from the three coordinated imidazoles and nitrite, some second sphere residues were included that are required to reproduce the geometric properties of the active site and may be important for reactivity; an aspartate H-bonded to the exchangeable ligand which is H-bonded to a histidine residue via a water molecule. An isoleucine residue, that has been identified to be important for reactivity, has been included as well.
Scheme 1.
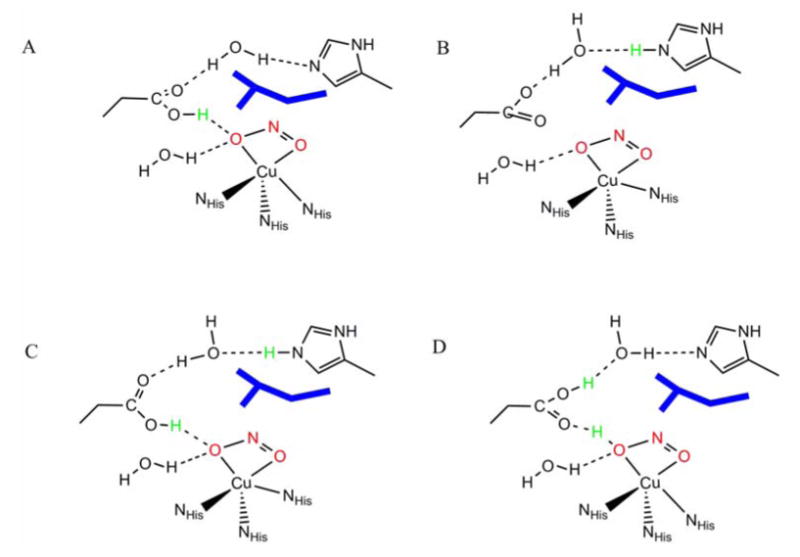
Selected computational models used to test the high pH forms: A) protonated aspartic acid, deprotonated histidine and nitrite B) protonated histidine, deprotonated aspartic acid and nitrite: low pH forms C) protonated histidine and aspartic acid and deprotonated nitrite D) protonated aspartic acid and nitrite, deprotonated histidine. In blue is the isoleucine residue. See Scheme S1 for a complete list of models tested.
3.2.1.1. Geometry Optimization
As discussed in section 3.1, the pH >7 active site could have either protonated aspartic acid or histidine (Scheme 1, A and B). Both of these models were evaluated and the results are presented below. There are some significant differences between the optimized structures of A and B, in particular, in the co-ordination environment of Cu2+ (Table 1). Although, the nitrite is bidentate in both cases, A has significantly longer Cu-O distances (2.17 and 2.22 Å) than B (2.03 and 2.09 Å). This primarily reflects the strong H-bonding interaction between the aspartic acid and the nitrite ligand in A. This weakening of Cu-NO2- bonding in A is compensated by the stronger Cu-NHis interaction as indicated by shorter Cu-NHis bond lengths in A (Table 4). Also worth noting is that the two O's of NO2- ligand and two histidine N's are in the same plane (Figure 9C, blue) with a histidine axial ligand in model B providing a square pyramidal environment around Cu. The NO2- is significantly displaced off this plane in A, again due to the H-bonding interaction with the aspartic acid (Figure 9C, green). These distortions create considerable differences in the ground state wavefunctions of these models.
Table 4.
Geometric parameters of the models of the active site at high pH (Models A, B) and low pH (Models C, D).
| NO2- | Histidine | Cu-HAsp | ||||
|---|---|---|---|---|---|---|
| O1 | O2 | N1 | N2 | N3 | ||
| X-tal (pdb id: 1AS6) | 2.18 | 2.29 | 1.93 | 2.05 | 2.15 | |
| Model A: aspH, his, NO2- | 2.17 | 2.22 | 1.99 | 2.08 | 2.01 | 2.99 |
| Model B: asp, hisH, NO2- | 2.03 | 2.09 | 1.97 | 2.00 | 2.23 | |
| Model C: aspH, hisH, NO2- | 2.02 | 2.13 | 1.96 | 1.98 | 2.24 | 2.89 |
| Model D: aspH, his, HNO2 | 2.30 | 2.80 | 1.94 | 1.93 | 2.00 | 2.61 |
Figure 9.

Optimized geometries of A) model A, B) model B and C) overlay of models A (green) and B (blue).
3.2.1.2. Ground State Wavefunction
The ground state wavefunction for model A shows 0.67 spin density on the Cu (Table 5, Figure 10) which is a little higher than the value, 0.64, derived from the EPR parameters in section 3.1. The Cu d-orbital involved in the β LUMO (Figure 10, left) is primarily dz2. The spin density on Cu calculated in model B is 0.65 which is in better agreement with the experimental value, and this structure has a dx2-y2 ground state with ∼5% dz2 mixing. Due to H-bonding to the nitrite from the aspartic acid in model A, the Cu-O bonds are longer relative to model B where this carboxylate is deprotonated and cannot H-bond. This causes a reduction of the covalency of the Cu-NO2- bond in model A relative to model B (Table 5). The lower spin density on nitrite in A is compensated by the higher spin density on Cu and on the histidine nitrogens. Model A has comparable Cu-NHis distances that lead to comparable spin densities on the three histidine nitrogens. This is in disagreement with 15N ENDOR data that indicates two strongly coupled and one weakly coupled nitrogen.22 Alternatively, there are two short and one long Cu-NHis bonds in model B and this leads to two strongly coupled N and one weakly coupled N, consistent with 15N ENDOR.
Table 5.
Spin densities of the models of the active site at high pH (Models A, B) and low pH (Models C, D).
| Cu | NO2- | Histidine | ||||
|---|---|---|---|---|---|---|
| O1 | O2 | N1 | N2 | N3 | ||
| Model A: AspH, his, NO2- | 0.67 | 0.09 | 0.005 | 0.07 | 0.11 | 0.04 |
| Model B: asp, hisH, NO2- | 0.65 | 0.10 | 0.06 | 0.10 | 0.09 | 0.00 |
| Model C: aspH, hisH, NO2 | 0.67 | 0.09 | 0.07 | 0.08 | 0.10 | 0.00 |
| Model D: aspH, his, HNO2 | 0.62 | 0.02 | 0.10 | 0.08 | 0.08 | 0.00 |
Figure 10.
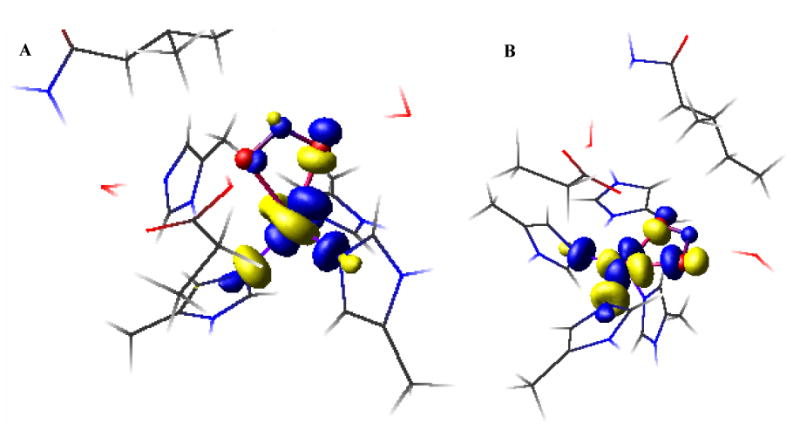
β LUMO of models A (left) and B (right). The Cu and NO2- are indicated as balls and the rest are indicated as sticks for clarity.
3.2.1.3. TD-DFT
TD-DFT calculations on both high pH models A and B indicate some significant differences. While model A had excitation energies indicative of a trigonal bipyramidal ligand field (i.e. dz2> dx2-y2 ∼ dxy> dxz ∼ dyz) model B has a distorted square pyramidal ligand field (i.e. dx2-y2> dz2 > dxy> dxz> dyz) (Table 6, Figure S3). The stronger equatorial field in model B, due to the strong NO2- ligand and two shorter histidine nitrogens in the Cu-O-O plane, leads to higher energy d→d transitions. Model A shows a series of LMCT transitions starting from 14500 cm-1. The lower energy ones are mainly His→Cu CT with some in-plane (ip) NO2- mixed in, followed by out of plane (oop) NO2-→Cu CT transitions.37 These transitions are shifted to higher energies in model B due to its increased ligand field (energies and assignments in Table 6). Overall the TD-DFT results on model B agree better with the experimental transitions observed for the high pH form.
Table 6.
TD-DFT calculated energies and assignments of transitions for the models of the active site at high pH (Models A, B) and low pH (Models C, vide infra).
| Model A | Model B | Model C (low pH) | |||
|---|---|---|---|---|---|
| Energy (cm-1) |
Assignment | Energy (cm-1) |
Assignment | Energy (cm-1) |
Assignment |
| 6900 | dx2-y2 | 8200 | dz2 | 6700 | dz2 |
| 7700 | dxy | 14100 | dxy | 11200 | dxy |
| 12000 | dxz | 14500 | dxz | 13400 | dxz |
| 13100 | dyz | 15800 | dyz | 14200 | dyz |
| 14500 | His CT | 18400 | His CT | 16900 | His CT |
| 15400 | i-p NO2- + His CT | 20200 | oo-p NO2- CT | 17400 | His CT |
| 16300 | i-p NO2- + His CT | 21500 | oo-p NO2- + His CT | 19100 | oo-p NO2- + His CT |
| 16900 | oo-p NO2- + His CT | 21700 | oo-p NO2- + His CT | 19600 | oo-p NO2- |
| 18100 | oo-p NO2- CT | 21900 | oo-p NO2- + His CT | 21300 | oo-p NO2- + His CT |
| 21000 | His CT | 21400 | oo-p NO2- + His CT | ||
In summary based on the ground state wavefunction, ligand field description and TD-DFT results, model B fits the experimental data better. Thus an active site with deprotonated aspartic acid and protonated distal imidazole models well the high-pH form of the NO2- bound T2 copper in NiR.
3.2.2 Low pH
Two computational models were considered for the low pH form of the nitrite bound active site: 1) both the aspartate and the histidine ligands are protonated and nitrite is bound as NO2- (Scheme 1, C) and 2) the aspartate is protonated and nitrite is bound as HNO2 (Scheme 1, D). Structure D has very long Cu-O bond lengths (2.3 and 2.8 Å) relative to structure C (2.02, 2.13 Å) indicating that the nitrite is effectively dissociated from the T2 site when protonated. The long Cu-O bond lengths in D are inconsistent with the Cu-O bond lengths observed crystallographically in the low pH nitrite bound structures. Model C on the other hand shows good agreement with the crystal structure (Figure 11A, Tables 4, 5).
Figure 11.

Optimized geometries of: A) low pH model C and B) overlay of high pH model B (blue) and low pH model C (red). Green dotted line shows H-bond between nitrite O and asp H at low pH C) The β LUMO of the low-pH model C: Cu (67%), NO2- (15%) and NHis (21%).
The wavefunction for model C show that it has a dx2-y2 hole (Figure 11) with 67% Cu, 15% NO2- (oxygen) and 21% histidine (nitrogens). The small increase of spin density on Cu relative to model B (i.e. high pH model) is consistent with the EPR parameters and reflects a weaker ligand field at low pH. The TD-DFT calculated ligand field for model C (Table 6, Figure S3) shows a general decrease of d→d and CT transition energies relative to the high pH model B. The weakened ligand field can be correlated to the experimentally observed shifts in the EPR g values. The experimentally observed d→d transitions for the high pH nitrite bound form (Table 1) were shifted as given by the TD-DFT calculated energy shifts in table 6 to estimate the d→d energies for the low pH nitrite bound form which could not be obtained experimentally due to overlapping intense absorption features of the T1 site. This 2900 cm-1 shift in the dxy transition energy (Table 6, model B to C) due to protonation of the aspartate in the low pH model C predicts the dxy transition to be at 7415 cm-1 for the low-pH NO2- bound form. Using equation 2 the predicted g// is 2.37, which is in general agreement with the increase of g// to 2.345 observed experimentally. Thus the protonation equilibrium of this highly conserved aspartate residue appears to be responsible for the pH effect observed in the nitrite bound form of NiR (Figure 11B). The functional role of protonation/deprotonation of this highly conserved 2nd sphere residue is investigated both experimentally and theoretically below.
3.3. pH Drop Experiment
When the T1 reduced nitrite bound T2 NiR at pH 8.2 is injected into a two fold excess of pH 5 buffer, to a final pH of 5.6, a green color is immediately observed, reflecting the appearance of an oxidized T1 site.6 When this reaction was monitored by absorption spectroscopy, the characteristic T1 CT bands at 600 nm and 460 nm appeared on dropping the pH from 8.2 to 5.6 (Figure 12A, red →green). Thus the T1 site is oxidized in the process. The EPR spectrum of this resulting species shows the characteristic hyperfine features of the resting T1 and T2 sites (Figure 12B, green) thus nitrite is no longer bound to the T2 site. Spin integration shows a two fold increase in paramagnetic species after the pH drop (the high pH form had <5% T1 and >95% T2-NO2-, the low pH form had >90% T1 and >90% resting T2). A parallel pH drop experiment with the T1 oxidized and T2 nitrite bound shows no dissociation of nitrite at low pH. The EPR and the absorption data for the final species after the pH drop of the T1 reduced nitrite bound T2 form indicate that both the T1 and the T2 sites are oxidized. 89% NO was in fact detected after the pH drop experiment (by reduced myoglobin, Figure S4) demonstrating the reduction of nitrite to NO. Thus, protonation of the aspartate residue (as suggested from the DFT calculations) triggers the transfer of one electron from the T1 site to the nitrite bound T2 site, leading to enzyme turn over and formation of the resting wild type form with release of NO.
Figure 12.

A) Room temperature absorption spectra of oxidized nitrite bound NiR, pH 8.2 (blue), which was reduced to form the T1 reduced nitrite bound form (red), followed by pH drop to 5 (green, corrected for concentration) B) X band EPR spectra of oxidized nitrite bound NiR, pH 8.2 (blue), which was reduced to form the T1 reduced nitrite bound form (red), followed by pH drop to 5 (green), overlaid with resting WT (black), at 77 K.
3.4. Reaction Coordinate Calculations
The pH drop experiment described above shows that the reduced nitrite bound T2 site at low pH is the active form involved in enzymatic turnover. To obtain the geometry of this form, the spectroscopically calibrated low pH nitrite bound oxidized T2 site was reduced by one electron and then geometry was optimized. The resultant structure (Figure 13) shows that: a) the proton on the aspartic acid in the oxidized structure is still retained,38 b) the Cu-O bond-lengths have elongated to 2.3 Å in the reduced structure relative to 2.1 Å in the oxidized site and c) the Cu-NHis distances are not significantly affected. A comparison of the calculated ionization energies for this low pH nitrite bound form and the high pH reduced form (i.e. with a deprotonated aspartatic acid residue) shows that the ionization energy changes from +70 mV to -1032 mV, respectively. This implies that the protonation of the aspartic acid residue raises the reduction potential of the nitrite bound T2 site by ∼1100 mV which facilitates electron transfer from the reduced T1 site.
Figure 13.

A) Optimized structure of the reduced low pH form: Cu-O1 = 2.30, 2.26, Cu-NHis = 2.00, 2.01, 2.10, N-O = 1.28, 1.26 B) Crystal structure of the cryogenically reduced NiR: Cu-O1 = 2.48, 2.24, Cu-NHis = 1.89, 2.03, 2.13.
A two dimensional potential energy surface of the low pH nitrite bound form was calculated for the reduction of nitrite by Cu+ (Figure 14). One coordinate (front to rear on right) is cleavage of N-O bond and the other coordinate (front to rear on left) is proton transfer from aspartate to oxygen of nitrite. Therefore the reaction proceeds from the reactant in the front to the product at the diagonal rear. The lowest energy point on the surface, the reactant, is indicated by a red circle. This is the structure described above. The trajectory indicated by the red arrow gives a path where the N-O bond is cleaved without proton transfer to the nitrite. This path is extremely endothermic due to lack of stabilization of the Cu2+-O2- species formed along the reaction co-ordinate. A favorable pathway is indicated by the white line. This pathway involves a proton transfer from the aspartic acid residue to the bound nitrite followed by N-O bond cleavage. It is important to note that a proton transfer does not lead to spontaneous HO-NO bond cleavage. This reaction is calculated to be 16 kcal/mol endothermic, without an additional barrier i.e. the calculated ΔE± for this reaction is 16 kcal/mol. This calculated ΔE± agrees well with the experimental ΔE± of ∼15 kcal/mol.22
Figure 14.

Two dimensional potential energy surface for the N-O bond cleavage of nitrite reduction.
Frontier molecular orbitals (FMO) along the reaction co-ordinate were evaluated to develop a mechanism for the activation of nitrite for N-O bond cleavage by proton transfer along the left of the coordinate. HNO2 has a LUMO which is NO-OH π* in nature and is mainly localized on the NO unit (Figure S5). The HO-NO σ* orbital is quite high in energy and needs to be populated along the reaction coordinate for HO-NO bond cleavage. In the Cu+ HNO2 bound form (point on PES after the proton transfer, Figure 14) there is no backbonding from the Cu+ into the HO-NO antibonding orbitals (Figure S6). However along the reaction coordinate, as the HO-NO bond is elongated, the σ* orbital is lowered in energy and becomes mixed with the dx2-y2 HOMO (Figure 15 A, B and Figure S7) of the reduced Cu+ center. This mixing of the occupied Cu+ d-orbital leads to transfer of charge density from Cu+ to the bound HNO2 (i.e. backbonding). This leads to a Cu2+-OH and a NO. The NO then dissociates from the active site. Note that the σ* FMO involved has overlap of the dx2-y2 orbital with both the oxygens of HNO2. This is the key factor in lowering the barrier of HO-NO bond cleavage by efficient configurational interaction (CI) between the donor (Cu d) and the acceptor (HNO2σ*) orbitals and is discussed below.
Figure 15.
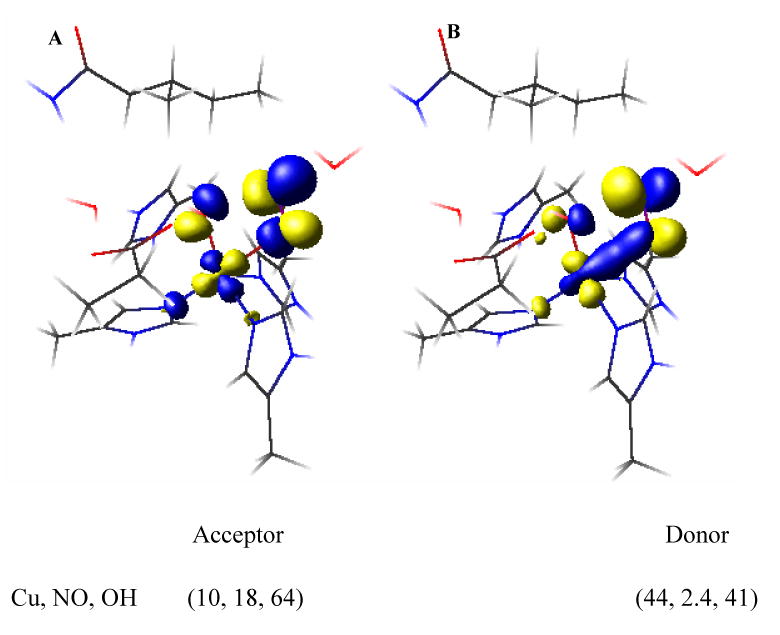
The acceptor NO-OH σ* (unoccupied) orbital on HNO2 (left) and the donor Cu dx2-y2 (occupied) orbital (right). % composition indicated below the respective structures.
4. Discussion
Spectroscopy combined with DFT modeling indicate that at high pH nitrite is bound to the T2 with a deprotonated aspartic acid residue and a protonated histidine residue in the pocket. At low pH, the data and DFT calculations are consistent with protonation of the aspartate residue near the copper. The pH drop experiment provides direct evidence that the nitrite bound oxidized T2 is reduced by the reduced T1 center when a proton is provided. Resonance Raman spectra on the T1 site indicate that it is not perturbed by change in pH.
Experimentally, at high pH, the T1 site can be selectively reduced when nitrite is bound to the oxidized T2 site. So the reduction potential of the T2 site must be lower by at least 120 mV relative to the T1 site (reduction potential of T1 site of Rs NiR39 = 247 mV). However, at low pH, there is complete electron transfer from the reduced T1 site to the nitrite bound T2 site, indicating that the reduction potential of the nitrite bound T2 site is now 120 mV higher than the T1 site, (which is unperturbed with pH as indicated by resonance Raman data). Thus, lowering the pH raises the reduction potential of the nitrite bound T2 site by more than 240 mV. Calculated ionization energies for the high pH and low pH structures indicate that the protonation of the aspartate electrostatically increases the reduction potential of the T2 site and drives the electron transfer to reduce nitrite at the T2 center, consistent with experimental observations.
The calculations on the Cu+-NO2- are consistent with a proton transfer from the aspartate residue to the NO2- followed by an electron transfer from the reduced copper to the nitrite to generate NO. The protonation of the nitrite and further elongation of the HO-NO bond along the reaction coordinate bring the HO-NO σ* orbital down in energy which facilitates back bonding from the occupied dx2-y2 orbital into this unoccupied HO-NO σ* orbital (see Fig. 15). This configurational interaction (CI) between these orbitals leads to an electron transfer from Cu+ to HNO2 resulting in the formation of Cu2+ and NO as indicated by the spin polarization between the fragments (Figure 16). This step is endothermic by 16 kcal/mol without any additional barrier, in reasonable agreement with the experimental ΔE± of 15 kcal/mol reported in the literature.22 The alternative pathway, i.e. reductive cleavage of the NO bond followed by the proton transfer is > 50 kcal/mol. This barrier is significantly higher because, in the absence of an H+, the charge density developing on the O2- of NO2- along O-NO- cleavage is not stabilized.
Figure 16.

Mulliken spin densities on Cu-OH and NO fragments along the reaction coordinate. The increasing spin density indicates charge transfer from the dx2-y2 orbital of Cu+ to the HO-NO σ* of the bound HNO2. These points represent the beginning, middle and end of the NO-OH coordinate.
Note that in Figure 15, the contours indicate that both the oxygen atoms of NO2- are involved in this CI leading to charge transfer from Cu+ to NO2-. This raises a possible role of the bidentate coordination of nitrite. Oxidized Cu2+ binds NO2- in a bidentate manner with both the oxygens coordinated to copper. However, in absence of any 2nd sphere residue Cu+ binds HNO2 (as well as NO2-) via the nitrogen (η1κN, Figure 17B). Attempts of binding HNO2 via O or OH computationally led to dissociation of this ligand. In the protein active site, the nitrite is bound bidentate η2 because of the presence of the hydrophobic isoleucine residue on top of the NO2- binding site (Figure 17A).40,41 The role of this unique mode of binding has been evaluated by comparing the HO-NO reductive cleavage energy of HNO2 bound η1κN and η1κO(H) with the η2 binding mode observed in the protein active site (Figure 17). The η1κN surface is much higher in energy, (∼50 kcal/mol), relative to the 16 kcal/mol for the native η2 coordination. This is because the −OH formed along the reaction coordinate is not stabilized by bonding with Cu2+. Note that, recent analog studies of the T2 site revealed that the NO2- bind Cu+ η1κN (as observed in our DFT calculations without the isoleucine residue) and the rate of NO formation was very slow even in presence of strong acid.42 This is consistent with the high barrier of the η1κN surface evaluated here. For the η1κO(H) structure, the OH is already bound to the T2 copper and hence the -OH should be stabilized along the reaction coordinate. However, although the total reaction energy is 16 kcal/mol comparable to the η2 model, there is a barrier of 26 kcal/mol in this case. FMO analyses reveals that backbonding into the HO-NO σ* orbital from Cu in the η1κO(H) bound mode is significantly less than that in the η2 bound mode. In fact the amount of backbonding from Cu+ to HO-ON σ* orbital at 2.30 Å (the highest point on the η2κO(H) surface) is equivalent to the extent of backbonding at 1.98 Å in the η2 HNO2 surface. The larger barrier on the η1κO(H) surface arises from lack of efficient CI between the donor Cu dx2-y2 orbital and the acceptor HO-NO σ* orbital. Thus the bidentate coordination of the HNO2 plays a key role in the reaction mechanism by allowing good CI between the Cu+ and both oxygens of the HNO2 that enables facile backbonding and thus electron transfer. This lowers the activation barrier for HO-NO cleavage by 10 kcal/mol and simultaneously stabilizes the −OH generated during this reaction coordinate reducing the reaction barrier by 34 kcal/mol.
Figure 17.
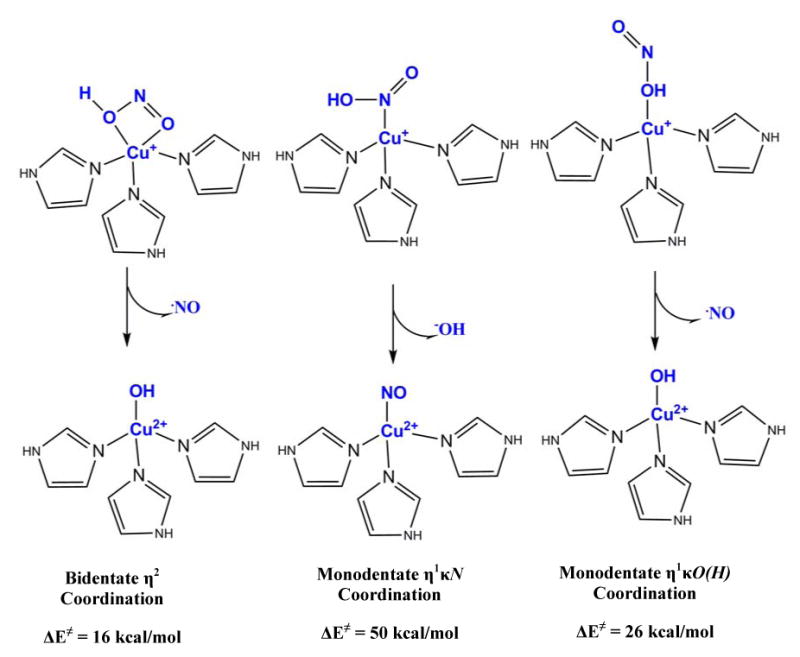
The different modes of HNO2 binding evaluated A) η2 bidentate B) η1κN and C) η1κO(H).
In summary proton transfer to nitrite enhances the reductive cleavage of the N-O bond of η2 bound nitrite Cu+. This involves efficient backbonding into the σ* along the reaction coordinate that weakens the N-O bond and stabilizes the -OH by binding to the Cu2+ and not the product NO which is easily released.
Supplementary Material
EPR spectra at various pHs for pKa determination, dz2 mixing from g⊥, X and Q band EPR data with simulations for the T2D form, absorption spectra of Fe2+-NO myoblobin (for NO detection), π* LUMO of nitrite bound to reduced T2 site, table with calculated geometric parameters and spin densities of different nitrite bound models, TD-DFT calculated spectra and assignments for models A, B and C, MO diagram of HNO2, CI between Cu and HO-NO σ* orbitals along the reaction coordinate, optimized coordinates and complete reference 27 are available free of charge from http://pubs.acs.org
Acknowledgments
This research was supported by NIH Grant DK-31450 (E.I.S.) and NIH EB00326929 (C.P.S). S.G is grateful for the William S. Johnson fellowship.
References
- 1.Zumft WG. Microbiol Mol Biol Rev. 1997;61:533. doi: 10.1128/mmbr.61.4.533-616.1997. [DOI] [PMC free article] [PubMed] [Google Scholar]
- 2.Averill BA. Chem. 1996;96:2951. doi: 10.1021/cr950056p. [DOI] [PubMed] [Google Scholar]
- 3.Wasser IM, de Vries S, Moeenne-Loccoz P, Schroeder I, Karlin KD. Chem Rev. 2002;102:1201. doi: 10.1021/cr0006627. [DOI] [PubMed] [Google Scholar]
- 4.Fulop V, Moir JW, Ferguson SJ, Hajdu J. Cell. 1995;81:369. doi: 10.1016/0092-8674(95)90390-9. [DOI] [PubMed] [Google Scholar]
- 5.Nurizzo D, Silvestrini M, Mathieu M, Cutruzzola F, Bourgeois D, Fulop V, Hajdu J, Brunori M, Tegoni M, Cambillau C. Structure. 1997;5:1157. doi: 10.1016/s0969-2126(97)00267-0. [DOI] [PubMed] [Google Scholar]
- 6.However in some NiRs these are green sites due to a tetragonal distortion of the bonds which changes the charge transfer from π to σ.
- 7.Suzuki S, Kataoka K, Yamaguchi K, Inoue T, Kai Y. Coord Chem Rev. 1999;190:245. [Google Scholar]
- 8.Godden JW, Turley S, Teller DC, Adman ET, Liu MY, Payne WJ, LeGall J. Science. 1991;253:438. doi: 10.1126/science.1862344. [DOI] [PubMed] [Google Scholar]
- 9.Adman ET, Godden JW, Turley S. J Biol Chem. 1995;270:27458. doi: 10.1074/jbc.270.46.27458. [DOI] [PubMed] [Google Scholar]
- 10.Murphy MEP, Turley S, Adman ET. J Biol Chem. 1997;272:28455. doi: 10.1074/jbc.272.45.28455. [DOI] [PubMed] [Google Scholar]
- 11.Dodd FE, Hasnain SS, Abraham ZHL, Eady RR, Smith BE. Acta Crystallogr. 1997;D53:406. doi: 10.1107/S0907444997002667. [DOI] [PubMed] [Google Scholar]
- 12.Dodd FE, Van Beeumen J, Eady RR, Hasnain SS. J Mol Biol. 1998;282:369. doi: 10.1006/jmbi.1998.2007. [DOI] [PubMed] [Google Scholar]
- 13.Antonyuk SV, Strange RW, Sawers G, Eady RR, Hasnain SS. Proc Nat Acad Sci. 2005;102:12041. doi: 10.1073/pnas.0504207102. [DOI] [PMC free article] [PubMed] [Google Scholar]
- 14.Ellis MJ, Prudencio M, Dodd FE, Strange RW, Sawers G, Eady RR, Hasnain SS. J Mol Biol. 2002;316:51. doi: 10.1006/jmbi.2001.5304. [DOI] [PubMed] [Google Scholar]
- 15.Jacobson F, Pistorius A, Farkas D, De Grip W, Hansson O, Sjoelin L, Neutze R. J Biol Chem. 2007;282:6347. doi: 10.1074/jbc.M605746200. [DOI] [PubMed] [Google Scholar]
- 16.Kukimoto M, Nishiyama M, Murphy MEP, Turley S, Adman ET, Horinouchi S, Beppu T. Biochem. 1994;33:5246. doi: 10.1021/bi00183a030. [DOI] [PubMed] [Google Scholar]
- 17.Nojiri M, Xie Y, Inoue T, Yamamoto T, Matsumura H, Kataoka K, Deligeer, Yamaguchi K, Kai Y, Suzuki S. Proc Nat Acad Sci. 2007;104:4315. doi: 10.1073/pnas.0609195104. [DOI] [PMC free article] [PubMed] [Google Scholar]
- 18.Strange RW, Murphy LM, Dodd FE, Abraham ZH, Eady RR, Smith BE, Hasnain SS. J Mol Biol. 1999;287:1001. doi: 10.1006/jmbi.1999.2648. [DOI] [PubMed] [Google Scholar]
- 19.Wijma HJ, Jeuken LJC, Verbeet MP, Armstrong FA, Canters GW. J Biol Chem. 2006;281:16340. doi: 10.1074/jbc.M601610200. [DOI] [PubMed] [Google Scholar]
- 20.Wijma HJ, Jeuken LJC, Verbeet MP, Armstrong FA, Canters GW. J Am Chem Soc. 2007;129:8557. doi: 10.1021/ja071274q. [DOI] [PubMed] [Google Scholar]
- 21.Hough MA, Antonyuk SV, Strange RW, Eady RR, Hasnain SS. J Mol Biol. 2008;378:353. doi: 10.1016/j.jmb.2008.01.097. [DOI] [PubMed] [Google Scholar]
- 22.Zhao Y, Lukoyanov DA, Toropov YV, Wu K, Shapleigh JP, Scholes CP. Biochem. 2002;41:7464. doi: 10.1021/bi0256274. [DOI] [PubMed] [Google Scholar]
- 23.Suzuki S, Kataoka K, Yamaguchi K. Acc Chem Res. 2000;33:728. doi: 10.1021/ar9900257. [DOI] [PubMed] [Google Scholar]
- 24.Kobayashi K, Tagawa S, Deligeer, Suzuki S. J Biochem. 1999;126:408. doi: 10.1093/oxfordjournals.jbchem.a022465. [DOI] [PubMed] [Google Scholar]
- 25.Ghosh S, Dey A, Usov OM, Sun Y, Grigoryants VM, Scholes CP, Solomon EI. J Am Chem Soc. 2007;129:10310. doi: 10.1021/ja072841c. [DOI] [PMC free article] [PubMed] [Google Scholar]
- 26.Veselov A, Zhao Y, Wang Y, Danner B, Scholes CP, Shapleigh JP. Biochem. 1998;37:6086. doi: 10.1021/bi971603z. [DOI] [PubMed] [Google Scholar]
- 27.Frisch MJ, et al. Gaussian 03, Revision C 02. [Google Scholar]
- 28.Becke AD. J Chem Phys. 1993;98:5648. [Google Scholar]
- 29.Lee C, Yang W, Parr RG. Phys Rev B. 1988;37:785. doi: 10.1103/physrevb.37.785. [DOI] [PubMed] [Google Scholar]
- 30.Miertus S, Scrocco E, Tomasi J. Chem Phys. 1981;55:117–129. [Google Scholar]
- 31.Mulliken RS. J Chem Phys. 1955;23:1833–1840. [Google Scholar]
- 32.Tenderholt AL. PyMOlyze Version 1.1. http://pymolyze.sourceforge.net.
- 33.Gewirth AA, Solomon EI. J Am Chem Soc. 1988;110:3811. [Google Scholar]
- 34.Note that the ligand field around Cu2+ is different form those of the structurally characterized Cu2+- NO2- model complexes.35
- 35.Lehnert N, Cornelissen U, Neese F, Ono T, Noguchi Y, Okamoto K, Fujisawa K. Inorg Chem. 2007;46:3916. doi: 10.1021/ic0619355. [DOI] [PubMed] [Google Scholar]
- 36.Basumallick L, Szilagyi RK, Zhao Y, Shapleigh JP, Scholes CP, Solomon EI. J Am Chem Soc. 2003;125:14784. doi: 10.1021/ja037232t. [DOI] [PubMed] [Google Scholar]
- 37.These CT transitions are at lower energy than those reported in Ref. 35 because the π2 donor orbital of imidazole is higher in energy than those of pyrazole (i.e. lower energy CT transition) as shown by Randall et. al. ( Randall RW, George SD, Hedman B, Hodgson KO, Fujisawa K, Solomon EI. J Am Chem Soc. 2000;122:11620.) Also note that the NO2- π CT transition is present in NiR and not in the model complexes due to differences in the Cu ground state wavefunction which allows NO2- π mixing into the SOMO in NiR but not the model complexes.
- 38.Note that the reduction of the T2 Cu increases the proton affinity of the aspartate residue by 25 kcal/mol both in the presence and absence of nitrite. This is because the decreased positive charge on the copper favors the protonation of the negatively charged aspartate residue.
- 39.Olesen K, Veselov A, Zhao Y, Wang Y, Danner B, Scholes CP, Shapleigh JP. Biochem. 1998;37:6086. doi: 10.1021/bi971603z. [DOI] [PubMed] [Google Scholar]
- 40.Boulanger MJ, Murphy MEP. Protein Sci. 2003;12:248. doi: 10.1110/ps.0224503. [DOI] [PMC free article] [PubMed] [Google Scholar]
- 41.Tocheva EI, Eltis LD, Murphy MEP. Biochem. 2008;47:4452. doi: 10.1021/bi7020537. [DOI] [PubMed] [Google Scholar]
- 42.Kujime M, Izumi C, Tomura M, Hada M, Fujii H. J Am Chem Soc. 2008;130:6088. doi: 10.1021/ja075575b. [DOI] [PubMed] [Google Scholar]
Associated Data
This section collects any data citations, data availability statements, or supplementary materials included in this article.
Supplementary Materials
EPR spectra at various pHs for pKa determination, dz2 mixing from g⊥, X and Q band EPR data with simulations for the T2D form, absorption spectra of Fe2+-NO myoblobin (for NO detection), π* LUMO of nitrite bound to reduced T2 site, table with calculated geometric parameters and spin densities of different nitrite bound models, TD-DFT calculated spectra and assignments for models A, B and C, MO diagram of HNO2, CI between Cu and HO-NO σ* orbitals along the reaction coordinate, optimized coordinates and complete reference 27 are available free of charge from http://pubs.acs.org