

Abstract
During an inspiration the output of hypoglossal (XII) motoneurons (HMs) in vitro is characterized by synchronous oscillatory firing in the 20 to 40 Hz range. In order to maintain synchronicity it is important that the cells fire with high reliability and precision. It is not known whether the intrinsic properties of HMs are tuned to maintain synchronicity when stimulated with time-varying inputs. We intracellularly recorded from HMs in an in vitro brainstem slice preparation from juvenile mice. Cells were held at or near spike threshold and were stimulated with steady or swept (ZAP) sine wave current functions (10 s duration; 0-40 Hz range). Peri-stimulus time histograms (PSTHs) were constructed from spike times based on threshold crossings. Synaptic transmission was suppressed by including blockers of GABAergic, glycinergic and glutamatergic neurotransmission in the bath solution. Cells responded to sine wave stimulation with bursts of action potentials at low (<3-5 Hz) sine wave frequency while they phase-locked 1:1 to the stimulus at intermediate frequencies (3-25 Hz). Beyond the 1:1 frequency range cells were able to phase-lock to sub-harmonics (1:2, 1:3 or 1:4) of the input frequency. The 1:1 phase-locking range increased with increasing stimulus amplitude and membrane depolarization. Reliability and spike timing precision was highest when the cells phase-locked 1:1 to the stimulus.
Our findings suggests that the coding of time-varying inspiratory synaptic inputs by individual HMs is most reliable and precise at frequencies that are generally lower than the frequency of the synchronous inspiratory oscillatory activity recorded from the XII nerve.
Keywords: respiration, motoneuron, patch-clamp
Introduction
Respiratory motoneurons that are active during inspiration are driven by synaptic inputs that is characterized by a depolarizing envelope on top of which oscillatory amplitude fluctuations occur (reviewed by Funk and Parkis 2002). Hypoglossal motoneurons (HMs) receive inspiratory-phase-related synaptic input and their output in the postnatal mouse in vitro is characterized by inspiratory-phase synchronous oscillatory firing recorded from the hypoglossal (XII) nerve that is in the 20 to 40 Hz range (Sebe et al. 2006). The function of these short time-scale synchronous oscillations remains unclear, but they have been shown to increase the output firing rate of phrenic motoneurons and to increase spike timing precision (Parkis et al. 2003). In general, synchronous oscillatory firing depends on an intricate interplay between synaptic excitation and inhibition, electrical coupling and intrinsic membrane properties (reviewed by Sejnowski and Paulsen 2006). It is not known whether the intrinsic properties of HMs are tuned to maintain synchronicity. It has been shown previously that rodent HMs fire regular trains of action potentials when stimulated with DC depolarizing current inputs (Sawczuk et al. 1995; Viana et al. 1995). Common synaptic inputs can synchronize HM output, and the optimum stimulus depends on the number and size of EPSPs and level of background activity (Turker and Powers 2002). A prerequisite for synchronization to occur is that the temporal precision of spike generation is sufficiently high and that action potential timing is reliable (reviewed by Sejnowski and Paulsen 2006).
When stimulated with time-varying inputs most neurons studied so far are characterized by a range of input amplitudes and frequencies where firing reliability is highest (Fellous et al. 2001; Hunter et al. 1998; Hunter and Milton 2003). This property of neurons has been called firing resonance. It is not known whether HMs show firing resonance and, if so, how this resonance firing frequency is related to the dominant frequency of the inspiratory-phase synaptic drive.
In order to address these questions we intracellularly recorded from HMs in an in vitro brainstem slice preparation from the juvenile mouse. We recorded HM firing patterns in response to injected steady and swept (ZAP) sine wave current functions. Our data showed that HM firing reliability and spike-timing precision depends on the amplitude and/or frequency of the sine wave input. We found that reliability and precision are highest for intermediate amplitude stimuli and frequencies where the cells phase-locked to the stimulus. The consequences of these findings for maintenance of synchronous firing among HMs during inspiration are discussed.
Methods
Experimental procedures
In vitro experiments were performed on non-rhythmically active medullary slice preparations from Swiss–Webster mice (P10–P16). Mice were anesthetized with isoflurane and killed by decapitation in accordance with the regulations of the University of Washington Institutional Animal Care and Use Committee (IACUC). The brain stem was removed and 300-μm transverse slices containing the hypoglossal motor nucleus were cut. Slices were incubated for 1 h at 37°C before recording. For intracellular recordings slices were transferred to a perfusion chamber mounted on the stage of an upright Zeiss microscope (Axoscope) equipped with infrared DIC optics. The perfusion solution (1-2 ml/min) contained (in mM): 119 NaCl, 2.5 KCl, 1.3 MgSO4, 1 NaH2PO4, 26.2 NaHCO3, 11 d-glucose, and 2.5 CaCl2, gassed with 95% O2-5% CO2 to maintain a pH of 7.4. The temperature in the chamber was maintained at 32±1 ° C. In order to reduce background synaptic noise, all recordings were done in the presence of blockers of AMPA-mediated glutamatergic (DNQX; 10 μM), GABAergic (SR 95531; 0.5μM) and glycinergic (strychnine; 1 μM) synaptic transmission.
To assess the firing resonance properties of neurons it was essential that stable recordings could be maintained for long periods of time to permit examination of responses to repeated stimuli under a range of experimental conditions. We used two different patch solutions to maximize recording stability based on either K-gluconate (Kgluc) or K methylsulphate (Kmeth). The composition of the Kmeth solution was (in mM): 150 K-methylsulphate, 2 HEPES, 2 Mg-ATP, 0.1 K-EGTA and 15 mM creatine (Chung et al. 1998). The composition of the Kgluc solution was (in mM): 115 K-gluconate, 25 KCl, 1 MgCl2, 9 NaCl, 10 HEPES, 3 K2-ATP, 1 Na-ATP and 0.2 K-EGTA. The pH of both solutions was adjusted to 7.3 with KOH. For whole-cell patch recordings electrodes were pulled from thin-walled borosilicate glass to a resistance of 3-5 MΩ.
The location of the hypoglossal motor nucleus (nucleus XII) was determined as described in previous publications from this laboratory (Bayliss et al., 1992, Viana et al., 1993). The densely-packed multipolar cells that together form the XII nucleus were identified under high power using infrared DIC optics. These cells could be easily distinguished from neurons in the adjacent dorsal motor nucleus of the vagus by their large cell bodies and their ability to fire repetitively in response to depolarizing current pulses. To confirm this cell identification process, several cells were stained intracellularly with biocytin (data not shown). Electrodes were advanced onto visually- identified HM neurons, using positive pressure and after formation of a gigaohm seal the cell membrane was ruptured by applying brief suction to the patch.
In order to avoid intracellular dialysis of the cell with the internal patch solution we also recorded a subset of neurons with ‘sharp’ microelectrodes. Intracellular recording microelectrodes were pulled from thick-walled borosilicate glass to a final resistance of 40-80 MΩ. First, under visual guidance, the electrodes were placed on the surface of the slice over the hypoglossal motor nucleus, and gradually advanced into the slice using a micromanipulator (Sutter Instruments). We continuously monitored bridge balance while the electrodes were advanced by injecting a 5 ms hyperpolarizing current pulse into the electrode. Upon an increase in electrode resistance we attempted to gain access to the cell interior by briefly ringing the electrode capacitance using the ’buzz’ control of the amplifier (Axoclamp 2A). We did not find any systematic differences between the firing properties or stability of cells recorded with either patch solution or with sharp or whole-cell patch based techniques (data not shown), and results form all three recording techniques were therefore pooled in this study. We checked for changes in firing pattern over time by repeating the same stimulus at the beginning and end of each trial. We also checked the firing rate in response to DC depolarization at regular intervals during the experimental protocol. We aborted or excluded any recordings where significant changes occurred in firing responses over time.
Analysis of spike firing resonance
Cells were driven by computer-generated sinusoidal current injections using the external command input of an intracellular amplifier (Axoclamp 2A) operating in bridge mode through the use of the Clampex 8 software program (Axon Instruments). The same electrode was used for membrane voltage recording and current injections. Sine wave current injections were superimposed on a DC offset current whose magnitude was adjusted such that the membrane potential of the recorded HM cell was near or at spike threshold. At this membrane potential most neurons fired spontaneously at a low rate. Use of the DC current offset allowed us to employ relatively small amplitudes for sine wave current injections (<0.6 nA). In pilot experiments we found that large-amplitude stimuli were detrimental to the long-term stability of the cells. In HMs current injections of this magnitude typically give rise to membrane potential fluctuations between 5 and 30 mV (see Fig. 1). We stimulated the cells with either steady sine wave currents (10 s duration) whose frequency was varied stepwise between 2 and 20 Hz or sinusoidal currents of slowly and linearly varying frequency (ZAP functions). The ZAP current stimulus is described by: I(t) = Io*sin [2πf(t)*t], with f(t) = fo + (fm − fo) * (t/T). The time-dependent frequency of the current, f(t), was increased from fo = 0 Hz to fm = 20 Hz (2 Hz/s) or from fo = 10 Hz to fm = 40 Hz (3 Hz/s) over a total time period of T=10 s. In some cells we also tested the reversed protocol (reverse ZAP) where frequency was varied from 20 to 0 or 40 to 10 Hz. Each sine wave or ZAP function was repeated at least twice. Firing responses in 15 s long digitized data files, including the 10 second period of sine wave stimulation, were digitized at 2 kHz (Clampex) and detected with an amplitude window discriminator, using Neuromatic software (Jason Rothman) written for Igor Pro Wavemetrics). Detection threshold was set along the upstroke of the action potential at about 20 mV below spike peak and the time at which the spike occurred was stored with a precision of 500 μs. In addition, in all cells we also injected with short (5 ms) and long (1000 ms) DC current pulses in order to characterize action potential characteristics and firing properties at resting membrane potential, respectively. These recordings were digitized at 20 kHz and analyzed using Clampex/Clampfit (Axon Instruments).
Figure 1.
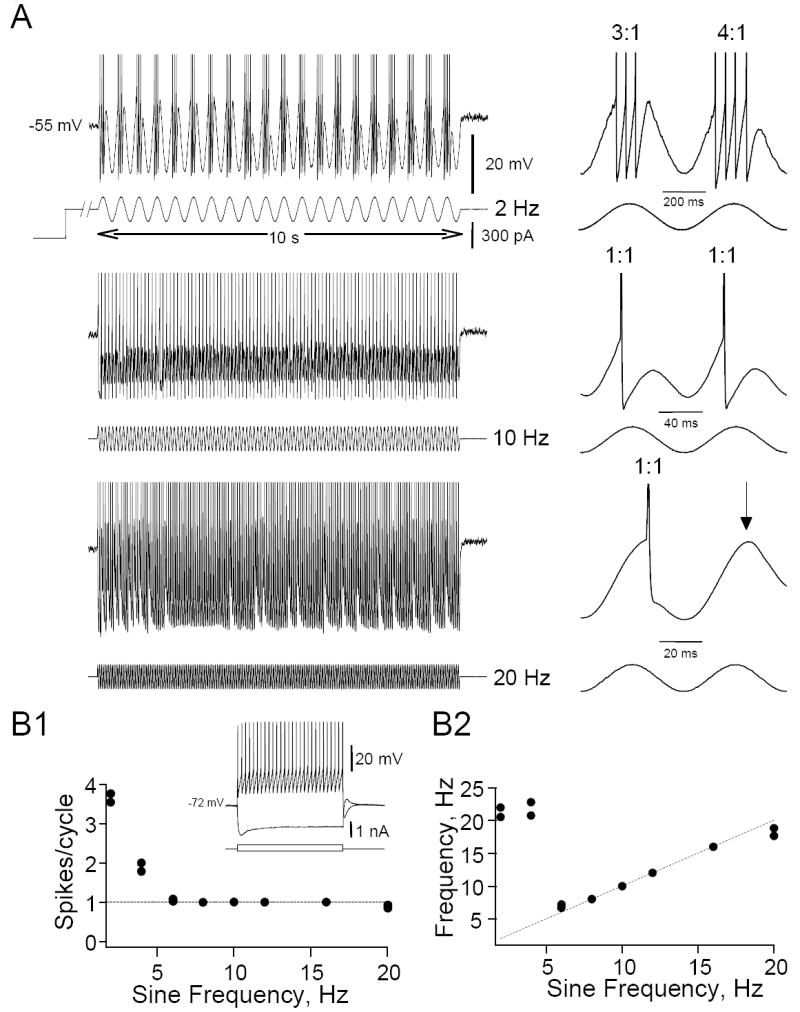
Response of HMs to steady sine wave stimulation. A. Representative examples of the firing response of a HM to intracellular sine wave stimulation (2-20 Hz). For three selected stimulus frequencies (2, 10 and 20 Hz; 10 s stimulus duration; 300 pA amplitude) the injected current (bottom) and corresponding membrane voltages (top trace) are shown (spikes are truncated at the top). In this neuron and in all subsequent experiments cells were depolarized to a membrane potential at or near firing threshold by DC current injections prior to the sine wave current injections. Two sine wave cycles from the traces on the left are shown on an expanded time scale on the right. B. Graphs of the average number of spikes/sine wave cycle (B1) and instantaneous firing frequency (B2) as a function of sine wave stimulation frequency for the cell in A. Dotted straight lines mark a perfect 1:1 correspondence between input and output frequency. Instantaneous firing frequency during cycles when the cell fired more than one spike/cycle represent instantaneous firing during the burst averaged over all cycles in the stimulus. Note that this cell fires one spike/cycle and is able to faithfully code the sine wave frequency of the input signal for frequencies between 8 and 16 Hz (=1:1 phase-locking range). Inset (B1) shows to membrane voltage responses of this cell to positive and negative DC current pulses recorded at rest.
Measurement of reliability and spike timing precision
Reliability and spike timing precision analysis was performed with custom-written functions implemented in Igor Pro. In order to quantify the reliability of firing (i.e. the likelihood that a cell will fire an action potential at a certain time relative to the onset of the stimulus), the cells were stimulated with repeated ZAP current stimuli (10 trials). The times of occurrence of spikes from the start of the stimulus (T=0) were collected in 3 ms wide bins and a peri-stimulus time histogram (PSTH) was constructed from the number of spikes that fell within each bin. Only bins that contained more than one spike were used for analysis. Reliability was expressed as the number of spikes/bin divided by the number of trials. Highest reliability (1 spike/bin/stimulus) was obtained if the cell always fired a spike at the same latency (i.e. fell within the same bin) at each trial. This reliability measure is sensitive to both the presence of a spike (i.e. firing probability) and spike timing precision. A low reliability might therefore be due to either a low probability of spike firing and/or low precision. In order to examine the probability of spike firing we calculated the average number of spikes per sinusoidal cycle and the trial-to-trial variability of the number of spikes/cycle, expressed as the coefficient of variability (CV = standard deviation/mean). Spike timing precision was examined using phase angle, phase error and spike jitter of single trial responses to steady sine wave stimuli. Phase angle was calculated from the time of the nadir of the trough of the input current time to the time of the first spike in the following half-cycle. The phase error is the standard deviation (SD) of this spike latency expressed in degrees, while jitter is the SD of spike latency expressed in milliseconds. At the onset of steady sine wave stimuli, during the first depolarizing half-cycle, the cells often fire more action potentials than in the remainder of the sine wave stimulus. For this reason the first ¾ cycle until the first trough in the sine wave was ignored in the spike timing precision analysis. Values for phase angle, phase error and jitter were averaged over all remaining cycles of a given 10 s steady sine wave stimulus. The cells were either entrained by the stimulus or fired irregularly. In order to quantify the regularity of firing we adopted the modified coefficient of variation (CV2) proposed by Holt et al. (1996): CV2 = 2 * abs[(Ii+1 − Ii)]/(Ii+1 + Ii). This measure of variability for an interval at t=i seconds compares only two adjacent spike intervals Ii+1 and Ii. A perfectly regular spike train has a CV2 of 0, while spikes occurring randomly (Poisson process) has a CV2 of 1.
Statistics
Statistical comparisons were performed using the t-test, with significance set at P<0.05. Results are expressed as mean ± SEM.
Results
For this study we obtained stable recordings from a total of 34 HMs. All neurons had stable resting membrane potentials and overshooting action potentials. Firing characteristics, determined from intracellular injection of DC depolarizing current pulses, were similar to those described in the XII nucleus in neonatal rat, including incrementing, decrementing and mixed incrementing-decrementing firing patterns (Viana et al., 1995). As observed previously, cells showed hyperpolarizing membrane voltage ‘sag’ of varying magnitude in response to hyperpolarizing current pulses (Fig. 1B1, insert) and in some cells rebound spikes were seen after cessation of the pulse (data now shown; see Viana et al., 1993).
Response of HMs to sine wave stimulation
After the firing properties of the recorded HMs at rest were established we depolarized the cells to a membrane potential near or at firing threshold by DC current injection. Superimposed on this steady DC current injection we stimulated the cells with 10 s long sine wave current inputs (Fig. 1). This protocol was chosen to simulate the synaptic drive that HMs receive during inspiration, which consist of a depolarizing envelope on top of which membrane potential oscillations are superimposed (Parkis et al. 2003; Smith and Denny 1990). In addition, by bringing the cells to firing threshold we were able to reduce the amplitude of the sine wave current, which greatly improved the stability of our recordings (see Methods). All cells studied fired only during the depolarizing half-cycle of the since current stimulus. We used two types of sine wave stimulation protocols, one in which sine frequency was varied in steps (steady sine wave stimulation) and another in which sine wave frequency was varied continuously (swept sine wave or ‘ZAP’ stimulation). Most cells in this study were stimulated with both protocols.
In response to steady sine wave stimulation (varied stepwise between 2-20 Hz) HM neurons showed several distinct firing patterns depending on the input frequency (n=14). At low input frequencies (generally < 5Hz) cells fired multiple spikes/cycle (i.e. ‘burst’ mode), at intermediate frequency cells fired 1 spike/cycle, while at higher frequencies occasional cycle skipping occurred (Fig. 1A). By plotting the number of spikes per sine wave cycle against frequency it was apparent that there was a range of input frequencies where the cells fired exactly one spike per cycle and this frequency range we called the 1:1 phase-locking range (Fig. 1B1). Instantaneous firing frequency was highest with low input frequencies when the cells fired in ‘burst’ mode (Fig. 1B2). At intermediate sine frequencies the firing frequency of the cells faithfully followed the input frequency (1:1 phase-locking range; Fig. 1B2). Beyond the maximum firing frequency at which the cells were able to phase-lock 1:1 to the stimulus (i.e. the ‘critical’ or maximum frequency Fmax) cells were unable to fire every cycle and the firing frequency of the cells was less than the input frequency. All 14 cells in this group showed the three distinct firing ranges (‘burst’ mode, phase-locking and cycle skipping), but the sine frequency at which these firing patterns occurred varied from cell to cell. In order to study the firing patterns to sine wave stimulation in more detail we stimulated a group of HMs (n=19 cells) with ZAP functions. Firing patterns obtained with ZAP stimulation showed many similarities compared to those obtained with steady sine wave stimulation, including ‘burst’firing, 1:1 phase-locking and cycle skipping as shown by the representative cell in Fig. 2A, B (same cell as in Fig. 1). When we plotted instantaneous firing frequency (f) against time (t), the resulting f-t relationships clearly showed these distinct regions of firing responses. In ‘burst’ mode (region ‘a’ in Fig. 2A1) the cells fired more than one spike per cycle in a relatively high frequency burst during the depolarizing half-cycle of the sine wave. The length of the silent period between bursts (i.e. the reciprocal of the inter-burst frequency) reflected the frequency of the sine wave input. At intermediate ZAP frequencies (between 7 and 21 Hz in the example shown in Fig. 2) the neurons abruptly transitioned from ‘burst’ firing to firing one spike/cycle. Between this minimum frequency (Fmin) and the maximum frequency (Fmax) HMs coded the frequency content by phase-locking 1:1 to the input stimulus (region b in Fig. 2A). Beyond Fmax irregular or chaotic firing occurred due to occasional cycle skipping (Fig. 2A2, region c). At even higher ZAP frequency additional phase-locking regimens were revealed, often separated by regions of irregular firing (Fig. 2A2 and Fig. 3). Most cells were able to fire every 2nd (1:2), every 3rd (1:3) and sometimes every 4th (1:4) cycle, phase-locked to sub-harmonics of the fundamental frequency of the ZAP stimulus (Figs. 2B and 3). On average the minimum input frequency (Fmin) for 1:1 phase locking was 4.5 ± 0.36 Hz (n=19 cells). The maximum frequency for 1:1 phase-locking (Fmax) in this group of cells was 11.4 ± 0.93 Hz. Although in individual cells Fmin and Fmax were influenced by stimulus amplitude (see Fig. 4), average Fmin and Fmax were not correlated with stimulus amplitude (average stimulus amplitude 253 ± 22 pA; range 100-400 pA) in this group of HMs (n= 19 cells; Pearson correlation, P>0.05). In addition, the maximum and minimum frequencies and width of the frequency range where HMs phase-locked 1:1 to the ZAP stimulus were not correlated with the input resistance of the cells (Pearson correlation, P>0.05).
Figure 2.

Responses of HMs to swept sine wave (ZAP) stimulation. A1. Representative traces of the membrane voltage responses (top) to ZAP current injections (bottom) of a HM (same cell as in Fig. 1). The cell was depolarized from rest by DC current injection to -55 mV and stimulated with a sine wave current stimulus (300 pA, 10 s duration) whose frequency varied linearly from 0 (t=0 s) to 20 Hz (t=10 s). Spikes are truncated at the top The cell fired multiple spikes per depolarizing half-cycle of the sine wave at input frequencies below 7 Hz. Asterisk indicates the time where the instantaneous firing frequency was highest (Fpeak). At frequencies higher than 7 Hz this cell phase-locked 1:1 to the ZAP stimulus. Bottom panel shows the instantaneous firing frequency of this cell as a function of time. Dashed straight line shows the frequency of the ZAP stimulus as a function of time. The minimum ZAP frequency (Fmin) for 1:1 phase-locking was 7 Hz in this cell. A2. Same as in A1, but this time the cell was stimulated with a ZAP stimulus of 10-40 Hz. The cell was able to follow the input frequency 1:1 up to a maximum ZAP frequency (Fmax) of 21 Hz. After a period of irregular firing (arrow), the cell phase-locked 1:2 to the stimulus until another episode of irregular firing occurred, followed by a period of 1:3 phase-locking. B. Expanded sections of the traces in A at the times denoted by the letters a, b, c and d. The cell fired multiple spikes per cycle (a), every cycle (b), irregularly (c) or every second cycle (d) depending on the frequency of the swept sine wave. C. For a representative group of 19 HMs we plotted the individual minimum (Fmin; open squares), median (diamonds) and maximum (Fmax; filled squares) frequency of the 1:1 phase-locking range as well as the peak instantaneous frequency (Fpeak) when the cells fired in ‘burst’ mode (asterisks). D Relationship between the peak instantaneous firing frequency (asterisks here and in Fig. 2C) and the width of the 1:1 phase-locking range (triangle here and length of horizontal lines in Fig. 2C) plotted against the median frequency of the 1:1 phase-locking range. Relationships were fitted with straight lines using linear regressions techniques (R values shown; P<0.05). Note that cells that phase-locked to higher input frequencies had a wider phase-locking range and also were able to fire at higher burst frequencies.
Figure 3.
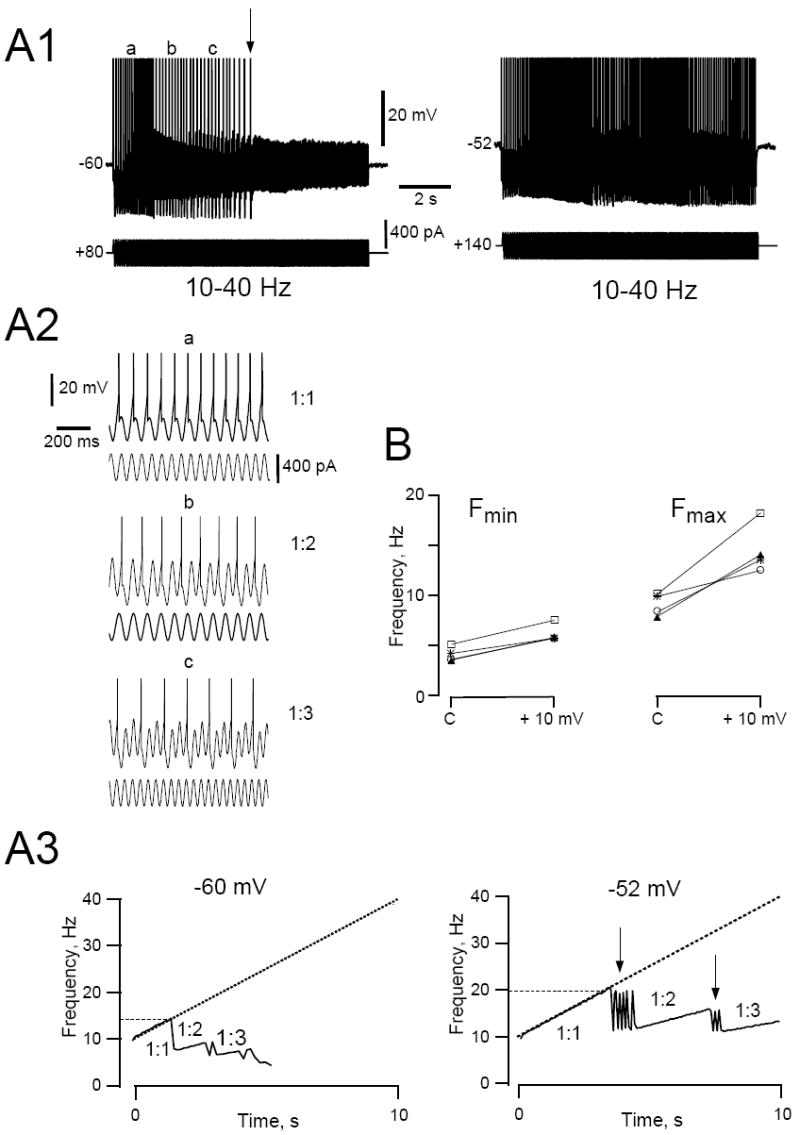
Responses of HMs to swept sine wave (ZAP) stimulation are dependent on the level of DC depolarization. A1. Representative traces of the membrane voltage responses of a HM to ZAP current injections recorded at two different holding potentials. This cell was held at rest (-60 mV, left panel) or just below threshold (-52 mV, right panel) by DC current injection and stimulated with a ZAP current stimulus (400 pA, 10-40 Hz, 10 s long). Spikes are truncated at the top. Note that the cell stops firing about midway through the stimulus when the cell was held at -60 mV (arrow), but is able to continue firing for the entire duration of the stimulus when the cell was held at -52 mV. A2. Expanded sections of the trace in A1 (left panel) at the times denoted by the letters a, b and c. The cell fired either every cycle (section a; 1:1), every second (section b; 1:2) or third (section c; 1:3) cycle depending on the frequency of the sine wave. A3. Instantaneous firing frequency as a function of time at -60 (left) and -52 mV (right). Dashed straight line shows the frequency of the ZAP stimulus as a function of time. Note that the cell was able to phase-lock 1:1 to the stimulus at a higher maximum frequency (horizontal dotted line) when the cell was more depolarized. Arrows point to regions of irregular (chaotic) firing that separate phase-locking regions. B. Graph summarizing the effect of membrane depolarization on the 1:1 phase locking frequency range. Shown are the effects of a +10 mV depolarization on Fmin and Fmax of the 1:1 phase-locking range for 4 different HMs (cells indicated by symbols, each line represents a separate cell).
Figure 4.
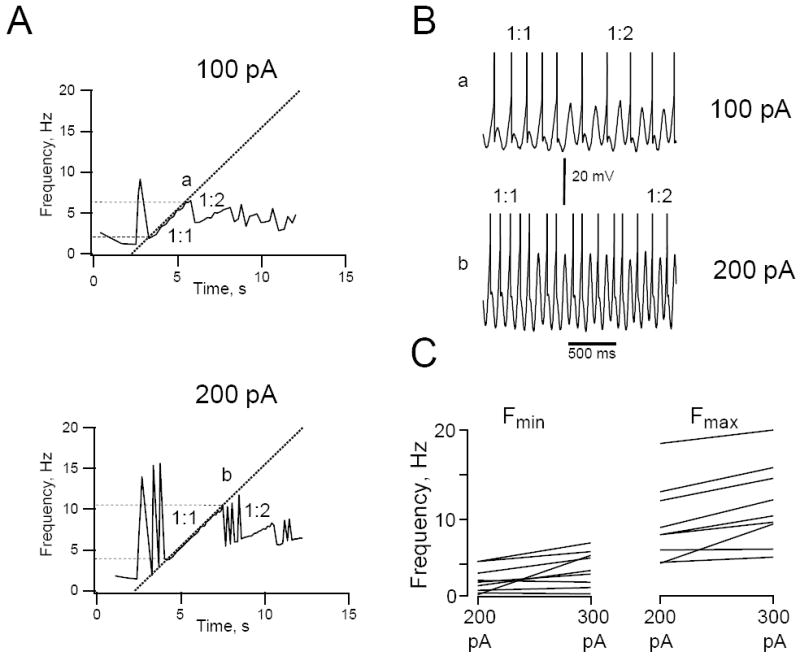
Effects of ZAP stimulus amplitude on firing resonance. A. Instantaneous firing frequency as a function of time for a representative HM stimulated with a 100 pA (top) or 200 pA (bottom) ZAP stimulus (0-20 Hz, 10 s long). Dotted straight lines show the frequency of the ZAP stimulus as a function of time. Dashed horizontal lines indicate the minimum (Fmin) and maximum (Fmax) firing frequency of the 1:1 phase-locking range. Note the extended 1:1 phase-locking range in the top compared to the bottom graph. B. Membrane voltage traces showing the transition of 1:1 to 1:2 phase locking at locations a in the f-t plot on the left (100 pA ZAP stimulus) and at b (200 pA). Spikes are truncated at the top. Cell was depolarized to a just supra-threshold membrane voltage by steady DC current injection (+180 pA) and kept at this level for the duration of the experiment. C. Summary graph showing the effect of varying ZAP stimulus amplitude. Lines connect data points obtained for Fmin and Fmax collected from 9 cells that were tested with both a 200 and 300 pA peak-to-peak stimulus at the same membrane potential (each line represents a separate cell).
In individual cells in this group the size of the phase-locking range and the median ZAP frequency at which 1:1 phase-locking occurred was highly variable (Fig. 2C). In general, cells with wider phase-locking ranges also phase-locked at a higher median input frequencies (Fig. 2D). Furthermore, the peak frequency achieved when the cells fired in ‘burst’ mode correlated well with the median frequency for 1:1 phase-locking (Fig. 2D). This data suggest, that the intrinsic firing properties of HMs are an important factor in determining phase-locking characteristics of individual cells. The minimum and maximum firing for the 1:1 phase-locking range were not different when steady-state sine wave or ZAP sine stimuli were compared in individual cells (n=9 cells; t-test, P>0.05).
These results show that the frequency information present in a time-varying input stimulus is encoded by precisely timed spikes when HMs phase-lock to the stimulus, indicating that in this frequency range they function as temporal encoders. The frequency range where this occurs varies from cell to cell.
Phase-locking region depends on DC depolarization and stimulus amplitude
Firing resonance in HMs depended on the level of DC membrane depolarization (Fig. 3A). When the cells were hyperpolarized from spike threshold the phase-locking regions became smaller and at high input frequencies the cells stopped firing altogether (Fig. 3A1). Both the minimum and maximum frequency of the 1: 1 phase-locking range were influenced by the level of depolarization. On average, the minimum frequency for 1:1 phase-locking (Fmin) increased by 2.1 ± 0.20 Hz and Fmax by 5.8 ± 1.03 Hz for a +10 mV membrane depolarization in the voltage range between rest and spike threshold (n=4 cells; Fig. 3B). Since Fmax increased more than Fmin the 1:1 phase-locking range was expanded by 68% in this group of cells by this manipulation. DC depolarization also resulted in an expansion of the regions of irregular or chaotic firing that flanked phase-locking regions (Fig. 3A3 arrows).
Stimulus amplitude also influenced the shape of the f-t relationship (Fig. 4A). With increased stimulus amplitude the instantaneous firing frequency and the frequency range over which the cells fired in ‘burst’ mode increased. Peak instantaneous firing frequency in ‘burst’ mode increased from 15.0 ± 1.7 to 22.2 ± 2.6 Hz for an increase in ZAP amplitude from 200 to 300 pA (P<0.05, paired t-test, n=7 cells). Increasing stimulus amplitude also shifted the 1:1 phase-locking region to higher frequencies (Fig. 4A). Mean Fmin and mean Fmax increased by 1.32 ± 0.47 and 2.04 ± 0.44 Hz, respectively for a 100 pA increase in ZAP amplitude from 200 to 300 pA (both increases were significant at P<0.05, paired t-test, n=9 cells; Fig. 4C). Although Fmax increased more on average than Fmin, the resulting 11% increase in width of the 1:1 phase-locking range by increasing stimulus amplitude by 100 pA was not significant (P>0.05). Increasing stimulus amplitude also increased the irregular firing regions at the transition between phase-locking regions (Fig. 4A). In the example shown in Figure 4, the cell was able to smoothly switch between 1:1 and 1:2 phase-locking with a 100 pA peak-to-peak amplitude stimulus (Fig. 4B, top trace), but fired irregularly between 1:1 and 1:2 phase-locking when ZAP stimulus amplitude was doubled (Fig. 4B, bottom trace). These results indicate that spike firing rate carries information about the stimulus amplitude when the input frequency is low and the cells fire in ‘burst’ mode (so-called ‘rate coding’). The timing of individual spikes carries information about the frequency content of the stimulus when the cells are in ‘phase-locking’ mode (‘temporal coding’). In this mode a change in spike firing frequency requires a change in input frequency. The amplitude of the input stimulus influences at what frequency the switch from rate to temporal coding occurs and also the frequency range for phase-locking and cycle skipping.
Although there was hysteresis in the number of spikes/cycle when forward and reverse stimuli were compared in the same cell (forward ZAP stimuli overall elicited more firing, see Fig. 6), we found that the range for 1:1 phase-locking was similar for these types of stimuli. Fmin and Fmax for forward and reverse ZAP stimuli were not significantly different (paired t-test; n=10 cells; P>0.05).
Figure 6.

Effects of ZAP amplitude on firing reliability. Top row. Rasterplots of the firing pattern of a cell responding to repeated (10 trials each) ZAP stimuli using a 0-20 Hz stimulus (A1), a 20-0 Hz stimulus (B1), or a 0-20 Hz stimulus (C1) with increased amplitude (300 pA instead of 200 pA). Before ZAP stimulation began the cell was depolarized to just below threshold membrane voltage by injection of steady depolarizing current (+100 pA) and kept at this potential for the duration of the experiment. All ZAP stimuli were 10 s long with >10 s between stimuli. Middle row Superimposed f-t plots (10 trials each) constructed from the corresponding rasterplots in the top row. Dashed straight line shows the frequency of the ZAP stimulus as a function of time. Bottom row. PSTHs constructed by plotting spike reliability (expressed as the number spikes/bin/stimulus, see Methods) against ZAP frequency. Spikes were binned at a bin width of 3 ms from the corresponding rasterplots shown in the top row. Only bins with more than one spike were counted. The envelope of the histograms was fitted with peak-normalized cubic spline functions.
Reliability and spike timing precision
Synchronicity of firing of assemblies of neurons depends critically in the ability of the cells to fire with high reliability and precision to repeated stimuli. We examined these properties in HMs by repeatedly stimulating HMs with ZAP stimuli. Such an experiment is illustrated in Figure 5. This cell was repeatedly (10 trials) stimulated with a 0-20 Hz ZAP function. From the raster-plots (Fig. 5A,B) and superimposed f-t curves (Fig. 5C) it is clear that this cell fired consistently at a specific sine wave cycle from trial-to-trial from the beginning of the stimulus to the end of the 1:1 phase-locking range, but less consistently afterwards. This is further demonstrated in Figure 5D which shows, that the variability in the average number of spikes/cycle (as measured by the coefficient of variation) is smallest when the cell phase-locks 3:1 (burst mode) or 1:1 to the stimulus. Repeatability from trial to trial did not have the same frequency profile as reliability, however. Although the cell in Figure 5 fired three spikes at every trial at the first cycle of the stimulus (i.e. high repeatability), it did so with low temporal precision (Fig. 5B left panel). When the cell was entrained 1:2 the opposite was true, it now fired with high precision but low repeatability because it did not always fire in the same cycle from trial-to-trial (Fig. 5B right panel). Low precision at low ZAP frequencies and low repeatability at high frequencies resulted in roughly bell-shaped reliability curves (Fig. 5E). Reliability (which depends on both the presence and timing of a spike and was expressed as the number of spikes/bin/stimulus, see Methods) peaked when the cell phase-locked 1:1 to the stimulus at intermediate input frequencies. Similar experiments as those shown in Figure 5 were performed in eight other HMs. Peak reliability –as determined from cubic spline fits to PSTH data- was found at an average input frequency of 8.68 ± 1.38 Hz (n=9 cells; ZAP current peak-to-peak amplitude between 150 and 400 pA). Peak reliability was 0.82 ± 0.05 spikes/bin/stimulus and in all but one of these neurons peak reliability occurred within the 1:1 phase-locking region. We found that spike reliability curves were similar when repeated steady sine wave stimuli were compared to repeated ZAP stimuli in the same neuron (n= 3 cells; data not shown).
Figure 5.

Reliability and precision are a function of sine wave frequency. A. Rasterplots marking the occurrence of spikes for each trial of a neuron that was repeatedly stimulated with ZAP current pulses (10 trials; 0-20Hz; 10 s duration; 400 pA amplitude). Before ZAP stimulation began the cell was depolarized to just below threshold membrane voltage by injection of steady depolarizing current (+150 pA) and kept at this potential for the duration of the experiment. Rasterplots were aligned at the start of the stimulus (T = 0 s). The ZAP current stimulus is shown at the bottom. B. Superimposed membrane voltage trajectories (top) and the corresponding rasterplot section (middle) and ZAP current stimulus (bottom) shown on an expanded time scale at the times indicated by a, b and c in panel A. Note the trial-to-trial jitter in the spike timing when the cells fired 3 spikes/cycle (3:1) at a, while when the cell fired 1:2 at c it did not always fire at the same cycle. C. Superimposed f-t plots (10 trials) constructed from the rasterplot in A. Dashed straight line shows the frequency of the ZAP stimulus as a function of time. Note that the minimum frequency for 1:1 phase-locking varies little from trial-to-trial, but that the maximum frequency is much more variable. D. Average number of spikes per cycle (red trace; left axis) and the corresponding coefficient of variation (black trace; right axis) plotted against cycle number of the ZAP stimulus for the cell shown in A. Note that the cell always fired a spike in every trial for cycles where the cell phase-locked 3:1 or 1:1 to the stimulus (CV=0), and that the variability of the number of spikes/cycle is high when the cell fired fewer than one spike/cycle at frequencies higher than the 1:1 phase-locking range. The absence of data points between cycles 90 and 95 is due to the off-scale CV values. E. PSTH constructed from the number of spikes/bin/stimulus for the response of the cell in A to repeated ZAP stimuli. Spikes were binned (3 ms bin width) using the rasterplots shown in A and the number of spikes that were collected in each bin, divided by the number of trials, were expressed as a function of time (bottom axis) and ZAP frequency (top axis). Only bins with more than one spike were counted. The contour of the histogram was fitted with a peak-normalized cubic spline function. Note that although this cell fired with high reliability when it fired 3:1 (see panel B section a), spike timing precision was such that few spikes fell in the same bin at this ZAP frequency. Spike timing precision is highest for the frequency range where this cell was able to phase-lock 1:1 to the stimulus (2-12 Hz) and peaked near the middle of this range at 8 Hz (arrow). When the cell phase-locked 1:2 to the stimulus -between 15 and 20 Hz- spike timing precision was high, but repeatability was low (panel B section c), resulting in a decrease in reliability at these input frequencies.
In three HMs we compared spike reliability as determined from repeated forward (0-20 Hz) or reverse (20-0 Hz) ZAP stimuli. Although HMs fired on average more spikes/cycle with a forward compared to a reverse ZAP stimulus especially at low sine frequencies (compare Figs. 6A1 and 6A2), peak reliability was achieved in the frequency range where the cells phase-locked 1:1 with both types of stimuli (Fig. 6A,B).
We tested the effect of stimulus amplitude on spike reliability in two HMs. In both cells overall spike reliability increased when stimulus amplitude was increased (see example in Fig. 6C) and the frequency range of high spike reliability was expanded. In summary, the low reliability at low and high input frequencies suggests that HMs act as a band-pass filter and not as a low-pass filter, with highest reliability in the intermediate 1:1 phase-locking range. Spike reliability and the frequency where reliability is highest are functions of stimulus amplitude.
The timing of spikes within individual cycles varied with input frequency when the cells were stimulated with steady sine wave stimuli (Fig. 7). Spiking occurred early, during the rising phase of the sine wave stimulus, when the input sine frequency was low (phase-advance; Fig. 7A2). The phase advance gradually decreased with increasing input frequency until a delay of zero (= ‘preferred’ frequency) was reached. At even higher input frequency spikes were delayed with respect to the sine wave stimulus (phase-delay). The preferred frequency –as determined by linear interpolation at zero phase delay was 8.7 ± 1.0 Hz (n= 10 cells), a value very close to the frequency were optimum reliability occurred (8.3 Hz, see above). Spike jitter-a measure of spike timing precision, see Methods- generally decreased with increasing sine wave frequency (Fig. 7A3). Thus, the variability in the latency of the occurrence of spikes became smaller with increasing input frequency i.e. spike timing precision was enhanced. The relationship between phase error, which in contrast to jitter is frequency-invariant, and sine wave frequency was more complex than jitter-frequency curves but it also tended to become smaller with increasing sine frequency (Fig. 7A3, A4). Within the 1:1 phase-locking region jitter and phase-error were not constant. Because jitter -and to a lesser extent phase error-decreased with increasing sine frequency, timing precision was greatest when the cells phase-locked at or near Fmax (Fig. 7A3,A4). When the cells were driven at sine frequencies higher than Fmax phase error increased dramatically because the phase-angle varied from cycle-to-cycle when the cells were not entrained by the stimulus (Fig. 7B). In other HMs, where several phase-locking regions were present, additional regions of high spiking precision were evident (Fig. 8). For example, inter-spike interval variability (as measured by the local coefficient of variation, see Methods), phase error and jitter reached local minima not only when the cells phase-locked 1:1 to the sine wave stimulus but also when they phase-locked 1:2 or 1:3 (Fig. 8). Thus, HMs encode a time-varying input with highest spike timing precision when the cell phase-locks to the fundamental frequency or sub-harmonics of this frequency.
Figure 7.
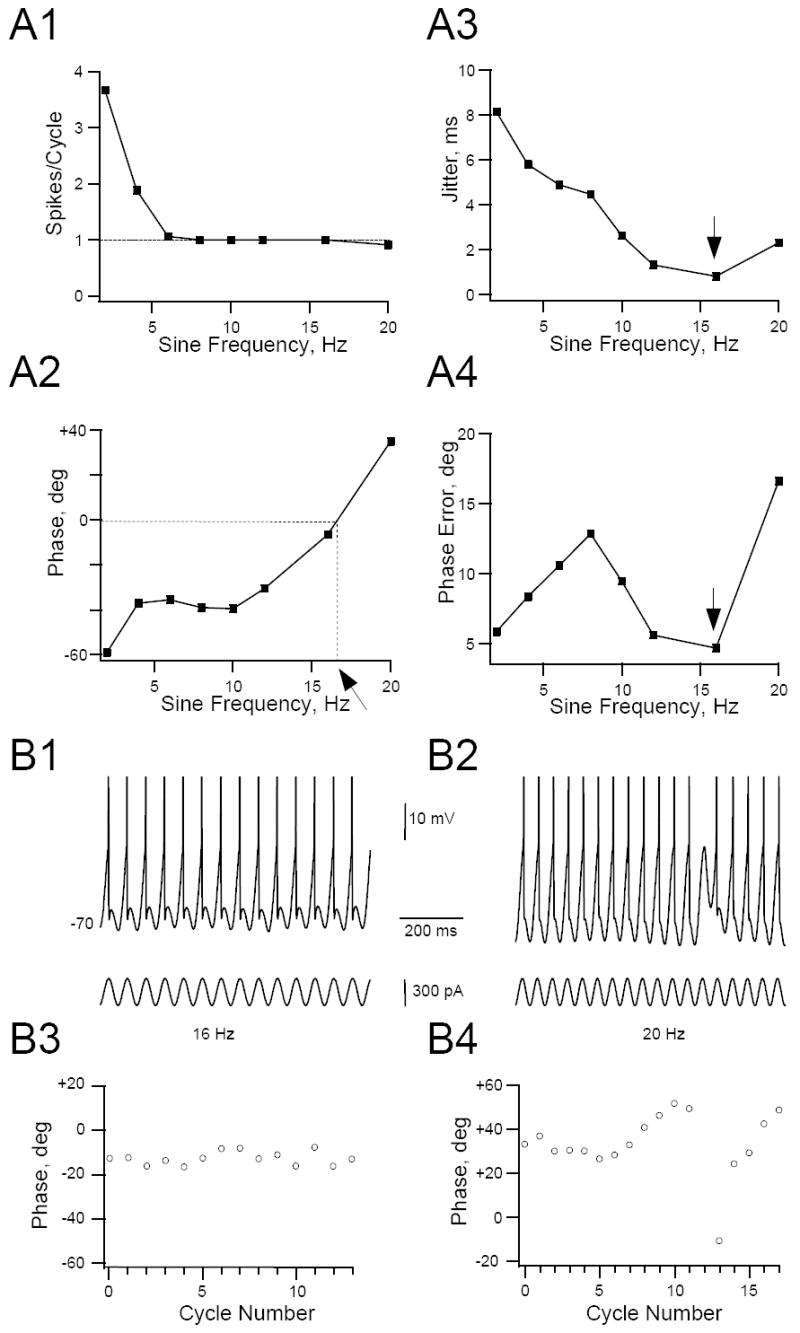
Effect of sine wave frequency on spike timing precision. Representative example of a HM stimulated with steady sine waves whose frequency was varied stepwise between 2 and 20 Hz. Cell was depolarized to just below sub-threshold membrane voltage with DC current injection and kept at that level for the duration of the experiment. Cell was stimulated for 10 seconds at each sine frequency and average number of spikes/cycle, phase, phase error and jitter was calculated for each of the sine wave frequencies (see Methods). Sine wave peak-to-peak amplitude was 300 pA. A1. The number spikes/cycle was averaged for all cycles in the trial (with the exception of the first cycle, see Methods) and plotted against sine wave frequency. This cell was entrained 1:1 to the stimulus from 8-16 Hz. A2. Relationship between phase angle and sine wave frequency. The arrow points to the preferred input frequency (zero phase angle at 17 Hz), obtained by linear interpolation between data points (dashed lines). A3, A4. Relationships between spike jitter and phase error and sine wave frequency, respectively. Note that spike jitter and phase-error reached a minimum at the critical frequency of 16 Hz (arrows). This was close to the preferred frequency where zero phase delay was found (17 Hz, see A2). B 1, B2. Segments of the membrane voltage response (top trace, spikes truncated) and sine current (bottom trace) for a 16 Hz (B1) and 20 Hz (B2) stimulus for the cell in panel A. B3, B4. Corresponding spike phase-plots for individual sine wave cycles. Note that the spike phase-angle varies little from cycle-to-cycle when the cell phase-locks 1:1 to the stimulus at 16 Hz. However, prior to a skipped cycle in B4 (arrow) the phase angle gradually increased until no spike was elicited. After the skipped cycle phase angle briefly reset before beginning another gradual increase commenced.
Figure 8.
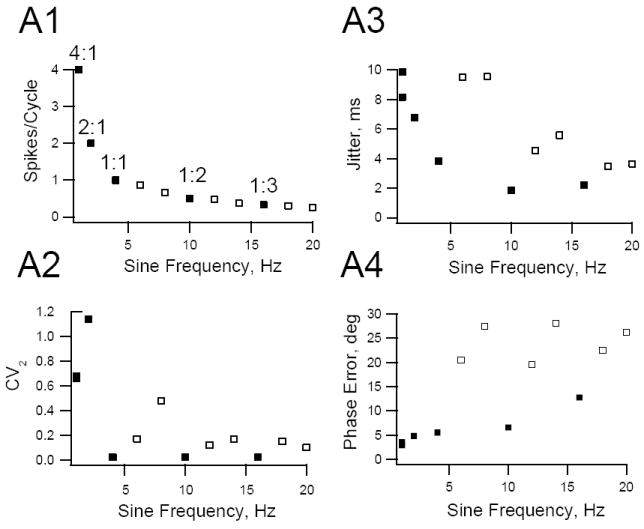
Spike timing precision and phase in HMs are a function of input frequency. A1. Representative HM was stimulated with steady sine wave inputs between 2 to 20 Hz and again at 2 Hz at the end of the experimental protocol. The average number spikes/cycle was calculated at each sine wave frequency and plotted against input frequency. This cell fired 4, 2,1, 0.5 or 0.33 spikes per cycle when it phase locked to the stimulus (filled symbols) A2-A4. Graphs showing the relationships between inter-spike variability (CV2, see Methods), phase error and spike jitter plotted against sine wave frequency for the cell in A1. Frequencies where the cell phase-locked are indicated by filled symbols, other frequencies by open symbols. Note that when the cell phase-locked to the stimulus CV2, jitter and phase error reached local minima.
Discussion
In this study we examined whether HMs show firing resonance in response to time-varying sinusoidal inputs. We found that HMs are capable of encoding these types of stimuli into highly reproducible spike trains, depending on the sine wave frequency. Over a limited range of frequencies (3-25 Hz) HMs were able to phase-lock 1:1 to the sine wave stimulus. HMs function as rate encoders at low sine frequency where they fire in ‘burst’ mode, and as temporal encoders at higher sine frequencies when they phase-lock to the stimulus. In phase-locking mode the pattern and timing of the spikes carries information about the frequency of the input sine wave current. Our results show that spike timing precision and reliability were greatest in the phase-locking range. Areas of low reliability flanked the phase-locking range, indicating that HMs act as band-pass filters.
Spike timing reliability and precision have been shown to be frequency-dependent in other neuronal types in the brain (Fellous et al. 2001; Pike et al. 2000; Leung and Yu 1998; Schreiber et al. 2004b). The range of frequencies where precision and reliability are highest in HMs is similar to the preferred frequency range in hippocampal (Leung and Yu 1998; Pike et al. 2000) and cortical pyramidal cells (Fellous et al. 2001), but lower than in hippocampal and cortical interneurons (Fellous et al. 2001; Pike et al. 2000). The preferred frequency is a function of the properties of the ionic currents responsible for action potential generation, inter-spike interval duration and spike frequency adaptation (Fuhrmann et al. 2002; Schreiber et al. 2004b). Differences in the composition of ion channels are most likely responsible for differences in preferred frequencies among neuronal cell types. For instance, slow potassium channels have been shown to be important for setting the preferred frequency (Fellous et al. 2001; Schreiber et al. 2004b). In modeling studies (Schreiber et al. 2004b) it was found that a higher peak conductance for slow potassium channels, such as the muscarinic potassium channel (KM) or a calcium-dependent potassium channel (KCa), decreased the preferred frequency of cortical neurons (but increased spike reliability). In contrast, an increase in sodium conductance, such as the fast (Naf) and persistent (Nap) sodium current, increased the preferred frequency (but decreased reliability). These conductances and their kinetics also influenced the width of the 1:1 phase-locking range in these studies. It is conceivable that the wide range of preferred frequencies and widths of phase-locking ranges that we found in our study is a reflection of the heterogeneity in density and/or kinetics of these conductances among hypoglossal motoneurons. Neuromodulation of ion channels can alter the preferred frequencies and increase spike timing precision and reliability by adapting the intrinsic oscillatory properties of neurons to facilitate entrainment of these cells to certain input frequencies (Lawrence et al. 2006).
Phase-locking depends on input frequency, stimulus amplitude and level of depolarization
When HMs were brought close to firing threshold spike firing was entrained by the sine wave input, depending on sine wave frequency. At low input frequency HMs fired highly repeatable, stereotypical ‘bursts’ of action potentials during the depolarizing phase of the sine wave cycle (i.e. more than one spike/cycle). This burst firing mode is most suitable to reliably evoke a post-synaptic response when the timing of the spikes is not important, since spike timing precision in burst mode was low. This study and those by others (Carandini et al.1996; Hunter and Milton 2003; Schreiber et al. 2004b) show that small increases in the input frequency can lead a neuron to shift from coding spike rate (burst mode) to coding spike timing (phase-locking mode). Phase-locking was most prevalent at intermediate and high input frequencies, but this frequency range varied from cell-to-cell. Phase-locked responses could result in the firing of exactly one spike per cycle (1:1 mode), or in 1 spike for each n cycles of the sine wave stimulus (with n being an integer number ≥ 2). This phase-locked firing mode was characterized by high temporal precision. Phase-locking did not always result in high reliability since the cells did not always fire in the same cycle when cycle skipping was present (1:n mode), similar to the results obtained by Hunter and Milton 2003. Thus, the 1:1 phase-locking region is optimized for encoding input signals with both high reliability and high precision.
The range of frequencies where the cells phase-locked depended on the mean level of depolarization and the amplitude of the sinusoidal inputs. The relationship between reliability, membrane depolarization, stimulus amplitude and input frequency has been explored in several types of neurons (Beierholm et al. 2001; Fellous et al. 2001; Hunter and Milton 2003; Smith et al. 2000). In general, these studies show that the most robust areas of high reliability are found when the cell phase-locks 1:1 to the stimulus using intermediate relative stimulus amplitude. Small amplitude input fluctuations are unreliable because under these conditions noise becomes the most important determinant of spike timing (Hunter and Milton 2003). The preferred frequency range increased with increasing amplitude of the input stimulus, similar to results obtained by others (Carandini et al. 1996; Fellous et al. 2001), but large amplitude voltage fluctuations eventually lead to cell damage and decreased reliability (Fellous et al., 2001). Thus, intermediate-amplitude signals in the band-pass frequency range delivered when the neurons are depolarized to near spike threshold will be transmitted more reliably than those outside the band-pass frequency range or when the cells are hyperpolarized.
Several studies have suggested that firing resonance emerges from sub-threshold resonance properties (Erchova et al. 2004; Hutcheon et al. 1996; Schreiber et al. 2004a), but others have not found such a clear correlation (Brumberg and Gutkin 2007; Carandini et al. 1996; Haas and White 2002; Nowak et al. 1997). These discrepancies might be explained in part by differences in sub-threshold resonance properties between cell types (Erchova et al. 2004; Haas and White 2002). In resonant cells, the amplitude of their membrane potential responses to time-varying sub-threshold currents peaks at the resonance frequency, while non-resonant cells act as low-pass filters. In resonant cells firing occurs preferentially at the sub-threshold resonance frequency when they are stimulated with a supra-threshold stimulus. Sub-threshold resonance has been described in HMs that peaks at 4 Hz (Nguyen et al. 2004). Our own results indicate that in HMs are not or only weakly resonant in the sub-threshold range (unpublished observations). HMs therefore act predominantly as low-pass filters in the membrane voltage range between rest and spike threshold for input frequencies> 3-5 Hz. This property is responsible for the cessation of firing at high frequencies that was observed in many HM neurons when they are moved away from spike threshold by DC current injection (see Fig. 3A1). The frequency range where firing occurs can be widened by increasing the stimulus amplitude or by membrane depolarization. At depolarized membrane potentials small amplitude currents can more easily generate spikes, and the cell fires at higher input frequencies despite low-pass filtering of the input signal (Hutcheon et al. 1996). The firing resonance range can also be increased by the addition of stochastic noise to the sine wave input in thalamocortical neurons (Reinker et al. 2004). Whether this is also the case in HMs remains to be established.
Relationship between spike jitter, phase and input frequency
Our results show that HMs show phase-advance at low frequency stimulation and phase delay at high frequency, separated by the preferred frequency at which no phase shift occurs. Similar phase-frequency curves have been described for thalamic relay neurons (Smith et al. 2000), regular spiking cortical neurons (Carandini et al. 1996) and hippocampal CA neurons (Leung and Yu 1998). The mechanism behind this property has been examined in modeling studies (Fuhrmann et al. 2002) and has been explained as an interplay between two opposing mechanisms, namely spike frequency adaptation and the time constant of firing rate dynamics. Firing rate dynamics causes a neuron to delay its response to stimulation and dominates at high frequency. Spike frequency adaptation causes the response to a sustained input to gradually decrease with time. The slow rising phase with low-frequency sinusoidal stimulation leads to accumulation of adaptation and thus the firing probability will be higher before the peak of the sinusoidal stimulus than after, leading to a phase advance. At the preferred frequency (phase=zero) these two mechanisms balance each other (Fuhrmann et al. 2002).
Our results show that spike jitter generally decreases with increasing sine frequency. Studies in neocortical neurons have shown that spike jitter is less for high frequency compared to low frequency input (Mainen and Sejnowski 1995; Nowak et al. 1997). The mechanism behind this observation is not known, but is has been suggested that increased timing precision at high stimulus frequencies is related to the time that the neuron spends near spike threshold. The time spent near threshold is brief for high compared to low-frequency stimulation. Therefore, at high frequency stimulation there is only a small probability that random fluctuations in membrane potential will exceed spike threshold and thus spike jitter is reduced (Nowak et al. 1997).
Regions of phase-locking, flanked by regions of irregular firing when HMs were driven with a time-varying stimulus have also been described in supragranular pyramidal cells under similar conditions (Brumberg 2002; Brumberg and Gutkin 2007). Together this firing pattern forms a so-called ‘devil’s staircase’. The regions of irregular firing are influenced by stimulus amplitude and level of depolarization and they are characterized by low precision and reliability. Our studies suggest that there exists an optimal level of depolarization and stimulus amplitudes where in response to sine wave stimuli irregular firing in HMs can be largely avoided. If the oscillation frequency or the power of the oscillations change (for some examples of this behavior see Sebe et al., 2006), HMs will have to adjust their encoding to maintain phase-locking to the stimulus. A widest possible phase-locking range with ‘smooth’ transitions between 1:1 and 1:n phase-locking ranges will ensure that HMs will be able to maintain synchrony over a wide range of time-varying inputs while avoiding regions of irregular firing.. The 1:1 phase-locking region is most robust in the presence of noise (Hunter and Milton 2003), but whether in vivo synaptic noise stabilizes firing in HM neurons remains to be investigated.
Importance of HM spike timing and precision for synchronous oscillation in HM output
The motoneurons in the hypoglossal nucleus are part of the brainstem inspiratory network. From studies performed in in vitro preparations in neonatal or juvenile rodents it is known that inspiratory motoneurons are driven by a slow depolarizing envelope on top of which fast (20-50 Hz) membrane potential oscillations are superimposed (Funk and Parkis 2002; Parkis et al. 2003). Our results indicate that with time-varying synaptic input in this frequency range HMs operate in phase-locking mode. Short time scale inspiratory-phase oscillations in this frequency range recorded from the hypoglossal nerve during these inspiratory bursts are characterized by clusters of action potentials that occur at a regular interval separated by periods of little or no spike firing (Sebe et al. 2006), suggesting that HMs fire synchronously. In phase-locking mode groups of HMs are able to produce precise and reliable spike output which would transform common oscillatory synaptic input into synchronous volleys of spikes. High reliability of spike timing enhances synchronization of groups of functionally related neurons activated by a common synaptic input (Usrey and Reid 1999).
The function of inspiratory-phase synchronous oscillations in the brainstem is not known. Inspiratory-phase synchronous oscillations are not required for respiratory rhythm generation, but they are important in shaping the pattern of inspiratory discharge. At the motoneuron level, oscillations increase the input-output efficiency of and the precision of spike timing (Parkis et al. 2003). Oscillations provides for a mechanism that avoids accumulation of spike jitter as occurs with DC stimuli (Mainen and Sejnowski, 1995), by alternating spiking and non-spiking periods. Membrane hyperpolarization between half-cycles allows for recovery from inactivation of voltage-activated ion currents involved in spike-generation. Phrenic motoneurons tend to fire within a couple of milliseconds from the short time-scale oscillatory peaks in inspiratory synaptic drive (Parkis et al. 2003). This time scale is similar to the minimum in spike jitter that we found in this study when the cells phase-lock to the stimulus (see Figs. 7 and 8). The DC current injection that we used in our study mimics the membrane depolarization of the slow depolarizing inspiratory envelope, but it did not account for the increased membrane conductance accompanying this excitatory synaptic drive. It is possible that the increased conductance -and associated decrease in membrane time constant- will improve spike timing precision and shift the optimum frequency for phase-locking to higher input frequencies than we found in our quiescent, synaptically isolated slice preparation.
Similar to what has been found in spinal interneurons (Beierholm et al. 2001), it appears that the combination of long and short time scale synaptic inputs to HMs during inspiration reliably drive the cells with high timing precision. The depolarizing envelope during inspiration brings the cells close to spike threshold, so that high reliability can be achieved with relatively small amplitude membrane voltage fluctuations (similar to a very low frequency sine wave input stimulus). The high frequency oscillation on top of this depolarizing envelope serves to give high spike reliability and precision.
Power spectra of inspiratory oscillations recorded in vivo from motor nerves in adult animals show two peaks in the 20-50 and 50-150 Hz range (Richardson and Mitchell 1982; Smith and Denny 1990). Single fiber recordings from the phrenic nerve during inspiratory activity showed that the discharge frequency of individual motoneurons is lower than that of the whole nerve during short time scale oscillations in vivo (Richardson and Mitchell 1982). In these studies it was found that single fibers sometimes skipped cycles, firing every second, third, or fourth cycle. It is possible that individual HMs in vivo phase-lock to sub-harmonics of the fundamental oscillation frequency, skipping cycles and fire at a lower frequency than the population fundamental. We hypothesize that, even though spikes are not elicited at every cycle in individual HMs the high frequency input signal still serves to synchronize neurons by reducing jitter and improving spike timing. It would therefore be of interest to establish the firing resonance properties of individual HMs during inspiration in vivo and to relate these to the motor output of the XII nucleus as a whole.
Acknowledgments
We thank Dr. W. Satterthwaite for technical assistance. This research was supported by the NIH grant HL-49657.
References
- 1.Bayliss DA, Viana F, Berger AJ. Mechanisms underlying excitatory effects of thyrotropin-releasing hormone on rat hypoglossal motoneurons in vitro. J Neurophysiol. 1992;68:1733–1745. doi: 10.1152/jn.1992.68.5.1733. [DOI] [PubMed] [Google Scholar]
- 2.Beierholm U, Nielsen CD, Ryge J, Alstrom P, Kiehn O. Characterization of reliability of spike timing in spinal interneurons during oscillating inputs. J Neurophysiol. 2001;86:1858–1868. doi: 10.1152/jn.2001.86.4.1858. [DOI] [PubMed] [Google Scholar]
- 3.Berger AJ, Sebe J. Developmental effects of ketamine on inspiratory hypoglossal nerve activity studied in vivo and in vitro. Respir Physiol Neurobiol. 2007;157:206–214. doi: 10.1016/j.resp.2007.01.001. [DOI] [PubMed] [Google Scholar]
- 4.Brumberg JC. Firing pattern modulation by oscillatory input in supragranular pyramidal neurons. Neuroscience. 2002;114:239–246. doi: 10.1016/s0306-4522(02)00252-x. [DOI] [PubMed] [Google Scholar]
- 5.Brumberg JC, Gutkin BS. Cortical pyramidal cells as non-linear oscillators: Experiment and spike-generation theory. Brain Res. 2007 doi: 10.1016/j.brainres.2007.07.028. [DOI] [PMC free article] [PubMed] [Google Scholar]
- 6.Carandini M, Mechler F, Leonard CS, Movshon JA. Spike train encoding by regular-spiking cells of the visual cortex. J Neurophysiol. 1996;76:3425–3441. doi: 10.1152/jn.1996.76.5.3425. [DOI] [PubMed] [Google Scholar]
- 7.Chung I, Zhang Y, Eubanks JH, Zhang L. Attenuation of hypoxic current by intracellular applications of ATP regenerating agents in hippocampal CA1 neurons of rat brain slices. Neuroscience. 1998;86:1101–1107. doi: 10.1016/s0306-4522(98)00103-1. [DOI] [PubMed] [Google Scholar]
- 8.Erchova I, Kreck G, Heinemann U, Herz AV. Dynamics of rat entorhinal cortex layer II and III cells: characteristics of membrane potential resonance at rest predict oscillation properties near threshold. J Physiol. 2004;560:89–110. doi: 10.1113/jphysiol.2004.069930. [DOI] [PMC free article] [PubMed] [Google Scholar]
- 9.Fellous JM, Houweling AR, Modi RH, Rao RP, Tiesinga PH, Sejnowski TJ. Frequency dependence of spike timing reliability in cortical pyramidal cells and interneurons. J Neurophysiol. 2001;85:1782–1787. doi: 10.1152/jn.2001.85.4.1782. [DOI] [PubMed] [Google Scholar]
- 10.Fuhrmann G, Markram H, Tsodyks M. Spike frequency adaptation and neocortical rhythms. J Neurophysiol. 2002;88:761–770. doi: 10.1152/jn.2002.88.2.761. [DOI] [PubMed] [Google Scholar]
- 11.Funk GD, Parkis MA. High frequency oscillations in respiratory networks: functionally significant or phenomenological? Respir Physiol Neurobiol. 2002;131:101–120. doi: 10.1016/s1569-9048(02)00041-1. [DOI] [PubMed] [Google Scholar]
- 12.Holt GR, Softky WR, Koch C, Douglas RJ. Comparison of discharge variability in vitro and in vivo in cat visual cortex neurons. J Neurophysiol. 1996;75:1806–1814. doi: 10.1152/jn.1996.75.5.1806. [DOI] [PubMed] [Google Scholar]
- 13.Hunter JD, Milton JG. Amplitude and frequency dependence of spike timing: implications for dynamic regulation. J Neurophysiol. 2003;90:387–394. doi: 10.1152/jn.00074.2003. [DOI] [PubMed] [Google Scholar]
- 14.Hunter JD, Milton JG, Thomas PJ, Cowan JD. Resonance effect for neural spike time reliability. J Neurophysiol. 1998;80:1427–1438. doi: 10.1152/jn.1998.80.3.1427. [DOI] [PubMed] [Google Scholar]
- 15.Hutcheon B, Miura RM, Puil E. Subthreshold membrane resonance in neocortical neurons. J Neurophysiol. 1996;76:683–697. doi: 10.1152/jn.1996.76.2.683. [DOI] [PubMed] [Google Scholar]
- 16.Kaczorowski CC, Disterhoft J, Spruston N. Stability and plasticity of intrinsic membrane properties in hippocampal CA1 pyramidal neurons: effects of internal anions. J Physiol. 2007;578:799–818. doi: 10.1113/jphysiol.2006.124586. [DOI] [PMC free article] [PubMed] [Google Scholar]
- 17.Lawrence JJ, Statland JM, Grinspan ZM, McBain CJ. Cell type-specific dependence of muscarinic signalling in mouse hippocampal stratum oriens interneurones. J Physiol. 2006;570:595–610. doi: 10.1113/jphysiol.2005.100875. [DOI] [PMC free article] [PubMed] [Google Scholar]
- 18.Leung LS, Yu HW. Theta-frequency resonance in hippocampal CA1 neurons in vitro demonstrated by sinusoidal current injection. J Neurophysiol. 1998;79:1592–1596. doi: 10.1152/jn.1998.79.3.1592. [DOI] [PubMed] [Google Scholar]
- 19.Mainen ZF, Sejnowski TJ. Reliability of spike timing in neocortical neurons. Science. 1995;268:1503–1506. doi: 10.1126/science.7770778. [DOI] [PubMed] [Google Scholar]
- 20.Nguyen QT, Wessel R, Kleinfeld D. Developmental regulation of active and passive membrane properties in rat vibrissa motoneurones. J Physiol. 2004;556:203–219. doi: 10.1113/jphysiol.2003.060087. [DOI] [PMC free article] [PubMed] [Google Scholar]
- 21.Nowak LG, Sanchez-Vives MV, McCormick DA. Influence of low and high frequency inputs on spike timing in visual cortical neurons. Cereb Cortex. 1997;7:487–501. doi: 10.1093/cercor/7.6.487. [DOI] [PubMed] [Google Scholar]
- 22.Parkis MA, Feldman JL, Robinson DM, Funk GD. Oscillations in endogenous inputs to neurons affect excitability and signal processing. J Neurosci. 2003;23:8152–8158. doi: 10.1523/JNEUROSCI.23-22-08152.2003. [DOI] [PMC free article] [PubMed] [Google Scholar]
- 23.Pike FG, Goddard RS, Suckling JM, Ganter P, Kasthuri N, Paulsen O. Distinct frequency preferences of different types of rat hippocampal neurones in response to oscillatory input currents. J Physiol. 2000;529(Pt 1):205–213. doi: 10.1111/j.1469-7793.2000.00205.x. [DOI] [PMC free article] [PubMed] [Google Scholar]
- 24.Reinker S, Puil E, Miura RM. Membrane resonance and stochastic resonance modulate firing patterns of thalamocortical neurons. J Comput Neurosci. 2004;16:15–25. doi: 10.1023/b:jcns.0000004838.67584.77. [DOI] [PubMed] [Google Scholar]
- 25.Richardson CA, Mitchell RA. Power spectral analysis of inspiratory nerve activity in the decerebrate cat. Brain Res. 1982;233:317–336. doi: 10.1016/0006-8993(82)91205-7. [DOI] [PubMed] [Google Scholar]
- 26.Sawczuk A, Powers RK, Binder MD. Spike frequency adaptation studied in hypoglossal motoneurons of the rat. J Neurophysiol. 1995;73:1799–1810. doi: 10.1152/jn.1995.73.5.1799. [DOI] [PubMed] [Google Scholar]
- 27.Schreiber S, Erchova I, Heinemann U, Herz AV. Subthreshold resonance explains the frequency-dependent integration of periodic as well as random stimuli in the entorhinal cortex. J Neurophysiol. 2004;92:408–415. doi: 10.1152/jn.01116.2003. [DOI] [PubMed] [Google Scholar]
- 28.Schreiber S, Fellous JM, Tiesinga P, Sejnowski TJ. Influence of ionic conductances on spike timing reliability of cortical neurons for suprathreshold rhythmic inputs. J Neurophysiol. 2004;91:194–205. doi: 10.1152/jn.00556.2003. [DOI] [PMC free article] [PubMed] [Google Scholar]
- 29.Sebe JY, van Brederode JF, Berger AJ. Inhibitory synaptic transmission governs inspiratory motoneuron synchronization. J Neurophysiol. 2006;96:391–403. doi: 10.1152/jn.00086.2006. [DOI] [PubMed] [Google Scholar]
- 30.Sejnowski TJ, Paulsen O. Network oscillations: emerging computational principles. J Neurosci. 2006;26:1673–1676. doi: 10.1523/JNEUROSCI.3737-05d.2006. [DOI] [PMC free article] [PubMed] [Google Scholar]
- 31.Smith A, Denny M. High-frequency oscillations as indicators of neural control mechanisms in human respiration, mastication, and speech. J Neurophysiol. 1990;63:745–758. doi: 10.1152/jn.1990.63.4.745. [DOI] [PubMed] [Google Scholar]
- 32.Smith GD, Cox CL, Sherman SM, Rinzel J. Fourier analysis of sinusoidally driven thalamocortical relay neurons and a minimal integrate-and-fire-or-burst model. J Neurophysiol. 2000;83:588–610. doi: 10.1152/jn.2000.83.1.588. [DOI] [PubMed] [Google Scholar]
- 33.Turker KS, Powers RK. The effects of common input characteristics and discharge rate on synchronization in rat hypoglossal motoneurones. J Physiol. 2002;541:245–260. doi: 10.1113/jphysiol.2001.013097. [DOI] [PMC free article] [PubMed] [Google Scholar]
- 34.Usrey WM, Reid RC. Synchronous activity in the visual system. Annu Rev Physiol. 1999;61:435–456. doi: 10.1146/annurev.physiol.61.1.435. [DOI] [PubMed] [Google Scholar]
- 35.Viana F, Bayliss DA, Berger AJ. Calcium conductances and their role in the firing behavior of neonatal rat hypoglossal motoneurons. J Neurophysiol. 1993;69:2137–2149. doi: 10.1152/jn.1993.69.6.2137. [DOI] [PubMed] [Google Scholar]
- 36.Viana F, Bayliss DA, Berger AJ. Repetitive firing properties of developing rat brainstem motoneurones. J Physiol. 1995;486(Pt 3):745–761. doi: 10.1113/jphysiol.1995.sp020850. [DOI] [PMC free article] [PubMed] [Google Scholar]