Abstract
Bacteria in the human oral cavity often grow in an attached multispecies biofilm community. Members of this community display defined interactions that have an impact on the physiology of the individual and the group. Here, we show that during coculture growth with streptococci, the oral pathogen Aggregatibacter actinomycetemcomitans displays enhanced resistance to killing by host innate immunity. The mechanism of resistance involves sensing of the streptococcal metabolite hydrogen peroxide by A. actinomycetemcomitans, which stimulates a genetic program resulting in enhanced expression of the complement resistance protein ApiA. The oxidative stress response regulator OxyR mediates induction of apiA transcription, and this induction is required for coculture resistance to killing by human serum. These findings provide evidence that interaction between community members mediates prokaryotic resistance to host innate immunity and reinforce the need to understand how polymicrobial growth affects interaction with the host immune system.
Keywords: Aggregatibacter, ApiA, complement, peroxide, Streptococcus gordonii
The Gram-negative bacterium Aggregatibacter actinomycetemcomitans is a common commensal of the human oral cavity and is a causative agent of localized aggressive periodontitis (1). A. actinomycetemcomitans inhabits the mammalian oral cavity beneath the gum line in an area between the tooth surface and the gingival epithelium known as the subgingival crevice (2). A consistent supply of nutrients is provided to the subgingival crevice by a serum exudate referred to as crevicular fluid (3) that passes through the gingiva and flows along the teeth (4–7). Oxygen levels within the subgingival crevice vary greatly, from microaerophilic conditions (2.1 kPa) in the “moderate” pockets (5–6 mm in depth) to near-anaerobic conditions (1.6 kPa) in the “deep” pockets (>6 mm in depth) (8). A. actinomycetemcomitans resides in the moderate pockets of the subgingival crevice and exhibits enhanced growth under microaerophilic conditions (9).
The mammalian oral cavity is home to a robust microbial community composed of many specialized microbes that are well adapted to growth in this environment. As with many complex communities, interactions between individual community members in the oral cavity have a significant impact on phenotypic aspects of the individuals as well as the group (10). Whether the subgingival crevice is healthy or diseased, A. actinomycetemcomitans often resides as a complex surface-associated (biofilm) microbial community, including several species from the genus Streptococcus, such as S. oralis, S. sanguis, S. mitis, and S. gordonii (10–13). These oral streptococci are typically nonpathogenic and rapidly consume sugars within the subgingival crevice, producing the metabolites lactic acid and hydrogen peroxide (H2O2). This physiological ability renders oral streptococci extremely competitive in the oral environment because they consume high-energy carbon sources and excrete metabolites that inhibit growth of neighboring microbes (14).
Our laboratory has pursued the idea that because it inhabits environments with oral streptococci (10–13), A. actinomycetemcomitans has adapted survival strategies for exposure to lactic acid and H2O2. Indeed, previous studies demonstrated that A. actinomycetemcomitans preferentially utilizes lactic acid over high-energy carbon sources, such as glucose, despite the fact that this bacterium grows significantly more slowly with lactic acid (15). The ability to preferentially use lactic acid not only eliminates caries-causing lactic acid from the oral environment but eliminates the need for A. actinomycetemcomitans to compete with the more numerous and rapidly growing oral streptococci for carbon (10). Instead, A. actinomycetemcomitans has evolved to use the streptococcal metabolic waste product lactic acid for carbon and energy.
Although our previous studies provided insight into the A. actinomycetemcomitans response to lactic acid, essentially nothing is known about how A. actinomycetemcomitans responds to the other primary metabolite of streptococci, H2O2. In this study, we examined the A. actinomycetemcomitans response to H2O2 by performing a transcriptome analysis of A. actinomycetemcomitans biofilms exposed to H2O2. In sharp contrast to other bacterial species, only 2 A. actinomycetemcomitans genes, katA and apiA, were differentially regulated on H2O2 exposure. In addition, these genes were regulated in a H2O2-dependent fashion during coculture with the oral bacterium S. gordonii. Induction of the outer membrane protein, ApiA, during coculture provided protection of A. actinomycetemcomitans from killing by human serum. Mechanistically, this enhanced protection was enacted by increased binding of the serum protein factor H by ApiA. These results indicate that bacterial resistance to killing by host innate immunity is enhanced during coculture and suggest that A. actinomycetemcomitans utilizes a streptococcal metabolite as a cue to an impending immune response.
Results
A. actinomycetemcomitans Transcriptional Response to H2O2.
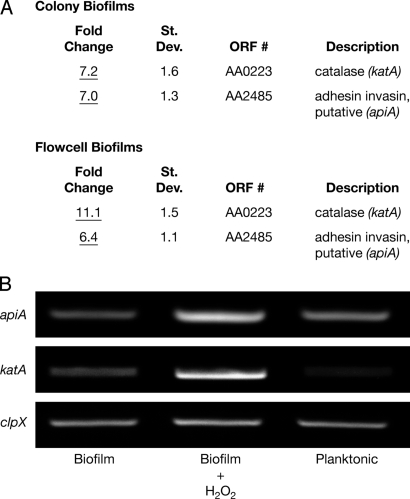
For gene expression analyses, A. actinomycetemcomitans was grown in a liquid-phase once-flow-through biofilm flow cell (16) and a solid-phase membrane-associated colony biofilm (17). A custom Affymetrix GeneChip microarray (15) was used to monitor gene expression of A. actinomycetemcomitans biofilms in the presence or absence of a sublethal concentration of H2O2. Of the approximate 1,800 genes (>90% of the total genes in A. actinomycetemcomitans) that exhibited detectable expression on the GeneChip, only 2 showed statistically significant, reproducible changes in both models on H2O2 exposure (Fig. 1A), and these results were verified using RT-PCR (Fig. 1B). This is in stark contrast to similar studies with other bacteria, in which 140–520 genes were differentially expressed on H2O2 exposure (18–23).
Fig. 1.
A. actinomycetemcomitans katA and apiA are induced on H2O2 exposure. (A) A custom Affymetrix GeneChip was used to examine gene expression of A. actinomycetemcomitans colony and flow cell biofilms in the presence and absence of 1 mM exogenous H2O2. Fold changes were determined from 4 pairwise comparisons and determined to be statistically different for katA and apiA (P < 0.05) using GeneChip Operating Software version 1.4. (B) RT-PCR was used to verify katA and apiA induction in colony biofilms on following exposure to H2O2. The constitutively expressed gene clpX was used to standardize cDNA template levels, and planktonic-grown bacteria were used to assess the impact of enhanced aeration on basal transcript levels.
The katA gene, which encodes a cytoplasmic catalase (KatA) that directly detoxifies H2O2 into O2 and H2O, was significantly upregulated in A. actinomycetemcomitans biofilms on exposure to H2O2. This was not surprising, because katA homologues in other bacteria are induced on exposure to H2O2 (18, 20, 23). More surprising was the H2O2-mediated induction of apiA. ApiA is a 33-kDa trimeric outer membrane protein (also referred to as Omp100) (24) that is 55% identical [using pairwise (p) BLAST] to the nonfimbrial adhesin protein YadA in Yersinia pestis and Yersinia enterolitica (25). Similar to YadA function in Yersinia, ApiA stimulates A. actinomycetemcomitans autoaggregation, assists translocation into host cells, and binds the human serum protein factor H (26, 27). Binding factor H inhibits serum complement activity and protects A. actinomycetemcomitans from killing by the alternative complement pathway (26). Although similar in function, yadA and its homologues in other organisms have not been shown to be induced by H2O2 at this time.
katA and apiA Are Induced During Coculture with S. gordonii.
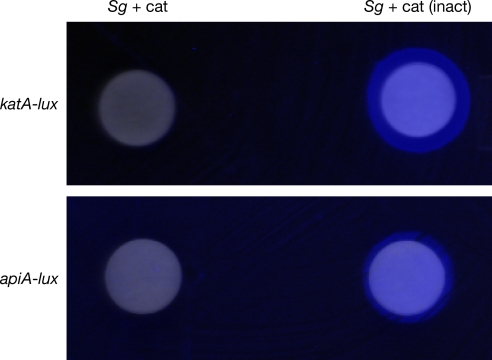
Although our results clearly show induction of katA and apiA by direct addition of the streptococcal metabolite H2O2, it was not clear if these genes were inducible during coculture with oral streptococci. To examine this, transcriptional fusions of the promoter regions of katA and apiA with the luminescence reporter genes luxCDABE were constructed. These reporter fusions allow the transcriptional activity of katA and apiA to be assessed by monitoring light production. To examine the impact of oral streptococci on katA and apiA transcription, A. actinomycetemcomitans carrying katA-luxCDABE and apiA-luxCDABE was spread on agar plates and light production was examined on exposure to disks containing the oral streptococci S. gordonii. To ensure that any luminescence induction was attributable to S. gordonii H2O2 production, 10,000 units of exogenous catalase (or heat-inactivated catalase as a control) was added to each disk. The presence of S. gordonii elicited an increase in both katA and apiA expression by A. actinomycetemcomitans (Fig. 2). This induction was dependent on H2O2, because addition of exogenous active catalase mitigated this response (Fig. 2). Induction of each reporter was also observed in planktonic coculture [Fig. S1].
Fig. 2.
katA and apiA are induced during coculture with S. gordonii. A. actinomycetemcomitans containing the katA-luxCDABE or apiA-luxCDABE reporter fusion was spread on agar Petri plates and exposed to S. gordonii–soaked disks containing active catalase (Sg + cat) or heat-inactivated catalase (Sg). Light production was examined using a Syngene imaging system. The image is a composite of visible light and luminescence (blue) photographs. Sterile paper disks did not induce light production by either reporter fusion (not shown).
OxyR Is Required for H2O2-Mediated Induction of katA and apiA.
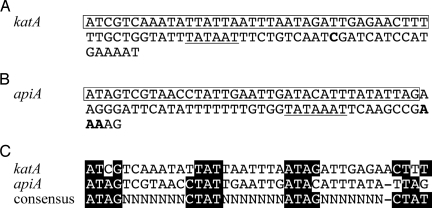
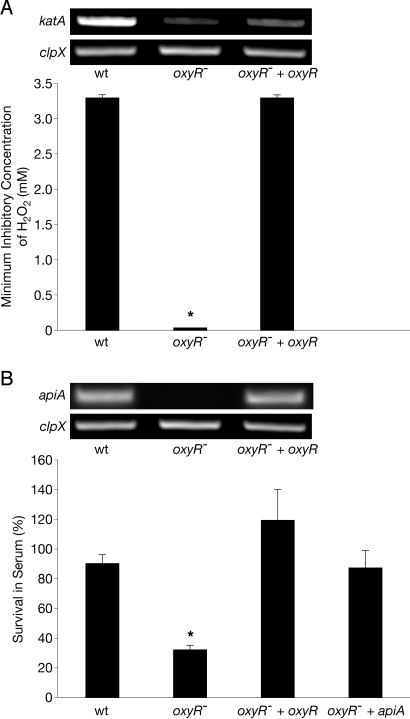
Many H2O2-responsive promoters possess operator sequences that bind the LysR-type transcriptional regulator OxyR (28). OxyR exhibits DNA binding activity after oxidation of 2 reactive cysteine residues by H2O2 and can act as an inducer or a repressor of transcription. The A. actinomycetemcomitans genome contains an oxyR-like sequence (ORF AA1513) that putatively encodes a protein with 72% identity (assessed by pBLAST) to Escherichia coli OxyR and shows conservation of both reactive cysteine residues (C199 and C208). To determine if the katA and apiA promoter regions contain potential OxyR binding sequences, primer extension was used to map the transcriptional start sites of these genes. The results indicate that the promoters of katA and apiA possess sequences, centered 46.5 and 58 bp upstream of the transcriptional start sites, respectively (Fig. 3 A and B), with significant similarity to the consensus OxyR binding sequence (Fig. 3C) ATAG-n7-CTAT-n7-ATAG-n7-CTAT (29, 30). These sequences suggested that OxyR was a regulator of katA and apiA transcription. To test this, oxyR was insertionally inactivated in A. actinomycetemcomitans and transcript levels of apiA and katA were measured in response to H2O2. Inactivation of oxyR abrogated the induction of apiA and katA by H2O2, and this activation was restored by expression of oxyR in trans (Fig. 4 A and B, Insets).
Fig. 3.
DNA sequences of the katA (base pairs 154293–154374) (A) and apiA (base pairs 1724157–1724078) (B) promoter regions. Transcription start sites are in boldface, putative −10 regions are underlined, and oxyR-like binding elements are boxed. (C) Alignment of the putative katA and apiA OxyR binding sequences with the consensus binding sequence (29, 30).
Fig. 4.
The A. actinomycetemcomitans oxyR− mutant is hypersusceptible to killing by H2O2 and human serum. (A) The H2O2 minimum inhibitory concentration (lowest concentration necessary to inhibit visible growth of an organism) of WT A. actinomycetemcomitans (wt), the A. actinomycetemcomitans oxyR− mutant (oxyR−), and the genetically complemented A. actinomycetemcomitans oxyR− mutant (oxyR− + oxyR). (Inset) RT-PCR analysis of mRNA levels of katA and the clpX constitutively expressed control in the wt oxyR−, and oxyR− + oxyR after H2O2 exposure. (B) Survival of wt, oxyR−, oxyR− + oxyR, and oxyR− constitutively expressing apiA (oxyR− + apiA) in the presence of 50% (vol/vol) normal human serum. Percent survival was calculated as follows: number of cells recovered from normal human serum treatment/number of cells recovered from heat-inactivated serum treatment. (Inset) RT-PCR analysis of mRNA levels of apiA and the clpX constitutively expressed control in the wt, oxyR−, and oxyR− + oxyR after H2O2 exposure. As a control, exogenous catalase was added to serum to ensure that any phenotype observed was not attributable to endogenous H2O2 within serum. Error bars represent SEM. *P < 0.004 via Student's t test, n = 3.
OxyR Is Critical for Resistance to H2O2 and Human Serum.
Based on the observation that OxyR regulates katA and apiA, we hypothesized that inactivation of oxyR would have a profound effect on A. actinomycetemcomitans survival on exposure to H2O2 or human serum. To test this hypothesis, we measured the survival of WT A. actinomycetemcomitans and the oxyR− mutant following exposure to H2O2 and human serum. Deletion of oxyR significantly decreased survival of A. actinomycetemcomitans on exposure to H2O2 and human serum, and expression of oxyR in trans restored survival to WT levels (Fig. 4 A and B). Although it is clear that katA is a critical component of H2O2 resistance in numerous bacteria (18–23, 29), it was not known if the decrease in serum resistance was attributable to decreased levels of apiA. To test this possibility, apiA was constitutively expressed in the oxyR− mutant (27). Constitutive expression of apiA restored serum survival of the oxyR− mutant to WT levels (Fig. 4B), suggesting that apiA dysregulation was responsible for enhanced serum killing in this mutant. As expected, expression of apiA had no effect on the sensitivity of the oxyR− mutant to H2O2 (data not shown). These results demonstrate that the oxidative stress regulator OxyR is necessary for induction of a gene involved in complement defense in A. actinomycetemcomitans.
Coculture Enhances Resistance of A. actinomycetemcomitans to Alternative Complement Pathway Killing.
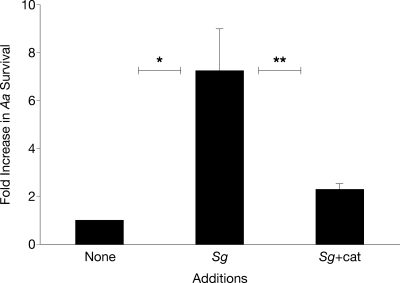
Based on the observation that apiA transcription was enhanced during coculture, we hypothesized that coculture with S. gordonii would enhance A. actinomycetemcomitans resistance to serum killing. To test this, A. actinomycetemcomitans serum survival was assessed during coculture with S. gordonii in the presence of heat-inactivated or active catalase. Coculture with S. gordonii enhanced survival of A. actinomycetemcomitans to human serum by ≈7-fold (Fig. 5), clearly demonstrating enhanced survival of A. actinomycetemcomitans during coculture. The presence of active catalase mitigated this increase in survival, implicating S. gordonii H2O2 production as the key mediator of this phenotype (Fig. 5).
Fig. 5.
Coculture with S. gordonii enhances A. actinomycetemcomitans resistance to killing by human serum. Fold increase in survival of A. actinomycetemcomitans on exposure to 50% (vol/vol) normal human serum when grown in monoculture (Aa), coculture with S. gordonii + heat-inactivated catalase (Aa+Sg), and coculture with S. gordonii + catalase (Aa+Sg+cat). Ratios were calculated as follows: colony-forming units present after serum treatment/colony-forming units present after heat-inactivated serum treatment. Error bars represent SEM. It is important to note that cell numbers were similar with and without catalase in the heat-inactivated complement cultures. *P < 0.01, **P < 0.05 via Student's t test, n = 3.
Coculture Enhances Factor H Binding to the A. actinomycetemcomitans Cell Surface.
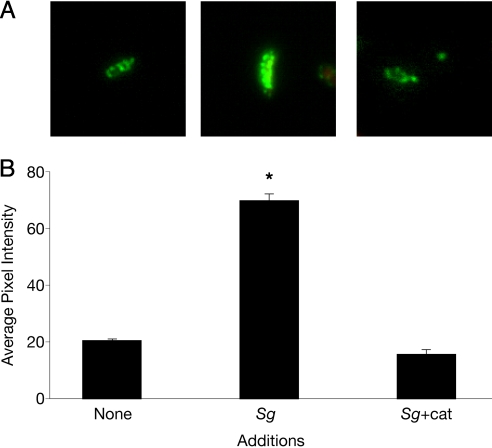
From a mechanistic standpoint, it was not clear how induction of apiA expression during coculture enhanced resistance to serum. Clues were provided by Asakawa et al. (26), who recently demonstrated that ApiA binds the human complement regulatory protein factor H. Factor H is a complement control protein that circulates in human serum, and when bound to cells, it inhibits the alternative pathway of complement activation. Because apiA is induced during coculture, we reasoned that the levels of factor H bound to the A. actinomycetemcomitans outer surface would be increased during coculture with S. gordonii. To examine this, immunofluorescence staining with an anti-factor H antibody was used to quantify the levels of factor H bound to the A. actinomycetemcomitans outer surface during monoculture and coculture growth. Our results revealed that ≈4-fold more factor H was bound to A. actinomycetemcomitans during coculture with S. gordonii as compared with monoculture conditions (Fig. 6). This enhanced binding of factor H during coculture was mitigated by the addition of active catalase, indicating that, as expected, H2O2 was the critical cue mediating increased binding.
Fig. 6.
Factor H displays enhanced binding to A. actinomycetemcomitans during coculture with S. gordonii. (A) Immunofluorescent micrographs of factor H attachment to the surface of A. actinomycetemcomitans during monoculture (Aa), coculture with S. gordonii + heat-inactivated catalase (Aa+Sg), and coculture with S. gordonii + catalase (Aa+Sg+cat). Images were recorded at magnification ×1,000. (B) Average green channel fluorescence intensity per cell. Averages were calculated from 40 independent measurements. Error bars represent SEM. *P < 0.0001 via Student's t test.
Discussion
A. actinomycetemcomitans is a common commensal of the mammalian oral cavity, where it resides in a complex microbial community within the subgingival crevice. The subgingival crevice is distinct from the exposed tooth surface and poses several challenges for A. actinomycetemcomitans growth and survival, including competition with faster growing bacteria for nutrients; the presence of antimicrobial serum proteins such as immunoglobins, complement, and antimicrobial peptides (6, 31, 32); and the presence of high levels of metabolites produced by other members of the microbial community. Two of the most prominent microbial metabolites produced in the oral cavity are lactic acid and H2O2. As observed with lactic acid (15), our results demonstrate that A. actinomycetemcomitans displays a unique response to H2O2 exposure. It is intriguing that only 2 A. actinomycetemcomitans genes exhibited a significant change in gene expression on exposure to H2O2 (Fig. 1). This contrasts with transcriptome studies in many other aerobically or microaerophilically grown bacteria, which have shown large numbers of genes (140–520) differentially regulated in response to H2O2 (18–23). Many of the H2O2-responsive genes identified in these previous studies, such as DNA repair proteins and superoxide dismutases, are expressed by A. actinomycetemcomitans but are not responsive to H2O2, suggesting that these genes may be constitutively expressed in A. actinomycetemcomitans as an adaptation to frequent H2O2 exposure.
The H2O2 response was observed not only on exogenous addition of H2O2 but during coculture with the H2O2-producing oral bacterium S. gordonii (Fig. 2 and Fig. S1). Not surprisingly, A. actinomycetemcomitans displayed enhanced production of the H2O2-consuming enzyme catalase during coculture. This response has been observed previously in several bacterial species and serves to enhance resistance to H2O2 (18–23, 29). More intriguing was the finding that A. actinomycetemcomitans also induces the outer membrane protein ApiA during coculture. Because ApiA provides protection from killing by the alternative complement component of innate immunity (26), our data represent a demonstration of a metabolic cue produced by one bacterium mediating enhanced resistance to a component of host innate immunity by another. It should be noted that the mechanism of complement inhibition, namely, enhanced binding of the serum protein factor H (Fig. 6), not only protects the bacterium from the alternative complement pathway but significantly decreases complement-mediated opsonic uptake and killing by host phagocytic cells (33). Thus, it is likely that the impact of coculture on A. actinomycetemcomitans resistance to innate immune effectors extends beyond our observations of protection from the alternative complement pathway.
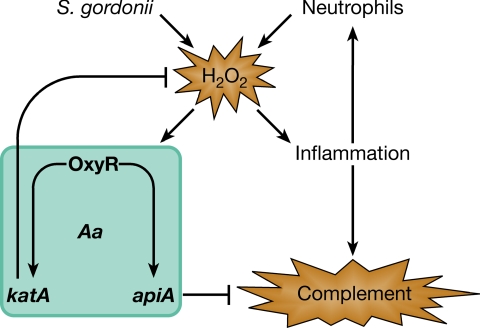
Based on murine studies, it is likely that A. actinomycetemcomitans is exposed to H2O2 produced by streptococci in the oral cavity (14). Why would A. actinomycetemcomitans respond to H2O2 by enhancing resistance to complement killing? Although the answer is unknown, in vitro studies reveal that as oral streptococci numbers increase, the levels of streptococcal H2O2 increase because of the accumulation of lactic acid (34). This has been shown to have critical consequences in several nonoral in vivo models, because H2O2 produced by streptococci (35, 36), in combination with other factors such as lipoteichoic acids (37, 38), induces significant inflammation. Inflammation leads to increased vascular permeability, influx of serum, and recruitment of neutrophils to the subgingival crevice (3). In the context of these previous studies, we propose a model (Fig. 7) in which enhanced levels of streptococcal H2O2 produced during early inflammation stimulate a more robust immune response, followed by an influx of innate immune modulators. A. actinomycetemcomitans responds to rising H2O2 by enhancing resistance to innate immune effectors. In this sense, A. actinomycetemcomitans utilizes H2O2 as an anticipatory signal for an enhanced immune response.
Fig. 7.
Model for the role of H2O2 as a mediator of A. actinomycetemcomitans resistance to innate immunity. Enhanced levels of H2O2 produced by S. gordonii during plaque growth stimulate inflammation, leading to an influx of innate immune modulators, including complement and neutrophils. A. actinomycetemcomitans responds to rising H2O2 by induction of katA and apiA, which, in turn, enhance resistance to innate immune effectors. On recruitment to the site of inflammation, neutrophils increase the levels of H2O2 and further stimulate induction of katA and apiA.
Of course, streptococci are not the only source of H2O2 in the subgingival crevice. Another source is host tissues, which produce endogenous H2O2 from the mitochondria during aerobic respiration (39, 40). Based on the fact that host tissues produce significantly lower levels of H2O2 compared with S. gordonii (34, 39, 40) and that most of the host peroxide is likely scavenged by host catalase, we predict that endogenous H2O2 production has little impact on A. actinomycetemcomitans gene expression. This is likely not the case for neutrophils, which produce high levels of H2O2 on recruitment to the site of inflammation (41, 42). Thus, during gingival inflammation, A. actinomycetemcomitans also faces high levels of neutrophil-produced H2O2. Our model (Fig. 7) predicts that before significant neutrophil recruitment to the subgingival crevice, neutrophil H2O2 likely has little impact on A. actinomycetemcomitans gene expression. Instead, we predict that during early inflammation, streptococcal H2O2 will be the primary stimulant for enhanced production of ApiA and KatA. This initial stimulation by streptococcal H2O2 will augment the inflammatory response (35, 36) and stimulate recruitment of neutrophils to the subgingival crevice. We propose that the initial A. actinomycetemcomitans response to streptococcal H2O2 not only provides resistance to the influx of alternative complement during inflammation but likely provides resistance to neutrophil-produced H2O2. During these latter stages of inflammation, neutrophil H2O2 may also serve as an additional stimulus to A. actinomycetemcomitans to enhance expression of katA and apiA. Of course, this model requires vigorous in vivo testing in the future; however, these studies are significantly hampered by the lack of a robust primate model.
Our results demonstrate that A. actinomycetemcomitans uses the S. gordonii metabolite H2O2 as a cue to induce expression of katA and apiA, whose products aid in defense against host innate immunity. These findings suggest that A. actinomycetemcomitans may use H2O2 as an indicator of an impending host innate immune response in vivo and provide a description of a polymicrobial interaction that influences resistance to host innate immunity. There is considerable interest in understanding how pathogenic microbes evade host innate immunity. In fact, there is substantial effort aimed at developing therapeutics to enhance the effectiveness of the innate immune response (43). Such studies have focused on treatment of monoculture infections, despite the observation that many infections are polymicrobial. Our results clearly show that interaction between 2 prominent oral bacteria significantly affects killing by host innate immunity and reinforce the idea that understanding how polymicrobial interactions affect resistance to innate immunity is critical when examining interactions with the host immune system.
Materials and Methods
Strains and Media.
A. actinomycetemcomitans strains VT1169 (44), Y4 (45), S. strain Challis DL1.1 (ATCC 49818), E. coli DH5α, and E. coli SM10 were used in this study. A. actinomycetemcomitans strains were grown in brain heart infusion medium, tryptic soy broth + 0.5% yeast extract (TSBYE), or chemically defined medium (CDM) with 20 mM glucose (15). Culture conditions were at 37 °C in a 10% (vol/vol) CO2 atmosphere with shaking at 165 rpm unless otherwise indicated. E. coli strains were grown on LB at 37 °C. Where applicable, antibiotics were used at the following concentrations: chloramphenicol at 2 μg/mL for selection and maintenance in A. actinomycetemcomitans and at 20 μg/mL for selection and maintenance in E. coli. In both A. actinomycetemcomitans and E. coli, spectinomycin was used at 50 μg/mL for selection and at 10 μg/mL for maintenance, and streptomycin was used at 50 μg/mL for selection and at 20 μg/mL for maintenance.
DNA and Plasmid Manipulations.
DNA and plasmid isolations were performed using standard methods (46).
GeneChip and RT-PCR Analysis.
For flow cell biofilm experiments, cells were grown in 20% (vol/vol) TSBYE medium in a once-flow-through biofilm flow cell as described (47). Biofilms were allowed to mature for 18 h, and TSBYE, with or without 1 mM H2O2, was then added for 30 min. To harvest biofilm cells, the coverslip was removed from the flow cell with a razorblade and vortexed for 1 min in 20 mL of RNALater to remove attached cells. For colony biofilms, 105 cells were spotted onto a UV-sterilized 0.2-μm polycarbonate membrane on 10 mL of solid CDM containing 1.5% (vol/vol) agarose in a 100-mm Petri dish. Cells were then grown for 32 h at 37 °C in a 10% (vol/vol) CO2 atmosphere. The membranes were transferred to identical Petri plates and incubated for 2 h before being transferred to another Petri plate containing CDM with or without the addition of 1 mM H2O2. After 20 min, the membranes were transferred into 20 mL of RNALater. Cells were harvested from the membranes by gentle vortexing in the RNALater solution for ≈2 min until no cells visibly remained on the membrane. RNA isolation, preparation of labeled cDNA, and processing of the A. actinomycetemcomitans GeneChip microarrays were performed as described previously (48). Data analysis was performed using GeneChip Operating Software version 1.4 (Affymetrix). RT-PCR was performed as described (47) with the following changes: 100 ng of RNA was used for cDNA synthesis, 1 ng of cDNA was used as a template in the katA and apiA PCR reactions, and 5 ng of cDNA was used as a template in the clpX PCR. RT-PCR primers are included in SI Text. Planktonic A. actinomycetemcomitans was grown to the midexponential phase (OD600 = 0.4) and mixed 1:1 with RNALater before RNA purification.
Primer Extension.
Primer extension was performed as previously described (49). Primers used were apiA-PE (5′-tctttagcccaatgcattgacaga-3′) and katA-PE (5′-catggtgttgtcattatcca-3′). The sizes of primer extension products were determined at the University of Oklahoma Health Science Center sequencing core facility.
Luminescence Reporter Assays.
A total of 107 A. actinomycetemcomitans carrying either the apiA-luxCDABE or katA-luxCDABE reporter (reporter construction described in SI Text) was spread evenly over the surface of a TSBYE agar plate and grown overnight at 37 °C. Two 0.6-cm paper disks containing 107 S. gordonii were added to each A. actinomycetemcomitans–coated TSBYE agar plate. One disk received 10,000 U of bovine catalase (Sigma), and the other disk received 10,000 U of heat-killed catalase. The plates were incubated for an additional 4 h at 37 °C before imaging each for 15 min with a Syngene G:Box (Syngene) imaging system.
Construction and Complementation of an oxyR− Mutant in A. actinomycetemcomitans.
Construction and complementation of the oxyR− mutant were performed as previously described (15) and are detailed in SI Text.
Serum Sensitivity Factor H Binding.
A. actinomycetemcomitans serum sensitivity was determined as previously described (26) with minor modifications. Details of this method can be found in SI Text. A. actinomycetemcomitans and S. gordonii cocultures were grown as described for the serum sensitivity assay described previously. After 30 min of coculture, 100 μL of human serum was added to 900 μL of coculture and incubated at 37 °C for 30 min. Cells were collected by centrifugation at 5,000 × g for 10 min, and cell pellets were resuspended in 100% (vol/vol) ice-cold methanol and fixed at −20 °C for 2 h. After fixing, cells were stained as described (50) using 1:1,000 mouse anti-human factor H antibody (Santa Cruz Biotechnology) and 1:1,000 Alexa-488 goat anti-mouse (Invitrogen) secondary antibody. Images were captured at a magnification ×1,000 using a Nikon 50i microscope, 100 × 1.4NA PLAN APO lens, Nikon DS-2MBW digital camera, and Nikon NIS-Elements D 3.0 software.
Supplementary Material
Acknowledgments.
We thank members of the Whiteley laboratory for critical discussion of this manuscript. We also thank Dr. Charles Schachtele, who was instrumental in our discussions and fostered our interest and enthusiasm in oral microbiology. This work was partially supported by Grant 5P20RR081741 from the National Institutes of Health (to M.W.).
Footnotes
The authors declare no conflict of interest.
This article is a PNAS Direct Submission.
This article contains supporting information online at www.pnas.org/cgi/content/full/0809533106/DCSupplemental.
References
- 1.Meyer DH, Fives-Taylor PM. Oral pathogens: from dental plaque to cardiac disease. Curr Opin Microbiol. 1998;1:88–95. doi: 10.1016/s1369-5274(98)80147-1. [DOI] [PubMed] [Google Scholar]
- 2.Ebersole JL, Cappelli D, Sandoval MN. Subgingival distribution of A. actinomycetemcomitans in periodontitis. J Clin Periodontol. 1994;21:65–75. doi: 10.1111/j.1600-051x.1994.tb00282.x. [DOI] [PubMed] [Google Scholar]
- 3.Courts FJ, Boackle RJ, Fudenberg HH, Silverman MS. Detection of functional complement components in gingival crevicular fluid from humans with periodontal diseases. J Dent Res. 1977;56:327–331. doi: 10.1177/00220345770560032001. [DOI] [PubMed] [Google Scholar]
- 4.Biswas S, Duperon DF, Chebib FS. Study of crevice fluid in relation to periodontal disease in children. II. Effect of age, sex and gingival inflammation on crevice fluid protein, carbohydrate, total calcium, phosphate and nitrogen. J Periodontal Res. 1977;12:265–278. doi: 10.1111/j.1600-0765.1977.tb00130.x. [DOI] [PubMed] [Google Scholar]
- 5.Ficara AJ, Levin MP, Grower MF, Kramer GD. A comparison of the glucose and protein content of gingival fluid from diabetics and nondiabetics. J Periodontal Res. 1975;10:171–175. doi: 10.1111/j.1600-0765.1975.tb00022.x. [DOI] [PubMed] [Google Scholar]
- 6.Marcotte H, Lavoie MC. Oral microbial ecology and the role of salivary immunoglobulin A. Microbiol Mol Biol Rev. 1998;62:71–109. doi: 10.1128/mmbr.62.1.71-109.1998. [DOI] [PMC free article] [PubMed] [Google Scholar]
- 7.Yamaguchi M, et al. Non-invasive monitoring of gingival crevicular fluid for estimation of blood glucose level. Medical & Biological Engineering & Computing. 2004;42:322–327. doi: 10.1007/BF02344706. [DOI] [PubMed] [Google Scholar]
- 8.Loesche WJ, Gusberti F, Mettraux G, Higgins T, Syed S. Relationship between oxygen tension and subgingival bacterial flora in untreated human periodontal pockets. Infect Immun. 1983;42:659–667. doi: 10.1128/iai.42.2.659-667.1983. [DOI] [PMC free article] [PubMed] [Google Scholar]
- 9.Ohta H, et al. Microaerophilic property of Actinobacillus actinomycetemcomitans in fructose-limited chemostat cultures. FEMS Microbiol Lett. 1996;136:191–196. [Google Scholar]
- 10.Kolenbrander PE, et al. Communication among oral bacteria. Microbiol Mol Biol Rev. 2002;66:486–505. doi: 10.1128/MMBR.66.3.486-505.2002. [DOI] [PMC free article] [PubMed] [Google Scholar]
- 11.Paster BJ, et al. Bacterial diversity in human subgingival plaque. J Bacteriol. 2001;183:3770–3783. doi: 10.1128/JB.183.12.3770-3783.2001. [DOI] [PMC free article] [PubMed] [Google Scholar]
- 12.Syed SA, Loesche WJ. Bacteriology of human experimental gingivitis: Effect of plaque age. Infect Immun. 1978;21:821–829. doi: 10.1128/iai.21.3.821-829.1978. [DOI] [PMC free article] [PubMed] [Google Scholar]
- 13.Yang HW, Huang YF, Chan Y, Chou MY. Relationship of Actinobacillus actinomycetemcomitans serotypes to periodontal condition: Prevalence and proportions in subgingival plaque. Eur J Oral Sci. 2005;113:28–33. doi: 10.1111/j.1600-0722.2004.00192.x. [DOI] [PubMed] [Google Scholar]
- 14.Hillman JD, Shivers M. Interaction between wild-type, mutant and revertant forms of the bacterium Streptococcus sanguis and the bacterium Actinobacillus actinomycetemcomitans in vitro and in the gnotobiotic rat. Arch Oral Biol. 1988;33:395–401. doi: 10.1016/0003-9969(88)90196-3. [DOI] [PubMed] [Google Scholar]
- 15.Brown SA, Whiteley M. A novel exclusion mechanism for carbon resource partitioning in Aggregatibacter actinomycetemcomitans. J Bacteriol. 2007;189:6407–6414. doi: 10.1128/JB.00554-07. [DOI] [PMC free article] [PubMed] [Google Scholar]
- 16.Christensen BB, et al. Molecular tools for study of biofilm physiology. Methods Enzymol. 1999;310:20–42. doi: 10.1016/s0076-6879(99)10004-1. [DOI] [PubMed] [Google Scholar]
- 17.Walters MC, 3rd, Roe F, Bugnicourt A, Franklin MJ, Stewart PS. Contributions of antibiotic penetration, oxygen limitation, and low metabolic activity to tolerance of Pseudomonas aeruginosa biofilms to ciprofloxacin and tobramycin. Antimicrob Agents Chemother. 2003;47:317–323. doi: 10.1128/AAC.47.1.317-323.2003. [DOI] [PMC free article] [PubMed] [Google Scholar]
- 18.Chang W, Small DA, Toghrol F, Bentley WE. Global transcriptome analysis of Staphylococcus aureus response to hydrogen peroxide. J Bacteriol. 2006;188:1648–1659. doi: 10.1128/JB.188.4.1648-1659.2006. [DOI] [PMC free article] [PubMed] [Google Scholar]
- 19.Mostertz J, Scharf C, Hecker M, Homuth G. Transcriptome and proteome analysis of Bacillus subtilis gene expression in response to superoxide and peroxide stress. Microbiology. 2004;150:497–512. doi: 10.1099/mic.0.26665-0. [DOI] [PubMed] [Google Scholar]
- 20.Palma M, DeLuca D, Worgall S, Quadri LE. Transcriptome analysis of the response of Pseudomonas aeruginosa to hydrogen peroxide. J Bacteriol. 2004;186:248–252. doi: 10.1128/JB.186.1.248-252.2004. [DOI] [PMC free article] [PubMed] [Google Scholar]
- 21.Stohl EA, Criss AK, Seifert HS. The transcriptome response of Neisseria gonorrhoeae to hydrogen peroxide reveals genes with previously uncharacterized roles in oxidative damage protection. Mol Microbiol. 2005;58:520–532. doi: 10.1111/j.1365-2958.2005.04839.x. [DOI] [PMC free article] [PubMed] [Google Scholar]
- 22.Zeller T, Moskvin OV, Li K, Klug G, Gomelsky M. Transcriptome and physiological responses to hydrogen peroxide of the facultatively phototrophic bacterium Rhodobacter sphaeroides. J Bacteriol. 2005;187:7232–7242. doi: 10.1128/JB.187.21.7232-7242.2005. [DOI] [PMC free article] [PubMed] [Google Scholar]
- 23.Zheng M, et al. DNA microarray-mediated transcriptional profiling of the Escherichia coli response to hydrogen peroxide. J Bacteriol. 2001;183:4562–4570. doi: 10.1128/JB.183.15.4562-4570.2001. [DOI] [PMC free article] [PubMed] [Google Scholar]
- 24.Komatsuzawa H, et al. Identification of six major outer membrane proteins from Actinobacillus actinomycetemcomitans. Gene. 2002;288:195–201. doi: 10.1016/s0378-1119(02)00500-0. [DOI] [PubMed] [Google Scholar]
- 25.El Tahir Y, Skurnik M. YadA, the multifaceted Yersinia adhesin. Int J Med Microbiol. 2001;291:209–218. doi: 10.1078/1438-4221-00119. [DOI] [PubMed] [Google Scholar]
- 26.Asakawa R, et al. Outer membrane protein 100, a versatile virulence factor of Actinobacillus actinomycetemcomitans. Mol Microbiol. 2003;50:1125–1139. doi: 10.1046/j.1365-2958.2003.03748.x. [DOI] [PubMed] [Google Scholar]
- 27.Yue G, Kaplan JB, Furgang D, Mansfield KG, Fine DH. A second Aggregatibacter actinomycetemcomitans autotransporter adhesin exhibits specificity for buccal epithelial cells in humans and Old World primates. Infect Immun. 2007;75:4440–4448. doi: 10.1128/IAI.02020-06. [DOI] [PMC free article] [PubMed] [Google Scholar]
- 28.Zheng M, Aslund F, Storz G. Activation of the OxyR transcription factor by reversible disulfide bond formation. Science. 1998;279:1718–1721. doi: 10.1126/science.279.5357.1718. [DOI] [PubMed] [Google Scholar]
- 29.Hishinuma S, Yuki M, Fujimura M, Fukumori F. OxyR regulated the expression of two major catalases, KatA and KatB, along with peroxiredoxin, AhpC in Pseudomonas putida. Environ Microbiol. 2006;8:2115–2124. doi: 10.1111/j.1462-2920.2006.01088.x. [DOI] [PubMed] [Google Scholar]
- 30.Toledano MB, et al. Redox-dependent shift of OxyR-DNA contacts along an extended DNA-binding site: A mechanism for differential promoter selection. Cell. 1994;78:897–909. doi: 10.1016/s0092-8674(94)90702-1. [DOI] [PubMed] [Google Scholar]
- 31.Sugita N, et al. Differential expression of CR3, Fc epsilon RII and Fc gamma RIII on polymorphonuclear leukocytes in gingival crevicular fluid. J Periodontal Res. 1993;28:363–372. doi: 10.1111/j.1600-0765.1993.tb01080.x. [DOI] [PubMed] [Google Scholar]
- 32.Suzuki T, Sugita N, Yoshie H, Hara K. Presence of activated eosinophils, high IgE and sCD23 titers in gingival crevicular fluid of patients with adult periodontitis. J Periodontal Res. 1995;30:159–166. doi: 10.1111/j.1600-0765.1995.tb01268.x. [DOI] [PubMed] [Google Scholar]
- 33.Neeleman C, et al. Resistance to both complement activation and phagocytosis in type 3 pneumococci is mediated by the binding of complement regulatory protein factor H. Infect Immun. 1999;67:4517–4524. doi: 10.1128/iai.67.9.4517-4524.1999. [DOI] [PMC free article] [PubMed] [Google Scholar]
- 34.Barnard JP, Stinson MW. Influence of environmental conditions on hydrogen peroxide formation by Streptococcus gordonii. Infect Immun. 1999;67:6558–6564. doi: 10.1128/iai.67.12.6558-6564.1999. [DOI] [PMC free article] [PubMed] [Google Scholar]
- 35.Hoffmann OM, Becker D, Weber JR. Bacterial hydrogen peroxide contributes to cerebral hyperemia during early stages of experimental pneumococcal meningitis. J Cereb Blood Flow Metab. 2007;27:1792–1797. doi: 10.1038/sj.jcbfm.9600474. [DOI] [PubMed] [Google Scholar]
- 36.Duane PG, Rubins JB, Weisel HR, Janoff EN. Identification of hydrogen peroxide as a Streptococcus pneumoniae toxin for rat alveolar epithelial cells. Infect Immun. 1993;61:4392–4397. doi: 10.1128/iai.61.10.4392-4397.1993. [DOI] [PMC free article] [PubMed] [Google Scholar]
- 37.Takeuchi O, et al. Differential roles of TLR2 and TLR4 in recognition of gram-negative and gram-positive bacterial cell wall components. Immunity. 1999;11:443–451. doi: 10.1016/s1074-7613(00)80119-3. [DOI] [PubMed] [Google Scholar]
- 38.Kruidenier L, Verspaget HW. Review article: Oxidative stress as a pathogenic factor in inflammatory bowel disease—radicals or ridiculous? Aliment Pharmacol Ther. 2002;16:1997–2015. doi: 10.1046/j.1365-2036.2002.01378.x. [DOI] [PubMed] [Google Scholar]
- 39.Boveris A, Chance B. The mitochondrial generation of hydrogen peroxide. General properties and effect of hyperbaric oxygen. Biochem J. 1973;134:707–716. doi: 10.1042/bj1340707. [DOI] [PMC free article] [PubMed] [Google Scholar]
- 40.Boveris A, Oshino N, Chance B. The cellular production of hydrogen peroxide. Biochem J. 1972;128:617–630. doi: 10.1042/bj1280617. [DOI] [PMC free article] [PubMed] [Google Scholar]
- 41.Nathan CF, Silverstein SC, Brukner LH, Cohn ZA. Extracellular cytolysis by activated macrophages and granulocytes. II. Hydrogen peroxide as a mediator of cytotoxicity. J Exp Med. 1979;149:100–113. doi: 10.1084/jem.149.1.100. [DOI] [PMC free article] [PubMed] [Google Scholar]
- 42.Root RK, Metcalf J, Oshino N, Chance B. H2O2 release from human granulocytes during phagocytosis. I. Documentation, quantitation, and some regulating factors. J Clin Invest. 1975;55:945–955. doi: 10.1172/JCI108024. [DOI] [PMC free article] [PubMed] [Google Scholar]
- 43.Finlay BB, Hancock RE. Can innate immunity be enhanced to treat microbial infections? Nat Rev Microbiol. 2004;2:497–504. doi: 10.1038/nrmicro908. [DOI] [PubMed] [Google Scholar]
- 44.Mintz KP, Fives-Taylor PM. impA, a gene coding for an inner membrane protein, influences colonial morphology of Actinobacillus actinomycetemcomitans. Infect Immun. 2000;68:6580–6586. doi: 10.1128/iai.68.12.6580-6586.2000. [DOI] [PMC free article] [PubMed] [Google Scholar]
- 45.Thomson VJ, Bhattacharjee MK, Fine DH, Derbyshire KM, Figurski DH. Direct selection of IS903 transposon insertions by use of a broad-host-range vector: Isolation of catalase-deficient mutants of Actinobacillus actinomycetemcomitans. J Bacteriol. 1999;181:7298–7307. doi: 10.1128/jb.181.23.7298-7307.1999. [DOI] [PMC free article] [PubMed] [Google Scholar]
- 46.Ausubel FM. Short Protocols in Molecular Biology: A Compendium of Methods from Current Protocols in Molecular Biology. New York: Wiley; 2002. [Google Scholar]
- 47.Ramsey MM, Whiteley M. Pseudomonas aeruginosa attachment and biofilm development in dynamic environments. Mol Microbiol. 2004;53:1075–1087. doi: 10.1111/j.1365-2958.2004.04181.x. [DOI] [PubMed] [Google Scholar]
- 48.Schuster M, Lostroh CP, Ogi T, Greenberg EP. Identification, timing, and signal specificity of Pseudomonas aeruginosa quorum-controlled genes: A transcriptome analysis. J Bacteriol. 2003;185:2066–2079. doi: 10.1128/JB.185.7.2066-2079.2003. [DOI] [PMC free article] [PubMed] [Google Scholar]
- 49.Lloyd AL, Marshall BJ, Mee BJ. Identifying cloned Helicobacter pylori promoters by primer extension using a FAM-labelled primer and GeneScan analysis. J Microbiol Methods. 2005;60:291–298. doi: 10.1016/j.mimet.2004.10.009. [DOI] [PubMed] [Google Scholar]
- 50.Wang Q, Suzuki A, Mariconda S, Porwollik S, Harshey RM. Sensing wetness: A new role for the bacterial flagellum. EMBO J. 2005;24:2034–2042. doi: 10.1038/sj.emboj.7600668. [DOI] [PMC free article] [PubMed] [Google Scholar]
Associated Data
This section collects any data citations, data availability statements, or supplementary materials included in this article.


