Abstract
Magnetoacoustic tomography with magnetic induction (MAT-MI) is a recently introduced method for imaging tissue electrical impedance properties by integrating magnetic induction and ultrasound measurements. In the present study, we have developed a focused cylindrical scanning mode MAT-MI system and the corresponding reconstruction algorithms. Using this system, we demonstrated 3-dimensional MAT-MI imaging in a physical phantom, with cylindrical scanning combined with ultrasound focusing, and the ability of MAT-MI in imaging electrical conductivity properties of biological tissue.
Noninvasive electrical impedance imaging of biological tissue has drawn considerable interest in recent years because it has been observed that changes in the electrical impedance are associated with physiological and pathological properties of tissue. Relevant methods in this field include electrical impedance tomography (EIT),1,2 magnetic resonance electrical impedance tomography (MREIT),3,4 magnetic induction tomography (MIT),5 and magneto-acoustic tomography (MAT).6,7 Among them, both EIT and MIT have to solve the ill-posed inverse problems based on surface measurements, thus having limited spatial resolution. MREIT can provide high spatial resolution with the aid of MRI measurements, but is still limited by its need of relatively high current injection levels. MAT uses electrical stimulation for an object placed under a static magnetic field and provides a way of estimating tissue properties from electrical-acoustic coupling. What remains to be seen is MAT's ability to image electrical impedance with high spatial resolution. Recently, magneto-acoustic tomography with magnetic induction (MAT-MI)8,9 was proposed to achieve high spatial resolution noninvasive electrical impedance imaging by integrating magnetic induction and ultrasonic measurements. In MAT-MI, the object is placed in a static magnetic field and a time-varying magnetic field. The time-varying magnetic field induces eddy current in the object volume. Following that, the eddy current in the static magnetic field causes vibrations due to the Lorentz force and emits ultrasound waves. These ultrasound waves are collected by transducers surrounding the object and reconstruction of the conductivity properties is obtained with a spatial resolution close to that of sonography. In the present study, we have developed a focused cylindrical scanning mode MAT-MI system and the corresponding reconstruction algorithms and demonstrated its ability to perform 3-dimension (3D) MAT-MI imaging in a physical phantom and its ability to image conductivity properties in biological tissue.
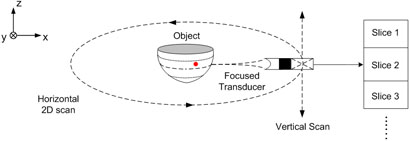
Fig. 1 shows the schematic diagram illustrating the concept of the 3D MAT-MI using a focused cylindrical scanning mode. Through ultrasound focusing in the Z direction, we can localize the acoustic sources in a specific XY plane. A 2-dimensional (2D) MAT-MI image can be obtained over the cross section of the 3D object on the specific XY plane where the acoustic sensors are focused. Furthermore, vertical scans in the Z direction can provide a stack of 2D images, thus achieving a 3D impedance image of the object. Under this configuration, the MAT-MI reconstruction algorithm can be derived as following.
FIG. 1.
Schematic diagram of the focused cylindrical scanning mode MAT-MI for 3-dimensional imaging.
In MAT-MI, the Lorentz force acting on the induced eddy current in the object is he driving force which generates the ultrasound signals.9 Considering a pulsed time-varying magnetic stimulation, the wave equation becomes
| 1 |
where is the acoustic pressure; c is the acoustic speed in the media, which is assumed to be acoustically homogeneous; is the induced eddy current density; is the static magnetic field. δ(t) is a delta function in time which indicates the short radio frequency pulse employed in the magnetic stimulation.
Defining as the acoustic source and taking the Fourier transform on variable t'=ct, the wave equation can then be expressed as
| 2 |
Considering a surface, S0, that encloses the sample volume, V, the acoustic pressure signal measured at position on the surface S0 can be given as
| 3 |
where is Green's function. In the focused cylindrical scanning mode of MAT-MI, however, this 3D volume integration can be simplified to a 2D surface integration in the focal XY plane at a specific z0. Therefore, considering this XY plane, the acoustic source can be derived11 in the cylindrical coordinates (ρ, φ, z0) as
| 4 |
where is the complex conjugate of and l0 is the line of integration corresponding to the scanning track of the transducer in the focal XY plane. Taking the inverse Fourier transform, we can then reconstruct the acoustic source from the acoustic pressure measurements in the time domain
| 5 |
Beside the focused cylindrical scanning mode MAT-MI, this reconstruction algorithm can also be applied if the object is uniform in the Z direction and an unfocused flat transducer with large aperture is used to collect signals in a 2D circular orbit.
Additionally, we can also use a simpler method to reconstruct a 2D image slice if the distance between the acoustic source and the transducer is much larger than the dimension of the object. In this case, the acoustic wavefront in the focal XY plane in the object can be approximated as a crossing line parallel to the transducer surface. Therefore, the acoustic signal received by the transducer at a certain time point can be considered as the summation of signals from a crossing line of the object parallel to the transducer surface. As the acoustic signal value at one time point can be considered to be proportional to one ray beam projection passing through one crossing line of the object, the reconstruction algorithm of parallel ray beam can be used in our MAT-MI experiment based on the principle of back projection. In such case, we can have a simplified reconstruction algorithm as
| 6 |
Here represents the distribution of the total acoustic sources including the direct MAT-MI acoustic source and the scattered acoustic sources caused by the inhomogeneous media. An image reconstructed using Eq. (6) reflects the combined features of both the MAT-MI acoustic sources and acoustic scattering, while an image reconstructed using Eq. (5) represents the distribution of the MAT-MI acoustic sources associated with the electrical conductivity of the object.
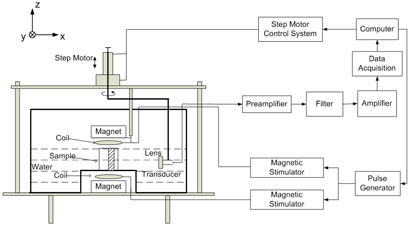
The system setup in the present experiment is shown in Fig. 2. The ultrasound transducer was immersed in distilled water. The employed transducer was a 500 KHz flat single element transducer with 29mm diameter (Panametrics, 513080). Ultrasound focusing was implemented by adding an acoustic lens before the transducer. This transducer was mounted to a frame and can scan around the sample in a horizontal plane (the XY plane) to collect ultrasound signals from different angles. The scanning radius was approximately 150mm and the scanning angular range was from 1° to 330° with 1.25° scanning step. In addition, the transducer can move in the vertical direction (the Z direction) with a 5mm scanning step. A home-made magnetic stimulator, which has a nine-turn coil with a radius of 40mm, was used to deliver magnetic pulses. In the present study, the stimulating pulse width was 1-μs with a pulse repetition frequency of 140-Hz. In order to get a more uniform time-varying magnetic field, two coils were placed symmetrically above and below the sample. This creates a Helmholtz coil, which produces a region with a nearly uniform magnetic field. According to the measured electrical current in one of the stimulating coils, the magnetic flux density at the center of the sample was estimated to be 0.015T. In order to get a stronger and more uniform static magnetic field, magnets were also placed above and below the sample. Each magnet (36.5mm in radius) was placed 2 cm away from the sample and created a 0.1T static magnetic field near the sample. A computer controlled pulse generator was used to send trigger signals to the magnetic stimulator. After each stimulating pulse, signals from the transducer were amplifier 90dB and recorded for 400 microseconds. The amplified signals were sampled at 5MHz using a data acquisition system (NI PCI6111), and averaged 50,000 times to increase Signal-to-Noise Ratio (SNR).
FIG. 2.

Setup of the experimental system.
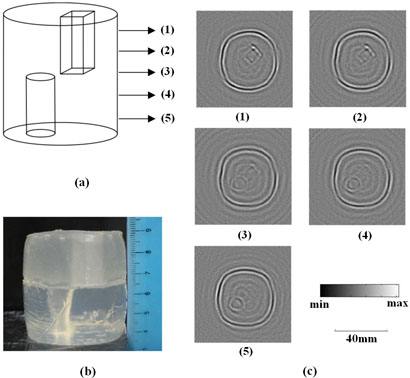
To demonstrate the feasibility of the proposed focused cylindrical scanning mode MAT-MI in 3D imaging, an experiment study was conducted on a 3D gel phantom and the results are shown in Fig. 3. In this experiment, the ultrasound signal we collected was centered at 500 KHz, making its wavelength in water about 3mm. This indicates that the effective resolution in each layer is 3 mm. At the same time, because the beam width (6dB) of the focused transducer is 7mm, it indicates that the vertical resolution of the system is 7 mm. As shown in Fig. 3(a), the cylindrical shaped gel phantom is composed of two parts. The upper part has a 1cm×1cm×2.5cm cubic shaped hole on the right side and the lower part has a 1cm in diameter by 2.5cm high cylindrical shaped hole on the left side. Fig. 3(b) is a photo of the phantom. This gel phantom is made of gel with 10% salinity. During the imaging process the two holes were filled with vegetable oil with a much lower conductivity than the surrounding gel. Fig. 3(c) shows five slices of the 2D MAT-MI images collected at five successive layers from top to bottom. All of the images are reconstructed using Eq. (5). The distance between each layer is 5mm. From Fig. 3 it can be seen that the reconstructed MAT-MI images are consistent with the 3D geometry of the phantom. In the first two slices, only a rectangular shape is clearly seen, which corresponds to the top part of the phantom. In the third slice, which is the middle layer containing the cubic and cylindrical structures, both shapes can be seen. In the fourth slice, as the scanning position moves lower, a clear circle with an indistinct rectangle are reconstructed. Only the circular structure is visible in the fifth slice.
FIG. 3.
(a) Skeleton drawing of a cylinder-shaped gel phantom with a 1cm×1cm×2.5cm cubic hole and a 1cm diameter by 2.5cm high cylindrical hole. The gel has 10% salinity and the holes were filled with vegetable oil during the imaging process. Numbers (1)-(5) indicate scanning positions. (b) Photo of the gel phantom. (c) MAT-MI images collected at positions (1)-(5) corresponding to those indicated in (a).
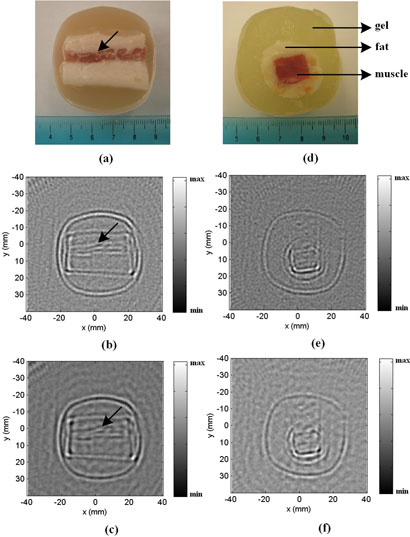
Using this system, we also conducted an imaging study on a tissue phantom. However, due to limited signal strength of the current MAT-MI system, tissue phantoms with nearly uniform distribution in the Z direction were utilized and the flat transducer was used directly without the addition of the focusing lens. In this setup, the acoustic measurement can be considered to be the summation of signals from many similar slices. Also, because the tissue sample is uniform in the Z direction, the reconstruction algorithms in Eq. (5) and Eq. (6) can be applied and only one 2D MAT-MI image is reconstructed for each sample. Fig. 4 shows the 2D MAT-MI imaging results of two tissue phantoms. Figs. 4(a)–(c) are the imaging results of a salt pork tissue phantom. The phantom was composed of a piece of salted pork (1.2g sodium per 56g salted pork) placed in a plastic cup filled with gel. Figs. 4(d)–(f) are the results of a tissue phantom made from fresh pork muscle and fat. As shown in Fig. 4(d), the inner part of the phantom is a block of pork muscle (13mm by 10mm) and the outer part is cylindrically shaped pork fat with a diameter of 25mm. The surrounding portion is animal gelatin. Figs. 4 (b) and (e) are reconstructed images of the two phantoms using Eq. (5), which is more accurate in the reconstruction of the MAT-MI acoustic sources (the divergence of the Lorentz force) within the tissue samples. Figs. 4 (c) and (f) are reconstructed images using Eq. (6) which represent the distribution of the total acoustic sources in the samples. As shown in Fig. 4, the reconstructed images using either method are consistent with the tissue phantom geometry. Because the conductivity of muscle tissue is quite different from that of fat tissue, the boundaries between these two types of tissue are clearly seen in the reconstructed images. For example, in Figs. 4(a)-(c), a thin muscle layer can be identified in the reconstructed images (marked by the arrows).
FIG. 4.
(a) Photo of a salt pork tissue sample. (b) and (c) are reconstructed MAT-MI images of the tissue sample in (a) using the reconstruction algorithms listed in Eq. (5) and Eq. (6) respectively. (d) Photo of a pork tissue sample composed of a block of pork muscle embedded in a cylindrical fat layer. The surrounding material is animal gelatin. (e) and (f) are reconstructed MAT-MI images of the pork tissue sample in (d) using Eq. (5) and Eq. (6) respectively.
For the 3D MAT-MI, in order to increase the resolution in the elevation direction (the Z direction), a focused transducer with a narrower beam width should be used. In addition, since the collected acoustic signals are restrained in one single slice, more gain in signal strength is needed to obtain high resolution 3D MAT-MI images in biological tissue.
In conclusion, we have developed a focused cylindrical scanning mode MAT-MI system and the corresponding reconstruction algorithms. We have demonstrated the 3D MAT-MI imaging in a physical phantom by cylindrical scanning combined with ultrasound focusing. Using the present MAT-MI system, we have demonstrated, for the first time, the ability of MAT-MI to image the conductivity properties of biological tissue.
Acknowledgments
This work was supported in part by NSF BES-0602957, BES-0411898, BES-0411480, and NIH R01EB00178.
REFERENCES
- 1.Paulson K, Lionheart W, Pidcock M. IEEE Trans. Med. Imag. 1993;12:681. doi: 10.1109/42.251118. [DOI] [PubMed] [Google Scholar]
- 2.Metheral P, Barber DC, Smallwood RH, Brown BH. Nature. 1996;380:509. doi: 10.1038/380509a0. [DOI] [PubMed] [Google Scholar]
- 3.Joy M, Scott G, Henkelman M. Magnetic Resonance Imaging. 1989;7:89. doi: 10.1016/0730-725x(89)90328-7. [DOI] [PubMed] [Google Scholar]
- 4.Kwon O, Woo E, Yoon J, Seo JK. IEEE Trans. Biomed. Eng. 2002;49:160. doi: 10.1109/10.979355. [DOI] [PubMed] [Google Scholar]
- 5.Peyton AJ, Yu ZZ, Lyon G, Al-Zeibak S, Ferreira J, Velez J, Linhares F, Borges AR, Xiong HL, Saunders NH, Beck MS. Measurement Science and Technology. 1996;7:261. [Google Scholar]
- 6.Towe BC, Islam MR. IEEE Trans. Biomed. Eng. 1988;35:892. doi: 10.1109/10.7300. [DOI] [PubMed] [Google Scholar]
- 7.Roth BJ, Basser PJ, Wikswo JP., Jr IEEE Trans. Biomed. Eng. 1994;41:723. doi: 10.1109/10.310087. [DOI] [PubMed] [Google Scholar]
- 8.Xu Y, He B. Physics in Medicine and Biology. 2005;50:5175. doi: 10.1088/0031-9155/50/21/015. [DOI] [PMC free article] [PubMed] [Google Scholar]
- 9.Li X, Xu Y, He B. J. Appl. Phys. 2006;99:066112. doi: 10.1063/1.2186371. [DOI] [PMC free article] [PubMed] [Google Scholar]
- 10.Xu M, Xu Y, Wang LH. IEEE Trans. Biomed. Eng. 2003;50:1086. doi: 10.1109/TBME.2003.816081. [DOI] [PubMed] [Google Scholar]


