

Abstract
The metabolic effects of leptin may involve both centrally and peripherally mediated actions with a component of the central actions potentially independent of alterations in food intake. Ob/ob mice have significant abnormalities in lipid metabolism, correctable by leptin administration. We used ob/ob mice to study the relative importance of the subtypes of actions of leptin (central vs peripheral; food intake dependent vs independent) on lipid metabolism. Mice were treated for 3 days with leptin, either centrally (ICV) or peripherally (IP), and compared with mice pair-fed to the leptin-treated mice (PF) and with ad libitum fed controls (C). All treatment groups (ICV, IP, PF) showed indistinguishable changes in liver weight, hepatic steatosis, hepatic lipidomic profile and circulating free fatty acids, triglycerides and cholesterol lipoprotein profile. Changes in the expression of genes involved in lipogenesis and fatty acid oxidation in liver, muscle and white fat were broadly similar in IP, ICV and PF groups. Leptin (both ICV and IP) stimulated expression of both mitochondrial and peroxisomal acyl-coenzyme A oxidase (liver) and PPARα (skeletal muscle) to an extent not replicated by pair feeding. Leptin had profound effects on peripheral lipid metabolism but the majority were explained by its effects on food intake. Leptin had additional centrally mediated effects to increase the expression of a limited number of genes concerned with fatty acid oxidation. While we cannot exclude direct peripheral effects of leptin on certain aspects of lipid metabolism we were unable to detect any such effects on the parameters measured in this study.
Keywords: Leptin, lipid metabolism, lipoprotein, lipogenesis, steatosis
Introduction
Leptin is an adipocyte-derived hormone which plays a critical role in the regulation of energy homeostasis. Animals congenitally deficient in leptin, in addition to being hyperphagic, hypometabolic and obese, have a wide range of abnormalities in macronutrient metabolism including disordered handling of carbohydrates, lipids and proteins (1-3). These include elevation of circulating free fatty acids, raised triglycerides, an increase in both LDL and HDL cholesterol and marked hepatic steatosis.
Compelling data indicate that leptin acts through the central nervous system to regulate food intake and energy expenditure (reviewed in(4, 5).
Leptin has also been reported to have profound effects on carbohydrate and lipid metabolism that may, at least in part, be independent of its centrally mediated effects on energy balance (reviewed in (6, 7). Indeed, in the decade since the first report of a specific lipid depleting effect of leptin (8)there has been a wealth of experiments attempting to discern the extent and nature of the direct effects of leptin on peripheral tissues (9-12).
However, many of these studies have used in vitro or ex vivo preparations in a hormonal milieu somewhat removed from that seen in vivo, making it difficult to place the data within a proper physiological context.
In this study we have used the well-established abnormalities of peripheral lipid metabolism in the ob/ob mouse as an experimental tool to more rigorously examine two questions. Firstly, to what extent are the beneficial effects of leptin on the lipid metabolism in ob/ob mice mediated through central vs peripheral mechanisms? Secondly, if acting through the central nervous system, what are the relative contributions of effects on suppression of food intake vs food intake independent mechanisms in the mediation of these effects? In order to address these questions we compared the effects of three days of leptin administered intraperitoneal (IP) with a much smaller dose administered centrally (ICV), both doses resulting in equivalent degrees of suppression of food intake. We also studied a sham injected group of ob/ob mice that were pair-fed to the leptin-treated group. We compared plasma lipid and lipoprotein levels, hepatic fatty acid composition measured by gas chromatography coupled to mass spectrometry (GC-MS) and the expression of lipogenic and lipolytic genes in liver, muscle and three different white adipose tissue depots.
Leptin therapy is increasingly being employed in human disorders of congenital and acquired leptin deficiency, with in some cases dramatic therapeutic impact on dyslipidaemia. To be able to fully understand and potentially develop these findings further, there is a need to have a clear and precise understanding of this aspect of the biology of leptin.
Material and Methods
Animal experiments
8 weeks old ob/ob mice (Harlan, Oxon, UK) were single housed throughout the study. All mice were maintained under controlled temperature (22°C) and on a 12-h light, 12-h dark schedule (light on 7:00-19:00). Food and water were available ad libitum unless otherwise stated. All protocols were in accordance with the United Kingdom Home Office.
To allow ICV injection, on day 0 all mice underwent stereotaxic surgery to place an indwelling guide cannula into the lateral ventricle. Mice were anaesthetized with a mix of inhaled isoflurane and oxygen and a 26 gauge steel guide cannula (internal diameter 0.24 mm, outer diameter 0.46 mm, length 2mm (Semat International, Herts, UK) was implanted into the right lateral ventricle using the following co-ordinates: 1.0 mm lateral from bregma, 0.5 mm posterior to bregma. The guide cannula was secured to the skull using quick-drying cyanoacrylate glue and a dental cement (Associated Dental Products, Wiltshire, UK) and a dummy cannula was inserted. All animals received analgesia (Rimadyl, 5 mg/kg, Pfizer Animal Health, Kent,UK) and antibiotic (Teramycin LA, 60 mg/kg, Pfizer Animal Health, Kent, UK) before being returned to their home cage.
Following surgery, food intake and body weight were measured daily. Only mice which maintained their pre-surgery body weight were studied further.
Leptin administration
On day 7, mice were divided into four experimental groups (n= 6 per group). All mice received a 2 μl injection icv plus a 200μl injection ip injection at the same times (every 12 hrs, first injection started at the onset of light cycle on day 7). The injection scheme for each groups were as follow: ICV group; icv-1μg leptin, ip-saline; IP group: icv-saline, ip- 1mg/kg body weight leptin; PF group: icv-saline, ip–saline; control group: icv-saline, ip-saline. Recombinant murine leptin was obtained from AMGEN (Thousand Oaks, CA, USA).
Pair feeding group was feed with the average food intake of the ICV and IP group that was equal to 4.2g and 2.5g respectively on day 7 and 8.
After the 5th injection (day 9), all food was withdrawn from all mice and sacrificed 4 hours later. Blood was collected by cardiac puncture, allowed to clot and then spun for 10 mins. Serum was frozen and stored until further analysed. Tissues were dissected (skeletal muscle= quadriceps), weighed, frozen on dry ice and then stored at −80°C until analysed.
Plasma lipid analyses
Enzymatic assay kits were used for determination of plasma free fatty acids (Roche Diagnostics, West Sussex, UK) and total triglycerides (Sigma-Aldrich, St. Louis, MO). Plasma lipoproteins were fractionated by gel filtration on two Superose 6 columns (GE Healthcare, Little Chalfont, UK) connected in series and cholesterol level was evaluated in each individual fraction by using a enzymatic assay for cholesterol measurement kit (BioMerieux, Marcy l'Etoile, France).
Fatty acid profile analysis by GCMS
Frozen liver (100 mg wet weight) was ground in liquid nitrogen and lipids were extracted using methanol and chloroform in a 2:1 ratio. After vortexing and sonication (15 min), 200μl of chloroform and 200μl of water were added to the sample. After centrifugation (1min, 10 000 RPM), the lower layer (lipid layer) was collected and evaporated. The lipid pellet was resuspended in 250μl Methanol:Choloroform (1:1) and 125μl of BF3. The mixture was heated for 90 min at 90°C then cooled down. The lower phase was dried and analyzed by GC-MS.
The derivatised organic metabolites were injected onto a ZB-WAX column (30m × 0.25 mm ID × 0.25 μm df; 100% polyethylene glycol). The initial column temperature was 60 °C; this was held for 2 min then increased by 10 °C min−1 to 150 °C and then by 4 °C min−1 up to a temperature of 230 °C where it was held for 7 min.
The column eluent was introduced into a Trace DSQ quadrupole mass spectrometer (Thermo Electron Corporation) (transfer line temperature= 310 °C for aqueous metabolites and 240 °C for lipid metabolites, ion source temperature= 250 °C, electron beam= 70eV). The detector was turned on after a solvent delay of 240 s and data was collected in full scan mode using 3 scans s−1 across a mass range of 50-650 m/z.
GC-MS chromatograms were analysed using Xcalibur, (v. 2.0, Thermo Fisher Corp), integrating each peak individually. Deconvolution of overlapping peaks was achieved by generating traces of selected ions. A 0.1 minute threshold window was used for the deviation of peaks away from the predicted retention time across the data set. Structures were assigned using both the NIST database of mass spectra and analysis of standard compounds (e.g. FAME standard from Sepulcho, SigmaAldrich. UK).
RNA analysis
Total RNA was purified using STAT60 (Iso-text Diagnostics, Friendswood TX) according to the manufacturer's instructions. Real-time quantitative PCR was used to analyze RNA from tissues. Total RNA (500 ng) was reverse-transcribed and real-time quantitative PCR performed on TaqMan 7900 Sequence Detection System (Applied Biosystems, Warrington, UK). Primers were designed using the Primer Express 2.0 software (Sequence available on request). Cyclophilin mRNA was used as control to normalize gene expression.
Statistics
All data are reported as mean ± SEM. All data set were analysed for statistical significance using Student's t test (Microsoft Excel) * p<0.05, ** p<0.01 and *** p<0.001.
Results
Central and peripheral leptin administration results in a comparable reduction in food intake and weight loss over 3 days
In order to assess the central versus peripheral mechanism of action of leptin on plasma lipid metabolism, leptin was administered twice daily to ob/ob mice either via ICV (1μg) or IP (1mg/Kg of body weight) for 3 days. At this dose, no leptin was detectable in the circulation after ICV treatment (data not shown).
Both central and peripheral leptin treatment led to a significant but comparable reduction on food consumption compared to saline controls (IP: 2.5 ± 1.2g; ICV: 1.5 ± 0.8g; Control: 6.0 ± 0.8g/day, p<0.001; Fig1 A). A third group of ob/ob mice was food restricted to the level that leptin treated mice consumed (pair-fed). The reduction in percentage of body weight seen was similar across the three groups (7.0 +/− 3.0 vs I 8.0 +/−2.5 vs 8.0+/− 1.8%, IP vs ICV vs PF, respectively, p<0.001 compare to control; Fig1 B).
Figure 1. Effect of leptin treatment on daily food intake (A) and body weight (B).

Body weight is expressed as the percentage of body weight recorded one day prior to the onset of treatment (day 6). *= p < 0.05; ** = p < 0.01; *** = p < 0.001.
Effects of central and peripheral leptin administration on plasma triglyceride and fatty acid concentrations
At the end of the treatment period, serum triglyceride (TG) and free fatty acid (FFA) levels were measured (Fig 2). Compared to sham treated controls, all three intervention groups showed a significant and similar reduction in TG (2.54±0.6 vs 1.12±0.2 vs 1.28±0.3 vs 1.40±0.3mg/dl, Control vs ICV vs IP vs PF, respectively) and FFA (1.51±0.2 vs 0.94±0.34vs 1.02±0.12 vs 1.06±0.20μmol/l, ICV vs IP vs PF, respectively). These equate to a halving in TG concentration and a reduction in FFA by more than three fold.
Figure 2. Plasma lipids parameters in leptin treated ob/ob mice.
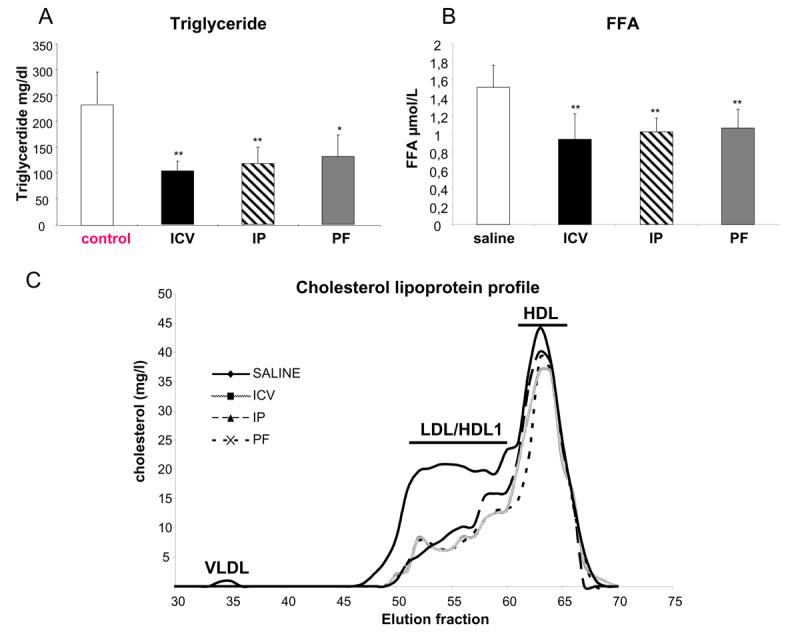
Triglycerides (A) and Free Fatty acids (B) in mice treated with leptin centrally ( ICV), peripherally (IP), pair fed to food intake of leptin treatment (PF) or sham treated ad libitum fed animals (control). *= p < 0.05; ** =p < 0.01
It has been reported that cholesterol metabolism in ob/ob mice is markedly impaired leading to an accumulation of LDL/HDL particles and that leptin treatment can significantly improve the dyslipidaemic profile. We therefore analysed the effects of central vs peripheral leptin administration on plasma cholesterol in various lipoprotein fractions using gel filtration (Fig 2C). Cholesterol levels in the LDL/HDL1 fraction were reduced by ∼50% in leptin treated groups (ICV and IP) compared to sham treated control ob/ob mice. Interestingly, a similar effect was observed after food restriction in PF group. VLDL cholesterol levels were detectable in Control mice but were rendered undetectable in ICV, IP and PF groups.
Effects of central and peripheral leptin administration on hepatic lipid metabolism
Liver weight (Fig 3A) was decreased significantly by all three treatments compared to control ((liver weight/total body weight)×100: 6.3±0.43 vs 7.2±0.50 vs 7.3 ±0.47 vs 8.3±0.6 mg/g, ICV vs IP vs PF vs Control, respectively, p<0.01(ICV), p<0.05 (IP and PF)). Of note, the effect seen within the ICV group was significant greater than that seen in the IP and PF groups.
Figure 3. Leptin act on lipogenesis and beta-oxidation in the liver.

Liver weight expressed in the percentage of liver weight normalised to the total body weight (A), mRNA levels of adipogenic genes (B), genes involved in beta oxidation (C) and cholesterol metabolism (D), are measured by quantitative real time PCR. The levels are normalised by cyclophylin mRNA levels and expressed in fold change compare to control sham group.
We undertook lipidomic analysis of liver fatty acid composition using GCMS in all three treatment groups and control mice (Table1). No change was seen in myristic (C14) or oleic (C18:1) acid concentration. Central and peripheral leptin treatments as well as food restriction had similar effects to markedly reduce eicosenopic (C20:1) and slightly reduce palmitic (C16) concentrations. Concentrations of docohexanoic (C22:6), arahdonic (C20:4), linoleic (C18:2) and, to a lesser extent, stearic (C18) acids were increased equally in all three treatment groups.
Table 1. Liver fatty acid content.
| Saline | ICV | IP | PF | |
|---|---|---|---|---|
| Myristic : C14 | 0,72±0,13 | 0,67±0,1 | 0,79±0,13 | 0,68±0,17 |
| Palmitic : C16 | 20,25±3,4 | 17,13±3,87 | 17,97±1,24 | 17,48±3 |
| Palmitoleic: :C16:1 | 3,92±0,43 | 3,42±0,37 | 3,97±0,48 | 3,45±0,7 |
| Stearic : C18 | 3,84±0,3 | 4,64±1,21 | 4,74±0,43 | 4,57±1,1 |
| Oleic : C18:1 | 35,16±6,07 | 33,26±5,18 | 35,85±4,97 | 37,09±4,53 |
| Linoleic : C18:2 | 6,78±0,88 | 9,1±1,55* | 8,93±1,06* | 8,69±1,19* |
| Eicosenoic : C20:1 | 4,18±2,78 | 1,69±0,85* | 1,64±0,84* | 1,44±0,9* |
| Arachidonic : C20:4 | 1,6±0,26 | 2,36±0,62* | 2,45±0,41* | 2,08±0,46* |
| Docosahexanoic : C22:6 | 1,76±0,2 | 2,98±1* | 3,16±0,63* | 2,68±0,91* |
Relative level of fatty acid: The value described to each FA is a relative value calculated by comparing amount of each FA to total amount of FA (*100).
p < 0.05
We examined the mRNA levels encoding key lipogenic genes in liver homogenates from the three treatment groups and controls (Fig 3B). mRNA levels for Acetyl-CoA carboxylase (ACC) and Fatty Acid Synthase (FAS) were markedly reduced (60% reduction for ACC, 80% reduction for FAS) in all three treatment groups with no differences between groups. Similarly, mRNA levels of stearoyl-Coenzyme A desaturase 1 (SDC-1) was decreased by central and peripheral leptin administration and pair fed to a similar degree in comparison to sham saline treated controls (ICV: 75%, IP: 65%, PF: 75 %). In contrast, we did not detect any significant effect of any treatment on sterol receptor binding protein 1c (SREBP1c) mRNA levels, a key transcription factor in the regulation of the lipogenesis pathway.
As leptin has been shown to regulate beta-oxidation in the liver, we also assessed the effect of leptin treatment on the expression of genes implicated in beta-oxidation (Fig 3C). mRNA levels encoding acetyl-Coenzyme A acetyltransferase 1 (ACAT1- an enzyme which catalyzes the reversible formation of acetoacetyl-CoA from two molecules of acetyl-CoA) and carnitine palmitoyl transferase 1 (CPT1- the transporter which allows the entrance of fatty acids into the mitochondria) were increased equally in ICV, IP and PF groups. The expression of PPARα and medium chain acyl-Coenzyme A dehydrogenase (MCAD) which catalyzes one step of beta-oxidation pathway) was not modified by leptin treatment (data not shown). Notably mRNA levels encoding both acyl-CoA oxidase (ACOX) isoforms a key enzyme involved in fatty acid catabolism, were significantly increased (50% increase for the peroxisomal isoform and 65% increase for the mitochondrial isoform) after both ICV and IP leptin treatment but were not significantly increased by food restriction.
Finally, we analysed the expression of some of the key enzymes in cholesterol metabolism (Fig 3D). The expression of 3-hydroxy-3-methylglutaryl-coenzyme A reductase (HMGCoA reductase: the key enzyme involved in the de novo synthesis of cholesterol) was down regulated (60% decrease, p<0.001) by both leptin treatment and food restriction. We measured apoA1 mRNA, the main component of HDL and a key player in cholesterol efflux, and found that central and peripheral leptin treatment increased apoA1 expression by two fold. Comparable changes were seen in the PF group.
Effects of central and peripheral leptin administration on gene expression in skeletal muscle
Previous data have indicated that leptin may have a direct effect upon β-oxidation in muscle. In each of our treatment groups we therefore also measured the expression levels of several genes involved in beta-oxidation: the muscle specific isoform of CPT1 (CPT1muscle), ACOX and MCAD (Fig 4A). None were significantly regulated by leptin treatment. However, in skeletal muscle, the expression of PPARα, a nuclear receptor which plays a key role in regulation of beta-oxidation, was increased by 80% with both central and peripheral leptin treatment compared to sham treated controls (p<0.05). This effect was not seen in the PF, suggesting that the effect of leptin on PPARα expression in skeletal muscle was independent of food intake.
Figure 4. Effect of leptin in white adipose tissue and muscle.

mRNA levels of genes involved in lipogenesis and beta oxidation in muscle (A), gonadal (B), subcutaneous (C) and mesenteric (D) white adipose tissue are measured by quantitative real time PCR. The levels are normalised by cyclophylin mRNA levels and expressed in fold change compare to control sham group. *= p < 0.05; **= p < 0.001
Effects of central and peripheral leptin administration on gene expression in white adipose tissue
We measured the expression of a number of lipogenic genes in three different white adipose tissue (WAT) depots: gonadal, mesenteric and subcutaneous fat. In all three depots, FAS and ACC gene expression was reduced by central and peripheral leptin administration as well as by food restriction. SCD-1 expression in the different WAT depots was not affected either by leptin treatment or food restriction. SREBP1-c expression was reduced in gonadal fat in the three treatment groups compared to sham-treated Controls but this reached statistical significance (p<0.05) only in ICV and IP and not PF animals. Nonetheless, the expression levels of SREBP1c were not significantly different in PF versus ICV and IP treated mice in any of the other fat depots studied. Finally, in mesenteric fat only, which is considered as the most oxidative adipose tissue, CPT1 expression was increased whereas in the other adipose tissue depots none of the genes implicated in beta-oxidation in liver and muscle appeared to be regulated by leptin.
Discussion
The primacy of the central action of leptin in the control of energy balance, in particular in the control of food intake, is widely accepted (13, 14).
However, there are data supporting the idea that leptin can modulate intermediate metabolism via a direct action upon peripheral tissues. In particular, leptin has been reported to have a marked and specific lipid depleting effect quite independent of any of its centrally mediated effects on food intake (10, 12)
To directly compare the central versus peripheral effects of leptin on peripheral lipid metabolism we have given a physiologically relevant dose of the hormone to leptin-naive ob/ob mice for a sufficient period to observe relevant effects and used an appropriate pair-fed control group.
The vast majority of the effects on parameters of plasma, hepatic, muscle and white adipose tissue lipid metabolism following peripheral administration of leptin were identical to those seen following central leptin treatment. In addition, changes seen with leptin treatment were mostly indistinguishable from those seen in sham-treated animals pair fed to mice treated with leptin, indicating that many of the changes seen with leptin treatment over 3 days occur through a centrally mediated reduction in food intake. In liver, muscle and white adipose tissue, leptin acted primarily to repress lipogenesis with a smaller increase in the expression of enzymes involved in beta-oxidation.
Several previous animal (1-3) and human studies (15) have reported the effects of leptin upon lipid metabolism. In this current study we also demonstrate that leptin treatment, either centrally or peripherally, is sufficient to decrease plasma TG and FFA levels by approximately 50% and suppress the characteristic high LDL/HDL1-cholesterol profile. As this effect was also seen in PF ob/ob mice this effect seems to be largely dependent on the anorectic effects of leptin. This finding contrasts with a recent study in lean rats (16) where a reduced plasma TG was observed following 7 days of central leptin treatment but not in pair-fed rats. This difference may reflect species-specific effects, differences in time course or dose-response relationships
Liver weights of the ob/ob mice were significantly decreased with leptin administered either centrally or peripherally (17), consistent with previously reports. Previous data have also suggested that leptin can act directly on the liver to increase lipid oxidative metabolism (12) with the acute effects of systemically delivered leptin upon liver TG levels not replicated by ICV leptin (18). However, in our study, we clearly observed that central leptin administration reproduced all of the effects on TG metabolism seen after IP treatment.
The liver gene expression profiles of our intervention groups (both leptin-treated and pair fed) indicated that the major effect was the repression of de novo lipogenesis, with an 80% decrease of FAS gene expression. This is further supported by the lipidomic data where a trend for a reduction in levels of palmitic acid (C16) is in keeping with reduced de novo lipogenesis.
In our current study, we also found SCD-1 mRNA expression was strongly decreased (60-70%) in the liver, not only following central and peripheral leptin treatment but also to a similar extent in the PF group. Further, as SCD-1 activity is essential for the conversion of stearic acid to oleic acid, the reduction of hepatic stearic acid (C18) levels indicate that in each intervention group there was a reduction in function SCD-1 levels.
SCD-1 has been previously identified by microarray analysis as a specific leptin target in the liver, down-regulated by leptin treatment in the liver of ob/ob mouse, but to a much lesser extent by pair feeding. The different findings in these studies could potentially be attributable to differences in the mode of leptin administration (IP injection vs minipump infusion). However our data do not support the idea that SCD-1 is a specific leptin target.
Leptin has been suggested to activate the beta oxidation pathway (19, 20)and , CONSISTEMT WITH THIS, we found an increase mRNA expression of genes involved in hepatic fatty acid oxidation. In the liver, ACOX, CPT1 and Acat1 mRNA levels were increased by leptin treatment but also by pair feeding , indicating these changes were driven by the reduction in food intake.
Importantly, there were also some changes in enzyme expression which appeared to be independent of the anorexigenic effects of leptin. The expression of two genes involved in the FA oxidation- hepatic ACOX (both mitochondrial and peroxisomal isoforms) were increased by leptin treatment independently of food restriction.
In term of fatty acid oxidation, in the skeletal muscle, we reported that the expression of PPARα was increased similarly by ICV and IP leptin treatment and that interestingly, this effect was not reproduced by food restriction, suggesting a leptin effect independent of its anorexigenic effect. Taken together our data suggests, as others (20) reported before, a central specific action of leptin on beta-oxidation but does not support as several report, a direct effect of leptin on beta oxidation in skeletal muscle.
However, because of the concentrations of leptin used and the highly atypical conditions within which some of the ex vivo analysis took place the physiological relevance of some of these reports is uncertain. For example one study reporting a direct effect of leptin on human skeletal muscle lipid metabolism (Steinberg et al). utilized a leptin concentration of 10,000 ng/ml , a value several log scales higher than that seen in any free living mammal.
Leptin has been reported to directly activate metabolic pathways within adipose tissue (21)(22). In the three different adipose depots we studied, the expression of lipogenic genes was similarly decreased in leptin treated and PF animals. The only exception was SREBP1c in the gonadal fat where expression levels were significantly decreased only by leptin treatment. It is of course possible that because of the limited range of genes that we studied some direct effects of leptin on adipocyte gene expression were overlooked in our study. However, our findings support the idea that the action of leptin on lipogenesis in WAT is mainly mediated through its central anorexigenic effects.
There are a number of limitations to our present study. A change in mRNA expression is not necessarily translated into a change in functional protein level. However, the transcript data are not presented in isolation but togetheR with data on circulating lipids and hepatic lipid composition which all support our assertions.We administered leptin for 3 days while other studies have used longer regimens which may have uncovered a difference between the treatment groups. For example,Levin et al administered leptin to ob/ob mice for 12 days (17). The weight loss over the first six days was equivalent in both leptin treated and pair fed group. However, after six days a plateau in weight loss was observed in pair fed mice, while ob/ob mice receiving leptin continued to lose weight. This raises the possibility that with time, the central action of leptin to promote lipid beta-oxidation persists while the purely anorexigenic effect become muted, although our current study was not designed to address this. We chose to study ob/ob mice as we wished to examine the physiological effects of hormonal repletion in a “hormone naïve” animal, a classical paradigm for the understanding of endocrine physiology. However, we appreciate that the effects of leptin supplementation in animals who already have some endogenous leptin may be different in extent and conceivably in kind.
In conclusion, although several studies support a direct effect of leptin on peripheral aspects of lipid metabolism, in our model we have not been able to detect such effects. Taken together, our data suggest that the major effects of leptin on lipid metabolism appear to be centrally mediated..In addition, our results suggest that, except for some centrally-mediated effects on the expression of asubset of genes involved in beta-oxidation, the bulk of leptin's effects on peripheral lipid metabolism can be explained by its anorectic action.
Acknowledgements
We would like to thanks Dr Emma English for her help with the use of gel fitration equipment and Debra Remington for her technical assistance in animal works.
This work was funded by the Medical Research Council (MRC) and The Wellcome Trust. APC is an MRC Clinician Scientist. JLG is a Royal Society University Research Fellow.
References
- 1.Wiegman CH, Bandsma RH, Ouwens M, van der Sluijs FH, Havinga R, Boer T, Reijngoud DJ, Romijn JA, Kuipers F. Hepatic VLDL production in ob/ob mice is not stimulated by massive de novo lipogenesis but is less sensitive to the suppressive effects of insulin. Diabetes. 2003;52:1081–9. doi: 10.2337/diabetes.52.5.1081. [DOI] [PubMed] [Google Scholar]
- 2.Silver DL, Jiang XC, Tall AR. Increased high density lipoprotein (HDL), defective hepatic catabolism of ApoA-I and ApoA-II, and decreased ApoA-I mRNA in ob/ob mice. Possible role of leptin in stimulation of HDL turnover. J Biol Chem. 1999;274:4140–6. doi: 10.1074/jbc.274.7.4140. [DOI] [PubMed] [Google Scholar]
- 3.Silver DL, Wang N, Tall AR. Defective HDL particle uptake in ob/ob hepatocytes causes decreased recycling, degradation, and selective lipid uptake. J Clin Invest. 2000;105:151–9. doi: 10.1172/JCI8087. [DOI] [PMC free article] [PubMed] [Google Scholar]
- 4.Friedman JM. The function of leptin in nutrition, weight, and physiology. Nutr Rev. 2002;60:S1–14. doi: 10.1301/002966402320634878. discussion S68-84, 85-7. [DOI] [PubMed] [Google Scholar]
- 5.Friedman JM. Leptin, leptin receptors, and the control of body weight. Nutr Rev. 1998;56:s38–46. doi: 10.1111/j.1753-4887.1998.tb01685.x. discussion s54-75. [DOI] [PubMed] [Google Scholar]
- 6.Bjorbaek C, Kahn BB. Leptin signaling in the central nervous system and the periphery. Recent Prog Horm Res. 2004;59:305–31. doi: 10.1210/rp.59.1.305. [DOI] [PubMed] [Google Scholar]
- 7.Reidy SP, Weber J. Leptin: an essential regulator of lipid metabolism. Comp Biochem Physiol A Mol Integr Physiol. 2000;125:285–98. doi: 10.1016/s1095-6433(00)00159-8. [DOI] [PubMed] [Google Scholar]
- 8.Chen G, Koyama K, Yuan X, Lee Y, Zhou YT, O'Doherty R, Newgard CB, Unger RH. Disappearance of body fat in normal rats induced by adenovirus-mediated leptin gene therapy. Proc Natl Acad Sci U S A. 1996;93:14795–9. doi: 10.1073/pnas.93.25.14795. [DOI] [PMC free article] [PubMed] [Google Scholar]
- 9.Lee Y, Wang MY, Kakuma T, Wang ZW, Babcock E, McCorkle K, Higa M, Zhou YT, Unger RH. Liporegulation in diet-induced obesity. The antisteatotic role of hyperleptinemia. J Biol Chem. 2001;276:5629–35. doi: 10.1074/jbc.M008553200. [DOI] [PubMed] [Google Scholar]
- 10.Unger RH. Leptin physiology: a second look. Regul Pept. 2000;92:87–95. doi: 10.1016/s0167-0115(00)00154-3. [DOI] [PubMed] [Google Scholar]
- 11.Unger RH, Zhou YT, Orci L. Regulation of fatty acid homeostasis in cells: novel role of leptin. Proc Natl Acad Sci U S A. 1999;96:2327–32. doi: 10.1073/pnas.96.5.2327. [DOI] [PMC free article] [PubMed] [Google Scholar]
- 12.Shimabukuro M, Koyama K, Chen G, Wang MY, Trieu F, Lee Y, Newgard CB, Unger RH. Direct antidiabetic effect of leptin through triglyceride depletion of tissues. Proc Natl Acad Sci U S A. 1997;94:4637–41. doi: 10.1073/pnas.94.9.4637. [DOI] [PMC free article] [PubMed] [Google Scholar]
- 13.Campfield LA, Smith FJ, Guisez Y, Devos R, Burn P. Recombinant mouse OB protein: evidence for a peripheral signal linking adiposity and central neural networks. Science. 1995;269:546–9. doi: 10.1126/science.7624778. [DOI] [PubMed] [Google Scholar]
- 14.Cohen P, Zhao C, Cai X, Montez JM, Rohani SC, Feinstein P, Mombaerts P, Friedman JM. Selective deletion of leptin receptor in neurons leads to obesity. J Clin Invest. 2001;108:1113–21. doi: 10.1172/JCI13914. [DOI] [PMC free article] [PubMed] [Google Scholar]
- 15.Farooqi IS, Matarese G, Lord GM, Keogh JM, Lawrence E, Agwu C, Sanna V, Jebb SA, Perna F, Fontana S, Lechler RI, DePaoli AM, O'Rahilly S. Beneficial effects of leptin on obesity, T cell hyporesponsiveness, and neuroendocrine/metabolic dysfunction of human congenital leptin deficiency. J Clin Invest. 2002;110:1093–103. doi: 10.1172/JCI15693. [DOI] [PMC free article] [PubMed] [Google Scholar]
- 16.Gallardo N, Bonzon-Kulichenko E, Fernandez-Agullo T, Molto E, Gomez-Alonso S, Blanco P, Carrascosa JM, Ros M, Andres A. Tissue-specific effects of central leptin on the expression of genes involved in lipid metabolism in liver and white adipose tissue. Endocrinology. 2007;148:5604–10. doi: 10.1210/en.2007-0933. [DOI] [PubMed] [Google Scholar]
- 17.Levin N, Nelson C, Gurney A, Vandlen R, de Sauvage F. Decreased food intake does not completely account for adiposity reduction after ob protein infusion. Proc Natl Acad Sci U S A. 1996;93:1726–30. doi: 10.1073/pnas.93.4.1726. [DOI] [PMC free article] [PubMed] [Google Scholar]
- 18.Huang W, Dedousis N, Bandi A, Lopaschuk GD, O'Doherty RM. Liver triglyceride secretion and lipid oxidative metabolism are rapidly altered by leptin in vivo. Endocrinology. 2006;147:1480–7. doi: 10.1210/en.2005-0731. [DOI] [PubMed] [Google Scholar]
- 19.Minokoshi Y, Kahn BB. Role of AMP-activated protein kinase in leptin-induced fatty acid oxidation in muscle. Biochem Soc Trans. 2003;31:196–201. doi: 10.1042/bst0310196. [DOI] [PubMed] [Google Scholar]
- 20.Minokoshi Y, Kim YB, Peroni OD, Fryer LG, Muller C, Carling D, Kahn BB. Leptin stimulates fatty-acid oxidation by activating AMP-activated protein kinase. Nature. 2002;415:339–43. doi: 10.1038/415339a. [DOI] [PubMed] [Google Scholar]
- 21.Soukas A, Cohen P, Socci ND, Friedman JM. Leptin-specific patterns of gene expression in white adipose tissue. Genes Dev. 2000;14:963–80. [PMC free article] [PubMed] [Google Scholar]
- 22.Wang MY, Orci L, Ravazzola M, Unger RH. Fat storage in adipocytes requires inactivation of leptin's paracrine activity: implications for treatment of human obesity. Proc Natl Acad Sci U S A. 2005;102:18011–6. doi: 10.1073/pnas.0509001102. [DOI] [PMC free article] [PubMed] [Google Scholar]