

Abstract
Background
The harmful effects of alcohol dependence (AD) on brain structure and function have been well documented, with many resolving with sufficient abstinence. White matter signal hyperintensities (WMSH) are thought to most likely be consequences secondary to the vascular (i.e., hypertension and atherosclerosis) effects of AD. We hypothesized such effects would persist into long-term abstinence, and evaluated them in middle-aged long-term abstinent alcoholics (LTAA) compared with age and gender comparable non-alcoholic controls (NAC).
Methods
97 participants (51 LTAA and 46 NAC) underwent cognitive, psychiatric, and structural brain MRI evaluations. WMSH were identified and labeled as deep or periventricular by an automated algorithm developed in-house. WMSH volumes were compared between groups, and the associations of WMSH measures with demographic, alcohol use, psychiatric and cognitive measures were examined within group.
Results
LTAA had more WMSH than NAC. There was a significant group by age interaction, with WMSH increasing with age in LTAA, but not in NAC. Within LTAA, WMSH load was independently positively associated with alcohol burden and with age. No associations were evident between WMSH volumes and abstinence duration, family drinking history, years of education, or psychiatric or cognitive variables.
Conclusion
The magnitude of alcohol abuse was related to increased WMSH volume. The presence of an age effect in the LTAA but not the controls indicates a synergistic effect wherein alcohol advances the onset of aging-related WMSH formation. The increased WMSH load did not appear to have any significant clinical correlates, indicating that the white matter lesions in our sample may not have been severe enough to manifest as cognitive deficits. A limitation of the study is that we did not have data on the presence or severity of lifetime or current indices of vascular risk factors such as, hypertension or smoking, or diabetes.
Keywords: Abstinence, alcohol dependence, alcoholism, white matter lesions, white matter signal hyperintensities
INTRODUCTION
In this investigation, we examined the effects of alcohol dependence (AD) on cerebral white matter, focusing on white matter signal hyperintensities (WMSH). We used a new automated WMSH identification and quantification program developed in-house. WMSH on T2-weighted magnetic resonance images (MRIs) have been observed for 25 years, but there has been little agreement on their exact nature or effects. There has not been a standard paradigm or protocol for delineating WMSH, but rather there have been a multitude of qualitative and quantitative grading scales for WMSH severity, increasing variability in WMSH measurement, and limiting consistency of results across studies (Sassi et al., 2003, Lin et al., 2005, Kuller et al., 2004b).
Despite prodigious advances in automated measurement of many aspects of brain structure, reliable automated measurement of WMSH has been difficult to achieve because of the complexity of the problem. WMSH are relatively straightforward to identify visually. Basically, they are areas in white matter where the T2 signal is heightened with respect to its surrounding white matter. Problems in automating this identification arise because of: 1) the presence of artifactual local increases in T2 intensity in specific brain regions (e.g., sulcal and ventricular CSF flow artifacts), 2) the relative nature of WMSHs (i.e., they are indicated not by exceeding a T2 intensity threshold, but by being more intense than immediately surrounding tissue), and 3) their presence confounds classification of gray vs. white matter (i.e., severe WMSH affect T1 intensity, making it more similar to that of gray matter or CSF than that of white matter) – if the tissue is classified as gray matter, the tissue may miss being classified as WMSH. Quantifying inter-subject differences in WMSH in populations with heavy WMSH burdens (e.g., the elderly) is relatively easy (Wu et al., 2006). Quantification of WMSH burden becomes more complex in less affected populations, where artifact may play a more prominent role because of the lesser presence of WMSH. Moreover, the issues are somewhat different depending on whether the WMSH are identified on simple T2-weighted images (where WMSHs and fluid-filled areas are bright) or on FLAIR sequences (i.e., where WMSHs are bright, but fluid filled areas including the ventricles, sulci, and Virchow-Robin spaces are dark).
WMSH have often been separated into two classes depending on location: deep vs. periventricular WMSH. Deep WMSH are located in the deep white matter at the end and border zones of arterial perfusion, while periventricular WMSH are adjacent to the ventricular ependyma, especially at the anterior and posterior horns of the lateral ventricles. Deep WMSH and periventricular WMSH are believed to have different etiologies. Deep WMSH are thought to represent incomplete infarction of the underlying tissue on the basis of the strong correlations between vascular risk factors and deep WMSH prevalence and severity, while associations between vascular risk factors and periventricular WMSH are somewhat weaker (DeCarli et al., 2005). Periventricular WMSH are thought to represent periventricular venous collagenosis, and ependymal leakage, while deep WMSH are thought to be caused by fibrohyalinosis and perivascular changes in myelin (ten Dam et al., 2007, DeCarli et al., 2005), associated with changes in the blood-brain barrier and extravasation of components of the serum (e.g. protein). In fact, Starr and colleagues have shown that subjects with more WMSHs had increased blood-brain barrier permeability compared to subjects with fewer lesions (Starr et al., 2003).
The major risk factors for WMSH development are increasing age and vascular disease (Bots et al., 1993, Longstreth et al., 1996, Manolio et al., 1999, Young, 2007, Liao et al., 1997, Liao et al., 1996). Using T2-weighted MR images of 3293 subjects (average age = 75 years) from the Cardiovascular Health Study (CHS), Kuller and colleagues (Kuller et al., 2004a), using a semi-quantitative manual rating scale, found that individuals with moderate to severe WMSH have a 2.8% risk of stroke per year of age versus a 0.6% per year risk for individuals with mild levels of WMSH. An earlier study using the CHS dataset found significant independent correlations between WMSH load and age, clinically silent stroke, high systolic blood pressure, and lower forced expiratory volume in 1 second (Longstreth et al., 1996). Cigarette smoking, which has a high comorbidity with alcoholism (Collins and Marks, 1995, DiFranza and Guerrera, 1990, Grucza and Beirut, 2006, Sher et al., 1996), is significantly associated with WMSH load, but the association is much smaller than that of other cerebrovascular risk factors such as hypertension or diabetes (Fukuda and Kitani, 1996, Jeerakathil et al., 2004, Sachdev et al., 2007).
There are few current studies that correlate WMSH with alcohol use, abuse, or dependence. Two relatively large studies had a similar and provocative finding (den Heijer et al., 2004, Mukamal et al., 2001). Both studies found a U-shaped relationship between alcohol dose and WMSH; that is, moderate drinkers had the least WMSH compared to abstainers and heavy drinkers. This is consistent with the literature that moderate alcohol use may have a cardio protective effect, and that heavy alcohol use may be associated with increased cerebrovascular disease. However, caution is warranted in concluding that heavy alcohol use is associated with an increased WMSH load, since not all studies of alcoholics find such an increase (e.g., (Jernigan et al., 1991, Pfefferbaum et al., 1992).
The current study examined deep WMSH and periventricular WMSH in long-term abstinent middle-aged alcoholics (LTAA) and non-alcoholic controls (NAC). We have published extensively on these LTAA and NAC elsewhere (Fein and Chang, 2006, Fein et al., 2007, Fein et al., 2006b, Di Sclafani et al., 2008, Fein et al., 2006a).. In this investigation, we hypothesize that there will be an increased prevalence and volume of deep and periventricular WMSH in LTAA, and that this effect will not be attenuated with abstinence, since the vascular damage associated with WMSH is not thought to be reversible.
MATERIALS AND METHODS
Participants
A total of 97 participants were recruited from the community by postings at AA meeting sites, mailings, newspaper advertisements, a local Internet site, and subject referrals. The study consisted of two subject groups: LTAA and NAC. The LTAA group comprised 24 women and 27 men, ranging from 35 to 58 years of age (mean = 46.7 years), who were abstinent from alcohol and drugs (except nicotine and caffeine) for 6 months to 21 years (mean = 6.3 years). The inclusion criteria for the LTAA group were: 1) met lifetime DSM-IV (American Psychiatric Association, 2000) criteria for alcohol dependence, 2) had a lifetime drinking average of at least 100 standard drinks per month for men, and 80 standard drinks per month for women, and 3) were abstinent for at least 6 months. A standard drink was defined as 12 oz. beer, 5 oz. wine, or 1.5 oz. liquor. The NAC consisted of 23 women and 23 men, ranging from 34 to 59 years of age (mean = 45.5 years). The inclusion criterion for the NAC group was a lifetime drinking average of less than 30 standard drinks per month, with no periods of drinking more than 60 drinks per month.
Exclusion criteria for both groups were: 1) lifetime or current diagnosis of schizophrenia or schizophreniform disorder using the computerized Diagnostic Interview Schedule (Bucholz et al., 1991, Erdman et al., 1992, Levitan et al., 1991, Robins et al., 1998), 2) history of lifetime or current drug abuse or dependence (other than nicotine or caffeine), 3) significant history of head trauma or cranial surgery, 4) history of significant neurological disease, 5) history of diabetes, stroke, or hypertension that required an emergent medical intervention, 6) laboratory evidence of hepatic disease, or 7) clinical evidence of Wernicke-Korsakoff syndrome.
All individuals participated in the following assessments: 1) psychiatric diagnoses and symptom counts were gathered using the c-DIS (Robins et al., 1998), 2) participants were interviewed on their lifetime drug and alcohol use using the timeline follow-back methodology (Skinner and Allen, 1982, Skinner and Sheu, 1982, Sobell and Sobell, 1990, Sobell et al., 1988), 3) medical histories were reviewed in an interview by a trained research associate, 4) blood was drawn to test liver functions, and 5) the Family Drinking Questionnaire was administered based on the methodology of Mann et al. (Mann et al., 1985, Stoltenberg et al., 1998). The Family Drinking Questionnaire asked participants to rate the members of their family as being alcohol abstainers, alcohol users with no problem, or problem drinkers. Family History Density (FHD) was defined as the proportion of 1st degree relatives that were problem drinkers. Approval for the study was obtained from a free-standing independent human subjects research review committee [Independent Review Consulting, Corte Madera, CA], and written informed consent was obtained from all research participants.
Neuropsychological Assessment
The neuropsychological assessments were administered in one session. The battery began with the administration of the following individual tests: Rey-Osterrieth Complex Figure (copy, immediate, and 20 minute delayed)(Osterrieth, 1944), Trail Making Test A and B (Reitan and Wolfson, 1985), Symbol Digit Modalities Test (written administration only)(Smith, 1968), American version of the Nelson Adult Reading Test (AMNART)(Grober and Sliwinski, 1991), Short Category Test (booklet format)(Wetzel and Boll, 1987), Controlled Oral Word Association Test (COWAT)(Benton and Hamsher, 1983), Paced Auditory Serial Addition Test (PASAT)(Gronwall, 1977), Block Design (WAIS-R)(Wechsler, 1981), Stroop Color and Word Test(Golden, 1978), Fregly Ataxia Battery (Fregly et al., 1973), and the Simulated Gambling Task(Bechara et al., 1994).
After a 15 minute break, the participant completed the MicroCog (MC) Assessment of Cognitive Functioning (standard version) (Powell et al., 1993). The MicroCog is a computer-administered and -scored test that assesses neurocognitive function in adults. MicroCog was designed to sensitively detect cognitive impairment across a wide range, with age- and education-level adjusted norms.
Normative scores derived from a nationally representative sample of adults are available for each test, either from the creators or distributors of the tests. Z-scores for the neuropsychological domains and measures were computed based on standardized norms adjusted for age (Stroop (Golden, 1978), Short Categories (Wetzel and Boll, 1987), PASAT (Stuss et al., 1988), Block Design (Wechsler, 1997), and Rey (Denman, 1987)), years of education (AMNART (Schwartz and Saffran, 1987)), age and years of education (Symbol Digit Modalities (Smith, 1982), MicroCog (Powell et al., 1993)), and age, gender, and years of education (Trails A and B (Heaton et al., 1991), COWAT (Ruff et al., 1996)). The Stroop, Symbol Digit Modalities, and the MicroCog test norms are not specific to gender, since gender did not significantly affect scores in the normative samples (Golden, 1978, Powell et al., 1993, Smith, 1982). The AMNART was used to estimate premorbid IQ (Grober and Sliwinski, 1991). The AMNART did not have age norms because the test was designed to be resistant to the effects of normal aging and most neurodegenerative diseases. Additionally, Grober et al (Grober and Sliwinski, 1991) have reported that gender does not influence AMNART scores. Z-scores were standardized so that all positive z-score values indicated superior performance.
The final NP battery consisted of the following 9 domains, and their component tests: (1) Attention (Stroop Color, MC Numbers Forward, MC Numbers Reversed, MC Alphabet, MC Word List 1) (2) Verbal Ability (COWAT, AMNART), (3) Abstraction/Cognitive Flexibility (Short Categories, Stroop interference score, Trail Making Test B, MC Analogies, MC Object Match A), (4) Psychomotor (Trails A, Symbol Digit), (5) Immediate Memory (MC Story immediate recall, Rey immediate recall, MC Word List 2), (6) Delayed Memory (MC Story delayed recall, Rey delayed recall), (7) Reaction Time (MC Timers simple and cued), (8) Spatial Processing (MC Tic Tac, MC Clocks, Block Design), and (9) Auditory Working Memory (PASAT at delays of 2.4, 2.0, 1.6, and 1.2 seconds).
Current and Lifetime Psychiatric Diagnoses, Symptoms, and Psychological Measures
The computerized Diagnostic Interview Schedule (c-DIS (Robins et al., 1998)) was administered to all participants by a research associate. The c-DIS generates a list of endorsed lifetime symptoms, determining whether individuals met criteria for a lifetime diagnosis. The c-DIS assessed symptoms in the anxiety disorder domain for: Agoraphobia, Compulsive Disorder, Obsessive Disorder, Panic Disorder, Post-Traumatic Stress Disorder, and Social Phobia. In the mood disorder domain, the c-DIS assessed symptoms for: Dysthymia, Mania, and Major Depressive Disorder. In the externalizing disorder domain, the c-DIS assessed symptoms of Antisocial Personality Disorder, and Conduct Disorder (without ASPD). If criteria for a lifetime diagnosis were met, the c-DIS followed up with questions about whether criteria were met for a current diagnosis (one that existed in the prior 12 months). Although the c-DIS does determine current diagnoses, it does not yield currency information for individual symptoms. For the endorsed symptoms, we constructed three aggregate variables, encompassing symptoms in the mood, anxiety, and externalizing disorder domains, respectively. In addition, we gathered psychological measures in the mood, anxiety, and externalizing disorder domains. The psychological scales used to assess the anxiety construct were the Reiss-Epstein Anxiety Sensitivity Index (ASI) (Reiss et al., 1986), and the State and Trait Scales of the State-Trait Anxiety Inventory for Adults (STAI-S and STAI-T) (Spielberger, 1983). Mood was assessed using the Depression and Hypomania Scales of the Minnesota Multiphasic Personality Inventory-2 (MMPI-D and MMPI-H) (Hathaway and McKinley, 1989). The externalizing construct was assessed using the Socialization Scale of the California Psychological Inventory (CPI-SS) (Gough, 1969) and the Psychopathic Deviance Scale of the MMPI-2 (MMPI-PD) (Hathaway and McKinley, 1989).
Image Acquisition
All MRIs were collected on a 1.5T GE Signa Infinity with the LX platform (GE Medical Systems, Waukesha, WI) located at the Pacific Campus of the California Pacific Medical Center in San Francisco. For each subject, we acquired a transaxial T1-weighted Spoiled Gradient image (TR = 35 ms, TE = 5 ms, acquisition matrix = 256 × 192) at 1.3 mm thickness, and a FLAIR image (TR = 8800 ms, TE = 144.7 ms, inversion time = 2200 ms, acquisition matrix = 256 × 256) at 5 mm thickness. The FLAIR slices were interleaved with no inter-slice gap. Nominal in-plane resolution was 0.859 × 0.859 mm. A neuroradiologist read all MRI scans. All scans were free from abnormalities other than WMSH.
Image Processing
In response to the difficulties with qualitative ratings of WMSH, we developed a quantitative approach for analyzing WMSH severity. We used software from Oxford University’s Centre for Functional MRI of the Brain (FMRIB) for skull removal (Smith, 2002), registration (Jenkinson and Smith, 2001), and segmentation (Zhang et al., 2001) followed by in-house developed automated WMSH delineation and quantification algorithms. Preprocessing of the images, which included co-registration of the FLAIR and T1 images, computing affine transformation matrices from subject space to MNI space, segmentation, bias correction, and noise reduction (Smith, 1992), was carried out with FMRIB’s FSL package, version 3.3. WMSH delineation and quantification was accomplished using an automated software algorithm developed in-house. The WMSH delineation and quantification algorithm followed three main steps: 1) white matter isolation, 2) WMSH detection, and 3) separation of deep versus periventricular WMSH.
White matter isolation is the first step in our image processing. WMSH are characterized by bright regions in the white matter on the FLAIR image. Segmentation algorithms (including FSL’s FAST algorithm) often misclassify WMSH as gray matter or CSF because WMSH affect intensities on both FLAIR and T1-weighted images. In order to validly delineate WMSH, the FLAIR image analysis needed to be restricted to true white matter because: 1) there are often artifactually bright regions on the FLAIR image in gray matter at the outer boundary of the brain and in CSF in the choroid plexus. These should not be included as WMSH because they represent (primarily flow) artifact, and 2) areas within white matter that are bright on FLAIR and misclassified as gray matter or CSF during segmentation must be reclassified as white matter and included as WMSH. To isolate the true white matter in the segmentation, the sulcal and ventricular CSF was removed. Next, the outer gray matter (adjacent to the outer boundary of the brain) was removed from the segmentation to prevent the inclusion of artifactual hyperintensities due to bright gray matter. Subcortical gray matter was then removed from the image using the Talairach Daemon’s definitions of the subcortical structures. The gray matter areas that were predominantly located under the subcortical mask and the isolated white matter areas that were fully contained under the mask were removed. Remaining areas that were classified as gray matter but were bright on the FLAIR image were reclassified as white matter.
The detection of WMSH is the second step in our image processing. The intensities of the voxels in the FLAIR image that were labeled as white matter were examined using peak detection to find local maxima and adaptive thresholds to compare the intensity of the hyperintense area to the surrounding voxels. When a sufficient intensity drop-off was encountered, this boundary was then used to define the edge of the WMSH. The resulting image was a 2-class segmentation representing normal white matter and WMSH.
The final step in processing separated deep WMSH from periventricular WMSH based on the shape of the WMSH and its position relative to the ventricles (see Figure 1). The ventricular boundaries were delineated by using a deformable 2D snake model (Xu and Prince, 1998) initialized on the overlapping areas between the Talairach atlas’ ventricle definition and the cerebrospinal fluid segmentation in FLAIR space. This approach found the smooth ventricular boundaries while avoiding thin CSF avenues in the interhemispheric fissure that may have been present due to image resolution limitations. The boundaries of periventricular WMSH that originated adjacent to the ventricles were found by the deformable snake, while irregularly shaped regions of increased FLAIR intensity extending from periventricular WMSH were classified as deep WMSH. The limitation of this 2D approach, which we are currently addressing, is that WMSH superior or inferior to the ventricles (rather than lateral to them) are not identified as periventricular since the snake is implemented in 2D on axial images. The final output of the WMSH program is a 3-class segmentation representing normal white matter, deep WMSH, and periventricular WMSH. In the beginning stages of development, the algorithms were evaluated against 50 images spanning a wide range of WMSH volumes in which the boundaries of each WMSH were delineated by a board certified neuroradiologist (JB), and had false positive and false negative rates of less than 5% of WMSH volume. After processing, each subject had an image marking normal white matter, deep WMSH, and periventricular WMSH. Figure 1is an example of an output of the WMSH delineation. Periventricular WMSH were defined in 2D as hyperintensities beginning at the ventricular boundaries and extending outward into the white matter with smooth boundaries. Deep WMSH, which were contiguous with periventricular WMSH, were characterized as isolated bright regions located in the deep white matter of the cerebral cortex.
Figure 1.
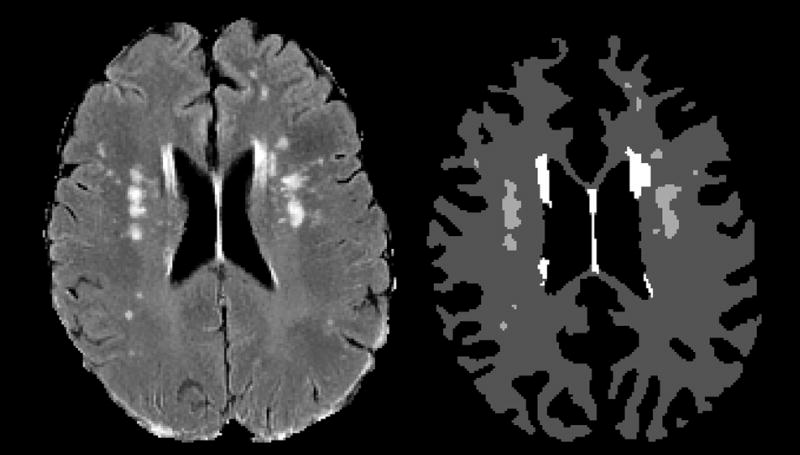
This figure shows the results of the WMSH delineation for a mid-ventricular slice in a 54-year-old male alcoholic, abstinent 10.7 years. Left: The original FLAIR image. Right: The final segmentation. The dark gray areas represent normal white matter, the medium gray areas represent deep WMSH, and the white areas represent periventricular WMSH.
RESULTS
In order to determine whether WMSH volumes should be adjusted for cerebral white matter volume or cranium size (using FSL’s cranium size index), we examined the proportion of variance of the WMSH measures accounted for by these potential covariates. Neither total white matter volume nor the cranium size index accounted for more than 2.7% of the variance of either WMSH measure (p’s > 0.11). Moreover, there were no differences between groups in total white matter (p = 0.1588) volume or cranium size (effect sizes less than 1.3 %, p’s > .15), but men had more white matter and larger craniums than women (p’s < 0.0001). The gender difference in white matter volume was entirely accounted for by the gender differences in cranium size, with the gender difference in white matter volume disappearing when adjusted for cranium size (effect size = 0.24%, p = 0.41). However, since there was a strong trend toward an association between total white matter volumes and WMSH volumes, each subject’s WMSH volumes were adjusted for total cerebral white matter volume. Using group and gender as main effects, we found the LTAA to have more deep WMSH than NAC (effect size = 4.4%, p = 0.039), and numerically (but non-significantly) more periventricular WMSH than NAC (effect size = 1.7%, p = 0.19).
Association of WMSH measures with demographic and alcohol use measures
Using group and gender as main effects, with age as a covariate, we found significant age by group interactions for both deep and periventricular WMSH (effect size = 5.7%, p = 0.014 for periventricular WMSH; effect size = 6.5%, p = 0.007 for deep WMSH). After adjusting for age, there were more periventricular WMSH (p = 0.023) and deep WMSH (p = 0.017) in LTAA than NAC. We followed up on the interaction effects by computing age correlations separately for the control and LTAA groups. We found essentially no age correlations in NAC (r’s < 0.106, p’s > 0.48), but significant positive correlations, indicating increasing WMSH burden as a function of age, in LTAA (r = 0.401, p = 0.004 for periventricular WMSH; r = 0.449, p = 0.001 for deep WMSH). The age associations for NAC and LTAA are displayed in Figures 2 and 3.
Figure 2.

WMSH volumes (adjusted for between subject differences in total white matter volume) vs. age in control subjects. R2periventricular WMSH = 0.00297 and R2deep WMSH = 0.0113.
Figure 3.

WMSH volumes (adjusted for between subject differences in total white matter volume) vs. age in LTAA subjects. R2periventricular WMSH = 0.161 and R2deep WMSH = 0.201.
In the LTAA sample, alcohol use measures were confounded with age due to the fact that older subjects had a longer time to drink. Partial correlations were computed in the LTAA group between the WMSH measures and alcohol use variables controlling for age, and between the WMSH measures and age controlling for alcohol use variables. While controlling for age, significant positive partial correlations were found for peak alcohol use (r = 0.500, p < 0.001 for periventricular WMSH; r = 0.364, p = 0.009 for deep WMSH) and for lifetime use (r = 0.376, p = 0.007 for periventricular WMSH; r = 0.306, p = 0.031 for deep WMSH). Similarly, we found significant correlations between WMSH volumes and alcohol dose measures (in standard drinks) while controlling for age. There were significant positive correlations between peak dose and both types of WMSH (r = 0.248, p = 0.083 for periventricular WMSH; r = 0.276, p = 0.053 for deep WMSH), and trends toward such correlations between lifetime dose and both types of WMSH (r = 0.234, p = 0.102 for periventricular WMSH, r = 0.223, p = 0.122 for WMSH). Significant partial correlations with age were found for deep WMSH volumes whether controlling for peak alcohol use or lifetime alcohol use (r = 0.328, p = 0.020 controlling for peak use; r = 0.326, p = 0.021 controlling for lifetime use). Partial correlations between WMSH volumes and abstinence duration partialling out age were negative, but non-significant (r = −0.229, p = 0.109 for periventricular WMSH; r = −0.162, p = 0.262 for deep WMSH). We found no significant correlations between the WMSH measures and years of education (|r|’s < 0.112, p’s > 0.440) or the density of the family history of alcoholism (|r|’s < 0.127, p’s > 0.377). Finally, we found no significant correlations between the WMSH measures and any psychiatric or cognitive variables (all r’s < 0.198, all p’s > 0.163).
DISCUSSION
The major finding of this study was of an increased WMSH load in middle-aged LTAA compared to age and gender comparable NAC. The results suggest that these WMSH are a consequence of heavy alcohol intake since the WMSH volume was positively associated with both lifetime alcohol use (total drinks consumed) and peak dose (average number of drinks per month during the time of the subjects’ heaviest drinking), independent of the effects of age. We did not find associations of WMSH load with the family density of alcoholism or with years of education, suggesting that WMSH load was not associated with factors predisposing individuals to alcoholism but was a result of excessive alcohol ingestion itself.
There is little doubt in current alcoholism research that the aging brain (late middle-age and older) is more vulnerable to the effects of AD (Raz et al., 1997, Kril and Halliday, 1999), i.e., the same dose of alcohol affects the older brain more than the younger brain. There are two major models regarding the effects of AD and aging on the brain. The first is the ‘cumulative or additive effects’ model, which assumes that the older brain is simply showing more damage than the younger due to greater years of age (normal aging itself has detrimental effects on the human brain), and the greater cumulative dose of alcohol ingested over the additional years the older individual drank (as compared to a younger person). The second proposes a ‘synergism’ between alcohol dose and brain damage, in which dose potentiates damage due to aging, or aging potentiates the damage due to alcohol intake, or both). WMSH burden may reduce brain functional reserve capacity in LTAA, making individuals more vulnerable to the functional consequences of other brain insults that occur with increasing age (Fein and Di Sclafani, 2004).
In this middle-aged LTAA sample, lifetime and peak alcohol use measures were correlated with WMSH volumes after controlling for age, showing that alcohol consumption contributes to white matter damage independent of age. In addition, there was an age effect on WMSH volume in LTAA (independent of alcohol use), with no effect of age on WMSH volume in controls. This establishes a synergistic effect of alcohol and age, with a larger effect of age in alcoholics than controls (in fact, there’s no effect in controls). In the presence of chronic alcoholism (even in remission), age exerts a morbid effect on white matter. This finding contrasts with the results from our previous study of brain structure in treatment-naïve alcoholics (Fein et al., 2002). In that study, we found a nearly complete confound between the effects of age and alcohol use on cortical gray matter. In other words, we did not find an effect of age independent of the effects of alcohol use. The major differences between the studies are the focus on gray matter vs. white matter, and that the severity of alcohol use is higher and the subjects are older in the current study; either of these differences could have accounted for the different results.
We found no clear functional consequences of the WMSH that are the subject of this study. Although our power to detect such effects could be stronger, the lack of a relationship between both deep WMSH and periventricular WMSH volume and these variables shows that there is no large association present. It is possible that the WMSH burden in the alcoholics may be associated with increases in brain functional morbidity as brain functional reserve capacity diminishes with age (Fein and Di Sclafani, 2004).
We wish to note that there are some limitations in this study. First, our 5mm slice thickness for the FLAIR images imposes limitations on WMSH detection; the technology has advanced since our study began, allowing thinner slices which would allow more sensitive detection of small WMSHs and more accurate delineation of WMSH boundaries. In contrast, it is important to note that imaging technology is always improving. In the introduction, we mentioned that both Jernigan et al (Jernigan et al., 1991) and Pfefferbaum et al., (Pfefferbaum et al., 1992) failed to find increased WMSH load in alcoholics with the imaging technology available in the early 1990’s. At that time, FLAIR sequences had not yet been developed, and inter-slice gaps were standard. Both of those studies used 2.5 mm gaps with 5 mm thick slices, resulting in coverage of only two thirds of the brain, which is a problem for detecting small WMSHs. Thinner slices and on-line correction for movement will both increase the sensitivity of WMSH detection algorithms. Second, the differentiation of periventricular and deep WMSH was limited by a 2D approach that was unable to classify WMSH in the slice(s) directly above or below the ventricles as periventricular. While this did not affect the detection of total WMSH, this limitation resulted in the underestimation of periventricular WMSH and overestimation of deep WMSH. Nevertheless, these errors represented only a fraction of the total WMSH load in each subject and were unbiased toward either experimental group. Third, we did not specifically assess lifetime or current smoking, hypertension, or other atherosclerotic disease risk factors, nor did we address nutritional status, either while drinking or currently. All of these factors may be associated with WMSH burden, and we were unable o determine the degree to which these factors may have contributed to the findings in the current study. Additionally, we did not measure the severity of alcohol withdrawal in the abstinent alcoholics. Although withdrawal has not been linked to WMSH (Brown et al., 2000, Eckardt et al., 1992, Sullivan et al., 1996), it has been shown to have deleterious effects on the brain. We routinely measure all of these factors in our ongoing work.
In conclusion, the current study found more WMSH in the LTAA group than in NAC. WMSH load was associated with alcohol use in alcoholics. This, combined with the absence of a strong negative trend between length of abstinence and WMSH volumes (after controlling for age), supports our hypothesis that WMSH in AD is a consequence of long-term heavy alcohol use, and represents white matter damage that may be irreversible. Additional work is required to determine the contribution of the cofactors mentioned above to such findings in alcoholic samples, and to determine whether such findings manifest in cognitive and healh morbidity as individuals age and brain reserve capacity is diminished (Fein and Di Sclafani, 2004).
Table 1.
Demographic and Alcohol Use Variables.
| Demographic Variables | Middle-Aged Normal Controls | Middle-Aged Abstinent Alcoholics | Effect Size (%) | ||||
|---|---|---|---|---|---|---|---|
| Male
(n=23) |
Female
(n=23) |
Male
(n=27) |
Female
(n=24) |
Group | Sex | Group × Sex | |
| Age (Years) | 43.0 ± 6.4 | 48.0 ± 6.6 | 45.1 ± 7.0 | 48.4 ± 6.4 | 0.8 | 9.1** | 0.4 |
| Family Drinking Density1 | 0.15 ± 0.22 | 0.17 ± 0.21 | 0.38 ± 0.25 | 0.44 ± 0.30 | 22.8*** | 0.5 | <0.01 |
| Years Education | 16.2 ± 2.3 | 16.0 ± 1.9 | 15.4 ± 1.9 | 15.5 ± 2.4 | 2.3 | 0.7 | 0.1 |
| AMNART (Estimated Premorbid Verbal IQ) | 1.20 ± 0.45 | 1.47 ± 0.42 | 1.19 ± 0.43 | 1.40 ± 0.35 | 0.2 | 8.0** | 0.2 |
| Alcohol Use Variables | |||||||
| Duration of Active Drinking (months) | 220 ± 129 | 294 ± 130 | 267 ± 91 | 277 ± 105 | 0.4 | 3.3 | 1.9 |
| Average Lifetime Drinking Dose (std. drinks/month) | 6.6 ± 8.5 | 6.8 ± 7.6 | 181 ± 148 | 129 ± 77.5 | 41.2*** | 1.2 | 1.3 |
| Lifetime Alcohol Use (std. drinks) | 1611 ± 2186 | 1953 ± 2346 | 55156 ± 59514 | 39628 ± 37755 | 28.0*** | 0.8 | 0.8 |
| Duration of Peak Drinking (Months) | 70.6 ± 84.2 | 114 ± 113 | 61.1 ± 58.9 | 92.4 ± 82.3 | 0.8 | 4.6* | 0.1 |
| Average Peak Drinking Dose (std. drinks/month) | 14.4 ± 14.8 | 16.7 ± 22.4 | 348 ± 254 | 270 ± 201 | 43.2*** | 0.7 | 0.8 |
| Peak Alcohol Use (std. drinks) | 837 ± 1140 | 1006 ± 1501 | 27167 ± 44433 | 24535 ± 29143 | 17.4*** | 0.04 | 0.06 |
| Abstinence Duration (Days) | N/A | N/A | 2168 ± 2176 | 2298 ± 2055 | N/A | 0.1 | N/A |
N/A Measures are reported mean ± standard deviation.
Family drinking density is defined as the proportion of 1st degree relatives who are problem drinkers; statistical comparisons (and estimates of effect size) for family drinking density were performed after normalizing the proportions via the arcsine transformation.
Table 2.
WMSH volumes vs. brain size for male and female LTAA and NAC.
| Variables | Middle-Aged Normal Controls | Middle-Aged Abstinent Alcoholics | Effect Size (%) | ||||
|---|---|---|---|---|---|---|---|
| Male
(n=23) |
Female
(n=23) |
Male
(n=27) |
Female
(n=24) |
Group | Sex | Group × Sex | |
| Periventricular WMSH (mm3) | 1124 ± 1271 | 1195 ± 656 | 1405 ± 1543 | 1886 ± 2527 | 2.2 | 0.70 | 0.39 |
| Deep WMSH (mm3) | 723 ± 965 | 519 ± 491 | 1061 ± 1114 | 1454 ± 2370 | 4.9* | 0.11 | 1.08 |
| FSL cranium size Index | 0.80 ± 0.07 | 0.71 ± 0.05 | 0.80 ± 0.06 | 0.72 ± 0.65 | 0.49 | 34.3*** | 0.07 |
| Total white matter volume (mm3) | 481568 ± 51386 | 421836 ± 34383 | 491139 ± 48100 | 436588 ± 53982 | 1.21 | 26.8*** | 0.05 |
| Total white matter volume (adjusted for differences in FSL cranium size index) (mm3) | 481568 ± 51387 | 421836 ± 34383 | 491139 ± 48100 | 436588 ± 53982 | 0.31 | 0.24 | < 0.001 |
Measures are reported as mean ± standard deviation.
Effect is significant:
p ≤ 0.05,
p ≤ 0.01,
p ≤ 0.001.
FSL cranium size index: larger numbers indicate larger intracranial vaults.
Table 3.
Correlations of demographic and Alcohol use variables with WMSH volumes in LTAA.
| Pearson Correlation Coefficients | ||||||
|---|---|---|---|---|---|---|
| Periventricular WMSH | Deep WMSH | Age | ||||
| r | p | R | p | r | p | |
| Correlations | ||||||
| Age | 0.401** | 0.004 | 0.449* | 0.001 | 1.000 | |
| Lifetime Alcohol Dose | 0.335* | 0.016 | 0.336* | 0.016 | 0.332* | 0.017 |
| Lifetime Alcohol Use | 0.480*** | <0.001 | 0.436** | 0.001 | 0.418* | 0.002 |
| Peak Alcohol Dose | 0.338* | 0.015 | 0.370** | 0.008 | 0.302* | 0.031 |
| Peak Alcohol Use | 0.577*** | <0.001 | 0.473*** | <0.001 | 0.384* | 0.005 |
| Length of Abstinence | −0.073 | 0.610 | 0.004 | 0.980 | 0.315* | 0.024 |
| Family Drinking Density | −0.079 | 0.583 | −0.098 | 0.494 | 0.035 | 0.806 |
| Years of Education | 0.036 | 0.800 | −0.011 | 0.940 | −0.161 | 0.258 |
| Partial Correlations, Controlling for Age | ||||||
| Lifetime Alcohol Dose | 0.234 | 0.102 | 0.223 | 0.122 | ||
| Lifetime Alcohol Use | 0.376** | 0.007 | 0.306* | 0.031 | ||
| Peak Alcohol Dose | 0.248 | 0.083 | 0.276 | 0.053 | ||
| Peak Alcohol Use | 0.500*** | <0.001 | 0.364** | 0.009 | ||
| Length of Abstinence | −0.229 | 0.109 | −0.162 | 0.262 | ||
| Family Drinking Density | −0.101 | 0.483 | −0.127 | 0.377 | ||
| Years of Education | 0.112 | 0.440 | 0.070 | 0.630 | ||
| Partial Correlations, Controlling for Lifetime Alcohol Use | ||||||
| Age | 0.251 | 0.079 | 0.326* | 0.021 | ||
The Periventricular and Deep WMSH volumes are adjusted for inter-subject differences in total cerebral white matter volume.
Alcohol use measures represent the quantiy of alcohol consumed during a given time frame.
Alcohol dose measures represent the average monthly intake of alcohol during a given time frame.
Family drinking density is the proportion of first-degree relatives who were problem drinkers.
Acknowledgments
This work was supported by NIDA (SBIR contract HHSN271200688434C), and NIAAA Grants AA11311 and AA13659
Footnotes
There are no conflicts of interest, past or present.
References
- BECHARA A, DAMASIO AR, DAMASIO H, ANDERSON SW. Insensitivity to future consequences following damage to human prefrontal cortex. Cognition. 1994;50:7–15. doi: 10.1016/0010-0277(94)90018-3. [DOI] [PubMed] [Google Scholar]
- BENTON AL, HAMSHER K. Multilingual aphasia examination. Iowa City: AJA Associates; 1983. [Google Scholar]
- BOTS ML, BRETELER MMB, HOFMAN A, GROBBEE DE, VAN SWIETEN JC, VAN GIJIN J, VAN SWIETEN JC, DE JONG PTVM. Cerebral white matter lesions and atherosclerosis in the Rotterdam Study. The Lancet. 1993;341:1232–1237. doi: 10.1016/0140-6736(93)91144-b. [DOI] [PubMed] [Google Scholar]
- BROWN SA, TAPERT SF, GRANHOLM E, DELIS DC. Neurocognitive functioning of adolescents: effects of protracted alcohol use. Alcohol Clin Exp Res. 2000;24:164–71. [PubMed] [Google Scholar]
- BUCHOLZ KK, ROBINS LN, SHAYKA JJ, PRZYBECK TR, HELZER JE, GOLDRING E, KLEIN MH, GREIST JH, ERDMAN HP, SKARE SS. Performance of two forms of a computer psychiatric screening interview: version I of the DISSI. J Psychiatr Res. 1991;25:117–29. doi: 10.1016/0022-3956(91)90005-u. [DOI] [PubMed] [Google Scholar]
- COLLINS AC, MARKS MJ. Animal models of alcohol-nicotine interactions. Alcohol and Tobacco: From Basic Science to Clinical Practice. 1995:129–144. [Google Scholar]
- DECARLI C, FLETCHER E, RAMEY V, HARVEY D, JAGUST WJ. Anatomical mapping of white matter hyperintensities (WMH) Stroke. 2005;36:50–55. doi: 10.1161/01.STR.0000150668.58689.f2. [DOI] [PMC free article] [PubMed] [Google Scholar]
- DEN HEIJER T, VERMEER SE, VAN DIJK EJ, PRINS ND, KOUDSTAAL PJ, VAN DUIJN CM, HOFMAN A, BRETELER MM. Alcohol intake in relation to brain magnetic resonance imaging findings in older persons without dementia. Am J Clin Nutr. 2004;80:992–7. doi: 10.1093/ajcn/80.4.992. [DOI] [PubMed] [Google Scholar]
- DENMAN SB. Denman Neuropsychology Memory Scale. Charleston, SC; SB Denman: 1987. [Google Scholar]
- DI SCLAFANI V, FINN P, FEIN G. Psychiatric CoMorbidity in Treatment-naïve Active Alcoholics. Drug Alcohol Depend. 2008 doi: 10.1016/j.drugalcdep.2008.04.019. in revision. [DOI] [PMC free article] [PubMed] [Google Scholar]
- DIFRANZA JR, GUERRERA MP. Alcoholism and smoking. J Stud Alcohol. 1990;51:130–135. doi: 10.15288/jsa.1990.51.130. [DOI] [PubMed] [Google Scholar]
- ECKARDT MJ, CAMPBELL GA, MARIETTA CA, MAJCHROWICZ E, RAWLINGS RR, WEIGHT FF. Ethanol dependence and withdrawal selectively alter localized cerebral glucose utilization. Brain Res. 1992;584:244–50. doi: 10.1016/0006-8993(92)90901-k. [DOI] [PubMed] [Google Scholar]
- ERDMAN HP, KLEIN MH, GREIST JH, SKARE SS, HUSTED JJ, ROBINS LN, HELZER JE, GOLDRING E, HAMBURGER M, MILLER JP. A comparison of two computer-administered versions of the NIMH Diagnostic Interview Schedule. J Psychiatr Res. 1992;26:85–95. doi: 10.1016/0022-3956(92)90019-k. [DOI] [PubMed] [Google Scholar]
- FEIN G, CHANG M. Visual P300s in long-term abstinent chronic alcoholics. Alcohol Clin Exp Res. 2006;30:2000–7. doi: 10.1111/j.1530-0277.2006.00246.x. [DOI] [PMC free article] [PubMed] [Google Scholar]
- FEIN G, DI SCLAFANI V. Cerebral reserve capacity: implications for alcohol and drug abuse. Alcohol. 2004;32:63–7. doi: 10.1016/j.alcohol.2003.10.003. [DOI] [PubMed] [Google Scholar]
- FEIN G, DI SCLAFANI V, CARDENAS VA, GOLDMANN H, TOLOU-SHAMS M, MEYERHOFF DJ. Cortical gray matter loss in treatment-naive alcohol dependent individuals. Alcohol Clin Exp Res. 2002;26:558–64. [PMC free article] [PubMed] [Google Scholar]
- FEIN G, DI SCLAFANI V, FINN P, SCHEINER DL. Sub-diagnostic psychiatric comorbidity in alcoholics. Drug Alcohol Depend. 2007;87:139–45. doi: 10.1016/j.drugalcdep.2006.08.009. [DOI] [PMC free article] [PubMed] [Google Scholar]
- FEIN G, LANDMAN B, TRAN H, MCGILLIVRAY S, FINN P, BARAKOS J, MOON K. Brain atrophy in long-term abstinent alcoholics who demonstrate impairment on a simulated gambling task. Neuroimage. 2006a;32:1465–71. doi: 10.1016/j.neuroimage.2006.06.013. [DOI] [PMC free article] [PubMed] [Google Scholar]
- FEIN G, TORRES J, PRICE LJ, DI SCLAFANI V. Cognitive performance in long-term abstinent alcoholic individuals. Alcohol Clin Exp Res. 2006b;30:1538–44. doi: 10.1111/j.1530-0277.2006.00185.x. [DOI] [PMC free article] [PubMed] [Google Scholar]
- FREGLY AR, SMITH MJ, GRAYBIEL A. Revised normative standards of performance of men on a quantitative ataxia test battery. Acta Otolaryngol. 1973;75:10–6. doi: 10.3109/00016487309139631. [DOI] [PubMed] [Google Scholar]
- FUKUDA H, KITANI M. Cigarette smoking is correlated with the periventricular hyperintensity grade on brain magnetic resonance imaging. Stroke. 1996:27. doi: 10.1161/01.str.27.4.645. [DOI] [PubMed] [Google Scholar]
- GOLDEN CJ. Stroop Color and Word Test: A Manual for Clinical and Experimental Uses. Los Angeles, CA: Western Psychological Services; 1978. [Google Scholar]
- GOUGH HGPD. Manual for the California Psychological Inventory (So Scale) Palo Alto, CA: Consulting Psychological Press; 1969. [Google Scholar]
- GROBER E, SLIWINSKI M. Development and validation of a model for estimating premorbid verbal intelligence in the elderly. J Clin Exp Neuropsychol. 1991;13:933–49. doi: 10.1080/01688639108405109. [DOI] [PubMed] [Google Scholar]
- GRONWALL DM. Paced auditory serial-addition task: a measure of recovery from concussion. Percept Mot Skills. 1977;44:367–73. doi: 10.2466/pms.1977.44.2.367. [DOI] [PubMed] [Google Scholar]
- GRUCZA RA, BEIRUT LJ. Cigarette smoking and the risk for alcohol use disorders among adolescent drinkers. Alcohol Clin Exp Res. 2006;30:2046–2054. doi: 10.1111/j.1530-0277.2006.00255.x. [DOI] [PMC free article] [PubMed] [Google Scholar]
- HATHAWAY S, MCKINLEY J. MMPI-2: Minnesota Multiphasic Personality Inventory. Minneapolis: The University of Minnesota Press; 1989. [Google Scholar]
- HEATON RK, GRANT I, MATHTHEWS CG. Comprehensive Norms for an Expanded Halstead-Reitan Battery: Demographic Corrections, Research Findings, and Clinical Applications. Odessa, FL: Psychological Assessment Resources, Inc; 1991. [Google Scholar]
- JEERAKATHIL T, WOLF PA, BEISER A, MASSARO J, SESHADRI S, D’AGOSTINO RB, DECARLI C. Stroke risk profile predicts whit matter hyperintensity volume (The Framingham Study) Stroke. 2004;35:1857–1861. doi: 10.1161/01.STR.0000135226.53499.85. [DOI] [PubMed] [Google Scholar]
- JENKINSON M, SMITH SM. A global optimisation method for robust affine registration of brain images. Medical Image Analysis. 2001;5:143–156. doi: 10.1016/s1361-8415(01)00036-6. [DOI] [PubMed] [Google Scholar]
- JERNIGAN TL, BUTTERS N, DITRAGLIA G, SCHAFER K, SMITH T, IRWIN M, GRANT I, SCHUCKIT M, CERMAK LS. Reduced cerebral grey matter observed in alcoholics using magnetic resonance imaging. Alcohol Clin Exp Res. 1991;15:418–27. doi: 10.1111/j.1530-0277.1991.tb00540.x. [DOI] [PubMed] [Google Scholar]
- KRIL JJ, HALLIDAY GM. Brain shrinkage in alcoholics: A decade on and what have we learned? Progress in Neurobiology. 1999;58:381–387. doi: 10.1016/s0301-0082(98)00091-4. [DOI] [PubMed] [Google Scholar]
- KULLER LH, LONGSTRETH WT, ARNOLD AM, BERNICK C, BRYAN RN, BEAUCHAMP NJ. White matter hyperintensity on cranial magnetic resonance imaging: a predictor of stroke. Stroke. 2004a;35:1821–1825. doi: 10.1161/01.STR.0000132193.35955.69. [DOI] [PubMed] [Google Scholar]
- KULLER LH, LONGSTRETH WT, JR, ARNOLD AM, BERNICK C, BRYAN RN, BEAUCHAMP NJ., JR White matter hyperintensity on cranial magnetic resonance imaging: a predictor of stroke. Stroke. 2004b;35:1821–5. doi: 10.1161/01.STR.0000132193.35955.69. [DOI] [PubMed] [Google Scholar]
- LEVITAN RD, BLOUIN AG, NAVARRO JR, HILL J. Validity of the computerized DIS for diagnosing psychiatric inpatients. Can J Psychiatry. 1991;36:728–31. [PubMed] [Google Scholar]
- LIAO DP, COOPER L, CAI J, TOOLE JF, BRYAN NR, SHAHAR GJN, MOSLEY T, HEISS G. The prevalence and severity of white matter lesions, their relationship with age, ethnicity, gender, and cardiovascular risk factors: The ARIC study. Neuroepidemiology. 1997;16:149. doi: 10.1159/000368814. [DOI] [PubMed] [Google Scholar]
- LIAO DP, COOPER L, CAO J, TOOLE JF, BRYAN N, HUTCHINSON RG, TYROLER HA. Presence and severity of cerebral white matter lesions and hypertension, its treatment, and its control: The ARIC study. Stroke. 1996;27:2262–2270. doi: 10.1161/01.str.27.12.2262. [DOI] [PubMed] [Google Scholar]
- LIN HF, KUO YT, CHIANG IC, CHEN HM, CHEN CS. Structural abnormality on brain magnetic resonance imaging in late-onset major depressive disorder. Kaohsiung J Med Sci. 2005;21:405–11. doi: 10.1016/S1607-551X(09)70142-1. [DOI] [PubMed] [Google Scholar]
- LONGSTRETH WT, MANOLIO TA, ARNOLD A, BURKE GL, BRYAN N, JUNGREIS CA, ENRIGHT PL, OLEARY D, FRIED L. Clinical correlates of white matter findings on cranial magnetic resonance imaging of 3301 elderly people: the Cardiovascular Health Study. Stroke. 1996;27:1274–1282. doi: 10.1161/01.str.27.8.1274. [DOI] [PubMed] [Google Scholar]
- MANN RE, SOBELL LC, SOBELL MB, PAVAN D. Reliability of a family tree questionnaire for assessing family history of alcohol problems. Drug Alcohol Depend. 1985;15:61–7. doi: 10.1016/0376-8716(85)90030-4. [DOI] [PubMed] [Google Scholar]
- MANOLIO TA, BURKE GL, O’LEARY DH, EVANS G, BEAUCHAMP NJ, KNEPPER L, WARD B. Relationships of cerebral MRI findings to ultrasonographic carotid atherosclerosis in older adults: The Cardiovascular Health Study. Arteriosclerosis, Thrombosis, and Vascular Biology. 1999;19:356–365. doi: 10.1161/01.atv.19.2.356. [DOI] [PubMed] [Google Scholar]
- MUKAMAL KJ, LONGSTRETH WT, JR, MITTLEMAN MA, CRUM RM, SISCOVICK DS. Alcohol consumption and subclinical findings on magnetic resonance imaging of the brain in older adults: the cardiovascular health study. Stroke. 2001;32:1939–46. doi: 10.1161/hs0901.095723. [DOI] [PubMed] [Google Scholar]
- OSTERRIETH PA. Le test du copie d’une figure complexe: Contribution à l’étude de la perception et de la mémoire [The test of copying a complex figure: A contribution to the study of perception and memory] Archives of Psychology (Chicago) 1944;30:206–356. [Google Scholar]
- PFEFFERBAUM A, LIM KO, ZIPURSKY RB, MATHALON DH, ROSENBLOOM MJ, LANE B, HA CN, SULLIVAN EV. Brain gray and white matter volume loss accelerates with aging in chronic alcoholics: a quantitative MRI study. Alcohol Clin Exp Res. 1992;16:1078–89. doi: 10.1111/j.1530-0277.1992.tb00702.x. [DOI] [PubMed] [Google Scholar]
- POWELL DH, KAPLAN EF, WHITLA D, WEINSTRAUB S, CATLIN R, FUNKENSTEIN HH. MicroCog Assessment of Cognitive Functioning. San Antonio, TX: The Psychological Corporation; 1993. [Google Scholar]
- RAZ N, GUNNING FM, HEAD D, DUPUIS JH, MCQUAIN J, BRIGGS SD, LOKEN WJ, THORNTON AE, ACKER JD. Selective aging of the human cerebral cortex observed in vivo: differential vulnerability of the prefrontal gray matter. Cereb Cortex. 1997;7:268–82. doi: 10.1093/cercor/7.3.268. [DOI] [PubMed] [Google Scholar]
- REISS S, PETERSON RA, GURSKY DM, MCNALLY RJ. Anxiety sensitivity, anxiety frequency and the prediction of fearfulness. Behav Res Ther. 1986;24:1–8. doi: 10.1016/0005-7967(86)90143-9. [DOI] [PubMed] [Google Scholar]
- REITAN RM, WOLFSON D. The Halstead-Reitan Neuropsychological Test Battery. Tucson: Neuropsychology Press; 1985. [Google Scholar]
- ROBINS LN, COTTLER L, BUCKHOLZ K, COMPTON W. The Diagnostic Interview Schedule for DSM-IV. St. Louis, MO: Washington University School of Medicine; 1998. [Google Scholar]
- RUFF RM, LIGHT RH, PARKER SB, LEVIN HS. Benton Controlled Oral Word Association Test: reliability and updated norms. Arch Clin Neuropsychol. 1996;11:329–38. [PubMed] [Google Scholar]
- SACHDEV PS, PARSLOW R, WEN W, ANSTEY KJ, EASTEAL S. Sex differences in the cuases and consequences of white matter hyperintensities. Neurobiology of Aging. 2007 doi: 10.1016/j.neurobiolaging.2007.08.023. [DOI] [PubMed] [Google Scholar]
- SASSI RB, BRAMBILLA P, NICOLETTI M, MALLINGER AG, FRANK E, KUPFER DJ, KESHAVAN MS, SOARES JC. White matter hyperintensities in bipolar and unipolar patients with relatively mild-to-moderate illness severity. J Affect Disord. 2003;77:237–45. doi: 10.1016/s0165-0327(02)00170-2. [DOI] [PubMed] [Google Scholar]
- SCHWARTZ M, SAFFRAN E. The American-NART: Replication and extension of the British findings on the persistence of the word pronunciation skills in patients with dementia. Philadelphia, PA: 1987. [Google Scholar]
- SHER KJ, GOTHAM HJ, ERICKSON DJ, WOOD PK. A prospective, high-risk study of the relationship between tobacco dependence and alcohol use disorders. Alcohol Clin Exp Res. 1996;20:485–492. doi: 10.1111/j.1530-0277.1996.tb01079.x. [DOI] [PubMed] [Google Scholar]
- SKINNER HA, ALLEN BA. Alcohol dependence syndrome: measurement and validation. J Abnorm Psychol. 1982;91:199–209. doi: 10.1037//0021-843x.91.3.199. [DOI] [PubMed] [Google Scholar]
- SKINNER HA, SHEU WJ. Reliability of alcohol use indices. The Lifetime Drinking History and the MAST. J Stud Alcohol. 1982;43:1157–70. doi: 10.15288/jsa.1982.43.1157. [DOI] [PubMed] [Google Scholar]
- SMITH A. The symbol digit modalities test: A neuropsychological test of learning and other cerebral disorders. In: HELMUTH J, editor. Learning Disorders. Seattle, WA: Special Child Publications; 1968. [Google Scholar]
- SMITH A. Symbol Digit Modalities Test. Los Angeles, CA: Western Psychological Services; 1982. [Google Scholar]
- SMITH SM. A new class of corner finder. 3rd British Machine Vision Conference, 1992.1992. [Google Scholar]
- SMITH SM. Fast robust automated brain extraction. Human Brain Mapping. 2002;17:143–155. doi: 10.1002/hbm.10062. [DOI] [PMC free article] [PubMed] [Google Scholar]
- SOBELL LC, SOBELL MB. Self-reports issues in alcohol abuse: State of the art and future directions. Behaviorial Assessment. 1990;12:77–90. [Google Scholar]
- SOBELL LC, SOBELL MB, RILEY DM, SCHULLER R, PAVAN DS, CANCILLA A, KLAJNER F, LEO GI. The reliability of alcohol abusers’ self-reports of drinking and life events that occurred in the distant past. J Stud Alcohol. 1988;49:225–32. doi: 10.15288/jsa.1988.49.225. [DOI] [PubMed] [Google Scholar]
- SPIELBERGER CD. State-Trait Anxiety Inventory for Adults: Form Y Review Set - Manual, Test, Scoring Key. Redwood City, CA: Mind Garden, Inc; 1983. [Google Scholar]
- STARR JM, WARDLAW J, FERGUSON K, MACLULLICH A, DEARY IJ, MARSHALL I. Increased blood-brain barrier permeability in type II diabetes 15 demonstrated by gadolinium magnetic resonance imaging. Journal of Neurology, Neurosurgery, and Psychiatry. 2003;74:70–76. doi: 10.1136/jnnp.74.1.70. [DOI] [PMC free article] [PubMed] [Google Scholar]
- STOLTENBERG SF, MUDD SA, BLOW FC, HILL EM. Evaluating measures of family history of alcoholism: density versus dichotomy. Addiction. 1998;93:1511–20. doi: 10.1046/j.1360-0443.1998.931015117.x. [DOI] [PubMed] [Google Scholar]
- STUSS DT, STETHEM LL, PELCHAT G. Three tests of attention and rapid information processing: an extension. The Clinical Neuropsychologist. 1988;2:246–250. [Google Scholar]
- SULLIVAN EV, MARSH L, MATHALON DH, LIM KO, PFEFFERBAUM A. Relationship between alcohol withdrawal seizures and temporal lobe white matter volume deficits. Alcohol Clin Exp Res. 1996;20:348–54. doi: 10.1111/j.1530-0277.1996.tb01651.x. [DOI] [PubMed] [Google Scholar]
- TEN DAM VH, VAN DEN HEUVEL DMJ, DE CRAEN AJM, BOLLEN ELEM, MURRAY HM, WESTENDORP RGJ, BLAUW GJ, VAN BUCHEM MA. Decline in total cerebral blood flow is linked with increase in periventricular but not deep white matter hyperintensities. Radiology. 2007;243:198–203. doi: 10.1148/radiol.2431052111. [DOI] [PubMed] [Google Scholar]
- WECHSLER D. Wechsler Adult Intelligence Scale-Revised. New York: The Psychological Corporation; 1981. [Google Scholar]
- WECHSLER D. Wechsler Adult Intelligence Scale -- Third Edition: Administration and Scoring Manual. San Antonio, TX: The Psychological Corporation; 1997. [Google Scholar]
- WETZEL L, BOLL T. Short Category Test, Booklet Format. Los Angeles, CA: Western Psychological Services; 1987. [Google Scholar]
- WU M, ROSANO C, BUTTERS M, WHYTE E, NABLE M, CROOKS R, MELTZER CC, REYNOLDS CF, AIZENSTEIN HJ. A fully automated method for quantifying and localizing white matter hyperintensities on MR Images. Psychiatry Res. 2006;148:133–142. doi: 10.1016/j.pscychresns.2006.09.003. [DOI] [PMC free article] [PubMed] [Google Scholar]
- XU C, PRINCE JL. Snakes, shapes, and gradient vector flow. IEEETransactions on Image Processing. 1998;7:359–369. doi: 10.1109/83.661186. [DOI] [PubMed] [Google Scholar]
- YOUNG VG. Department of Pathology. Sydney: University of Sydney; 2007. The neuropathology of white matter hyperintensities. [Google Scholar]
- ZHANG Y, BRADY M, SMITH S. Segmentation of brain MR images through a hidden Markov random field model and the expectation-maximization algorithm. IEEE Trans Med Imaging. 2001;20:45–57. doi: 10.1109/42.906424. [DOI] [PubMed] [Google Scholar]