Abstract
The diverse types of neurons and Müller glia in the vertebrate retina are believed to arise from common progenitor cells. To better understand how neural diversity is achieved during retinal neurogenesis, we examined the function of ash1, a proneural bHLH gene expressed in progenitor cells throughout retinal neurogenesis. Published studies using retinal explant culture derived from knockout mice concluded that ash1 is required for the production of late-born neurons, including bipolar cells. In this study, gain-of-function experiments were carried out in ovo in embryonic chick retina. In the developing chick retina, expression of ash1 temporally overlapped with, but spatially differed from, the expression of ngn2, also a proneural gene expressed in progenitor cells throughout retinal neurogenesis. Retrovirus-driven overexpression of ash1 in the developing chick retina decreased the progenitor population (BrdU+ or expressing ngn2), expanded the amacrine population (AP2α+ or Pax6+), and reduced bipolar (chx10 mRNA+) and Müller glial (vimentin+) populations. Photoreceptor deficiency occurred after the completion of neurogenesis. The number of ganglion cells, which are born first during retinal neurogenesis, remained unchanged. Similar overexpression of ngn2 did not produce discernible changes in retinal neurogenesis, nor in ash1 expression. These results suggest that ash1 promotes the production of amacrine cells and thus may participate in a regulatory network governing neural diversity in the chick retina.
Keywords: transcription factor, proneural gene, neurogenesis, retina, amacrine cells
INTRODUCTION
The vertebrate retina contains six major types of neurons (cone photoreceptor, rod photoreceptor, horizontal, bipolar, amacrine, and ganglion) and Müller glia. Retinal neurogenesis progresses in a stereotyped temporal and spatial order that is conserved among vertebrates (Adler, 2000). Temporally, the genesis of the different types of retinal cells follows a gross order with substantial overlaps of first ganglion cells, then cone, horizontal, amacrine, rod, bipolar neurons, and finally Müller glia (Adler, 2000; Rapaport et al., 2004). Spatially, the newborn, differentiating cells of each type accumulate at their prospective locations, where they continue their differentiation and maturation, and establish a complex neural circuitry that sends visual signals to the brain through the axons of ganglion cells. These signals are initiated by photoreceptors and modulated by horizontal, bipolar, and amacrine neurons.
The functionally and morphologically diverse types of retina cells are believed to arise from common progenitors. Proliferating progenitor cells show intrinsic variations in their fate potentials (Braisted et al., 1994; Belliveau et al., 2000; Cayouette et al., 2003). Furthermore, lineage-bias (Alexiades and Cepko, 1997; Huang and Moody, 1997) and lineage-dependence (Otteson and Hitchcock, 2003) are also employed in vertebrate retinal neurogenesis. It has been proposed that proliferating progenitor cells pass through intrinsically determined competence states (Rapaport and Dorsky, 1998; Livesey and Cepko, 2001), during each of which they respond to extrinsic cues, including those emanating from early born cells (Waid and McLoon, 1998), and choose a fate among those defined by the state, resulting in the genesis of distinctive types of cells. Transforming growth factor GDF11 is reported to regulate progenitor competence (Kim et al., 2005), and proneural gene ath5 confers competence for ganglion cells (Yang et al., 2003; Mu et al., 2005). Nonetheless, much needs to be learned regarding the intrinsic factors underlying changes in competence and the transcriptional regulatory mechanisms that direct the seemingly rigid yet flexible competence of the progenitors to ensure a balanced production of the different types of retinal cells.
While the transcriptional regulatory network governing retinal neurogenesis includes transcription factors of various types/families, mounting data point to unequivocal contributions of proneural basic Helix-Loop-Helix (bHLH) genes homologous to Drosophila achaete-scute and atonal in guiding a progenitor to a particular path. The vertebrate retina expresses a number of such bHLH genes (Vetter and Brown, 2001; Yan et al., 2005), including ash1 and neurogenin2 (ngn2). Expression of ash1 in the retina is restricted to progenitor cells (Jasoni et al., 1994; Tomita et al., 1996). In the chick retina, expression of ash1 is detected at early phase of neurogenesis (Matter-Sadzinski et al., 2005; Ma et al., submitted) and persists throughout the entire period of neurogenesis (Jasoni et al., 1994). Studies using retinal explants derived from ash1-null mice show that ash1 is required in the production of late-born neurons, including rod photoreceptors and bipolar cells (Tomita et al., 1996). In ash1/ath3 double knockouts, the production of bipolar cells is virtually abolished (Tomita et al., 2000), indicating that both ash1 and ath3 are involved in bipolar cell generation. However, misexpression of ash1 or ath3 alone does not promote bipolar cell genesis, but comisexpression of ash1, ath3, and chx10 increases bipolar cell number (Hatakeyama et al., 2001). Based on its expression profile, Jasoni et al. (1994) postulated that chick ash1 promotes amacrine cell genesis.
Like ash1, ngn2 is expressed in the proliferating zone of the developing retina (Brown et al., 1998; Marquardt et al., 2001), including cells still in the cell cycle (Yan et al., 2001; Ma and Wang, 2006). In the mouse retina, regions lacking ngn2 expression contain no photoreceptor cells, indicating ngn2's role in photoreceptor genesis (Marquardt et al., 2001). Analyses of retinas from double and triple knockouts indicate that ngn2 may play an important role in horizontal cell genesis (Akagi et al., 2004). A fate mapping study showed that cells expressing ngn2 develop into all major cell types in the mouse retina (Ma and Wang, 2006). Ectopic expression of ngn2 in cultured retinal pigment epithelial (RPE) cells induces de novo generation of cells that molecularly and morphologically resemble various types of retinal neurons, including ganglion cells and photoreceptor cells (Yan et al., 2001).
To gain insight into how the genesis of neural diversity is achieved in the retina, we studied the function of ash1 and ngn2 using replication competent avian splice (RCAS) retrovirus (Hughes et al., 1987) to drive gene overexpression in ovo in the embryonic chick retina. We found that ash1 overexpression led to an overproduction of amacrine cells and a reduction in bipolar cells and Müller glia, whereas ngn2 overexpression resulted in no detectable alteration in retinal neurogenesis. Our data indicate that chick ash1 increases amacrine cell production and thus may participate in a bHLH transcriptional regulatory network that governs the genesis of different cell types in the retina.
METHODS
Chick Embryos
Fertilized, pathogen free chicken (White Leghorn) eggs were purchased from Spafas (Preston, CT) and incubated in a Petersime incubator (Gettysburg, OH). All use of animals adhered to the procedures and policies set by the Institutional Animal Use and Care Committee at the University of Alabama at Birmingham.
In Situ Hybridization
Digoxigenin (Dig)-labeled antisense RNA probes were synthesized using the Genius kit (Roche Molecular Biochemicals) following the manufacturer's instructions. Dig-labeled RNA probe against ash1 was 977 nucleotides in length, covering the entire coding region and the 3′ flanking sequence. The anti-chx10 RNA probe was 600 nucleotides from the 3′ untranslated sequence. The anti-ngn2 RNA probe was 788 nucleotides in length, corresponding to the C-terminal 61 residues plus the 3′ untranslated region (Yan et al., 2001). In situ mRNA hybridization on cryosections (10 μm) of retinal tissues was performed as previously described (Yan and Wang, 1998).
Construction of Retroviruses Expressing ash1, ash1ΔN, and ash1ΔC
The coding region of ash1 was PCR-amplified from retinal cDNA derived from day 6 chick embryos (E6) with the 5′ primer as acc atg gcc agc ggc agc and the 3′ primer as gcg gcc gct cag aac cag ctg gtg aag, based on published information (Jasoni et al., 1994). After cloning into pGEM-T (Promega, Madison, WI) and sequence verification, the coding region of ash1 was subcloned into shuttle vector ClaI2Nco (Hughes et al., 1987) modified to include a Not I restriction site in its multiple cloning site. A Cla I-Not I fragment containing ash1 was then subcloned into RCAS-L14, which is RCAS (Hughes et al., 1987) with the addition of a polylinker sequence to facilitate cloning.
To generate ash1ΔN, the coding sequence without the first 52 amino acids was PCR amplified (5′ primer: cca tgg cgg gcg ggc ggc cgt; 3′ primer: gcg gcc gct cag aac cag ctg gtg aag). To generate ash1ΔC, the coding sequence omitting the C-terminal 33 amino acids was PCR amplified (5′ primer: acc atg gcc agc ggc agc; 3′ primer: gcg gcc gct cag gag ttc atg tcg tgg). ash1ΔN and ash1ΔC were first cloned into ClaI2Nco and subcloned into RCAS-L14. During cloning process, we generated a recombinant (rb) form of ash1ΔC, ash1ΔCrb, which contains 19 extra amino acids (at the C-terminus of ash1ΔC) derived from the shuttle vector Cla12Nco. ash1ΔCrb was subcloned into RCAS for virus production. All recombinant RCAS constructs were sequenced for verification and for ruling out possible changes including frameshift or nonsense mutations.
Production of Retroviruses
Recombinant proviruses (in plasmid form) were transfected into chick embryonic fibroblast cells, and retroviruses were harvested and concentrated as previously described (Yan and Wang, 1998). Concentrated viral stocks of RCAS-GFP and RCAS-ngn2 were produced as described (Yan and Wang, 1998; Yan et al., 2001). The titers of the viral stocks were 2−5 × 10⁸ pfu/mL.
Microinjection of Retroviruses
Retrovirus (RCAS-ash1, RCAS-ash1ΔN, RCAS-ash1ΔC, RCAS-ash1ΔCrb, RCAS-ngn2, or RCAS-GFP) was repeatedly microinjected into the neural tube and the subretinal space to achieve a near thorough infection of the retina (Yan and Wang, 1998). The initial injection took place at E2.5 (after ∼64 h of incubation, HH stage 15–17), followed by two subsequent injections at 3-h intervals. Retinas were harvested at different developmental stages and analyzed by histology in combination with immunochemistry and in situ hybridization.
Immunocytochemistry
Chick retinas infected with RCAS retrovirus expressing various transgenes or GFP as a control were fixed with ice-cold 4% paraformaldehyde. Cryosections of 10 μm were collected on glass slides and subjected to immunohistochemistry or in situ hybridization. The following monoclonal antibodies were obtained from the Developmental Studies Hybridoma Bank (Iowa University, Iowa City, IA): anti-Visinin (7G4; 1:500), anti-Vimentin (H5; 1:500), anti-LIM (4F2; 1:50), anti-BrdU (B3B4, 1:200), anti-Pax6 (1:100), and anti-AP2α (3B5; 1:50). Additional antibodies included: rabbit polyclonal antibodies against viral protein p27 (1:1000 or 1:200 for retinal sections already subjected to in situ hybridization; Spafas) and against AP2α (1:200; Santa Cruz, Biotechnology, Santa Cruz, CA), and monoclonal antibodies against Brn3a (1:200; Chemicon, Temecula, CA) and RA4 (1:500 dilution; a gift from Steven McLoon, University of Minnesota, Minneapolis, MN). Standard procedures for immunocytochemistry were followed.
TUNEL Assay
TUNEL assay was used to detect the presence of apoptotic cells in retinal sections, using the In Situ Cell Death Detection Kit (Roche Molecular Biochemicals) following the manufacturer's instruction.
Pulse-Labeling Chick Embryos with BrdU and Double Staining
BrdU (50 μg in 50 μL of HBSS) was dropped through an opening in the shell onto the vitelline membrane of E6, E8, and E10 chick embryos. The embryos were incubated for 4 h before the eyes were enucleated and fixed with 4% paraformaldehyde. BrdU incorporation was detected using a specific antibody as previously described (Li et al., 1999).
Quantitative Analysis of Retinal Cell Populations in Histological Sections
Cryosections of retinas partially infected with RCAS expressing a transgene, or GFP as a control, were used in a quantitative analysis of the effects on cell populations from the transgene after double-labeling for viral protein p27 and specific retinal cell markers, BrdU, or TUNEL. The number of positive cells was scored in the infected region, which was identified by anti-p27 immunoreactivity, along with that in an adjacent, uninfected region (p27-negative) of the same size (length in pixels). A ratio of the number in infected region over that in uninfected region was used in calculating the means and standard deviations (SD) from 6 to 12 independent areas using Origin® Pro7 (OriginLab).
Quantitative Analysis Using Dissociated Retinal Cells
E9 retinas from three embryos infected with RCAS-ash1 (or E8 retinas infected with RCAS-ash1ΔCrb) or the control virus RCAS-GFP were pooled, and their cells were dissociated by incubation with trypsin/EDTA followed by mechanical trituration. Dissociated retinal cells were seeded onto polyornithine-treated coverslips for 4 h in a cell culture incubator. To achieve a cell density suitable for counting, cells equivalent to 1/30th of an E9 retina were seeded into each 35-mm dish. Cells were then fixed with ice-cold 4% paraformaldehyde for 30 min at room temperature and subjected to immunostaining or in situ hybridization to identify the major types of retinal cells. Mounting medium contained DAPI (VECTASHIELD®, Vectorlab). Images of dissociated neurons were counted under a Nikon® eclipse TE300 microscope (Nikon) or an Olympus BX60 microscope. Cells which were DAPI positive or DAPI/cell marker double positive were counted, respectively. For each dish, cells were counted in 10 view areas under a 20× objective, and the ratio of double positive cells to DAPI positive cells was calculated. For each cell marker, the means and SD were calculated from three dishes using Origin® Pro7 (OriginLab).
RPE Transdifferentiation Assay
E6 chick RPE was isolated as described (Yan and Wang, 1998). RPE cells were dissociated by incubation with typsin-EDTA and mechanical trituration. The dissociated cells were cultured with knock-out DMEM plus 20% serum replacement (Invitrogen). When the culture became ∼50% confluent, 10–20 μL of RCAS-ngn2, or RCAS-GFP as a control, was added to each 35-mm dish. The culture was further maintained for 8 days, and its cells were then fixed for immunocytochemistry with a rabbit polyclonal antibody against calretinin (1:500; Chemicon), monoclonal antibody against visinin (7G4), and monoclonal antibody RA4.
RESULTS
Expression of ash1 in the Chick Retina
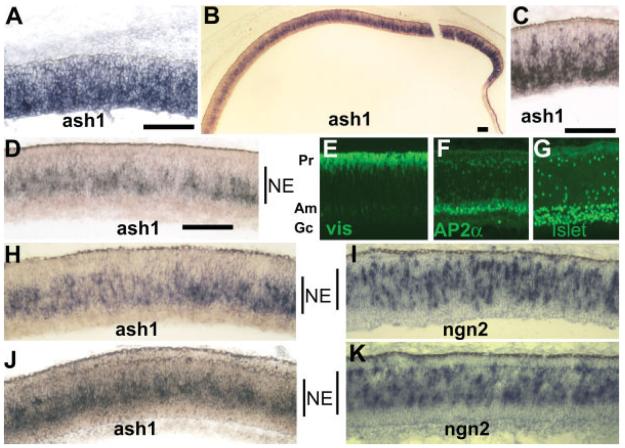
In situ hybridization was used to identify cells that expressed ash1. Dig-labeled RNA probes marked a few cells in the retina of E3.5 (Ma et al., submitted), when retinal neurogenesis is beginning in the chick. By E6, ash1 mRNA was detected in a large number of cells [Fig. 1(A)] in the retinal neuroepithelium. A high level of ash1 expression persisted until E8, when ash1 expression appeared to be diminishing in the central region in comparison with the periphery [Fig. 1(B)]. This pattern coincided with neurogenesis, which diminishes first in the central retina with the peripheral retina lags behind. In the central retina at E8, ash1-expressing cells were confined to the zone approximately in the middle of the pseudo-stratified neuroepithelium [NE; Fig. 1(B,D,H,J)]. No expression of ash1 was apparent at the prospective locations of photoreceptor cells [visinin+, Fig. 1(E)], amacrine cells [AP2α+, Fig. 1(F)], and ganglion cells [Islet-1+, Fig. 1(G)]. By E10, ash1 expression was detected only at the periphery (data not shown). This temporal pattern of ash1 expression resembled that of ngn2 (Yan et al., 2001). However, there was discernible spatial difference between the expression of ash1 and ngn2. At the outer portion of the neuroepithelium zone at E8, there were fewer ash1-expressing cells than ngn2-expressing cells [Fig. 1(H–K)]. While cells expressing ngn2 appeared to spread across the neuroepithelium zone of progenitor cells [Fig. 1(I,K)], cells expressing ash1 seemed to concentrate to the inner portion of the progenitor zone [Fig. 1(D,H,J)]. The spatial difference was evident both before [Fig. 1(H,I)] and after [Fig. 1(J,K)] the demarcation of the three nuclear layers of the retina became visible.
Figure 1.
Expression of ash1 in the developing chick retina detected with dig-labeled antisense RNA probe. A: ash1 expression in E6 retina. B: ash1 expression at E8. C: Higher magnification of a peripheral region at E8. D: Higher magnification of a central region at E8. E–G: Immunostaining to mark the anatomical locations in a pseudostratified E8 retina of photoreceptor cells (Pr, visinin+, E), amacrine cells (Am, AP2α+, F), and ganglion cells (Gc, Islet-1+, G). H–K: Comparison of the spatial distribution of cells expressing ash1 (H, J) with that of cells expressing ngn2 (I, K), in developmental stage-matched regions of E8 retinas (H, I; and J, K). The neuroepithelial zone (NE) within the developing retina is marked, approximately, by a vertical line. Scale bars: 100 μm.
Embryonic Lethality of ash1 Overexpression
The replication competent avian leukosis virus RCAS (Hughes et al., 1987) was used to drive the overexpression of ash1 or ngn2 in chick embryos. This virus infects an increasing number of cells over time in a proliferating cell population (Reddy et al., 1991; Fekete and Cepko, 1993) because of subsequent infections by viruses released from infected cells. Expression of a transgene from the virus is minimal 12 h after infection and becomes apparent 21–24 h after infection (Reddy et al., 1991; Fekete and Cepko, 1993). RCAS-ash1, RCAS-ngn2, or RCAS-GFP was microinjected into the subretinal space and the lumen of the neural tube at E2.5 (∼64 h of incubation) through ∼E3 (70 h of incubation), when the two remain connected. This procedure results in the retention of the majority of injected viral suspension in the subretinal space and in the neural tube. Minor spill-over often occurs while withdrawing the micropipette and a small amount of viral suspension may enter the blood stream (Yan and Wang, 2001). All these and the replication-competence of the virus result in a widespread viral infection in both the nervous system and in the systemic regions (Yan and Wang, 2001). Expression of the transgene was expected to begin ∼E3.5 and to persist thereafter until the retina was harvested for analysis.
Most of the embryos infected with RCAS-ash1 died around E10, and none survived longer than E16 (Table 1). Immunostaining with an antibody against a viral protein p27 showed that those surviving past E12 had limited viral infection. No embryonic lethality was observed with RCAS-ngn2 (n > 50). Similar infection with the control virus RCAS-GFP had no effect on survival (n > 100; Yan and Wang, 2001).
Table 1.
Embryonic Lethality Because of ash1 Overexpression
| Age | No. Dead/Total | Death Rate (%) |
|---|---|---|
| E2 | 0/76 | 0 |
| E4 | 0/76 | 0 |
| E6 | 5/76 | 7 |
| E8 | 7/59 | 12 |
| E10 | 30/49 | 81 |
| E16 | 4/4 | 100 |
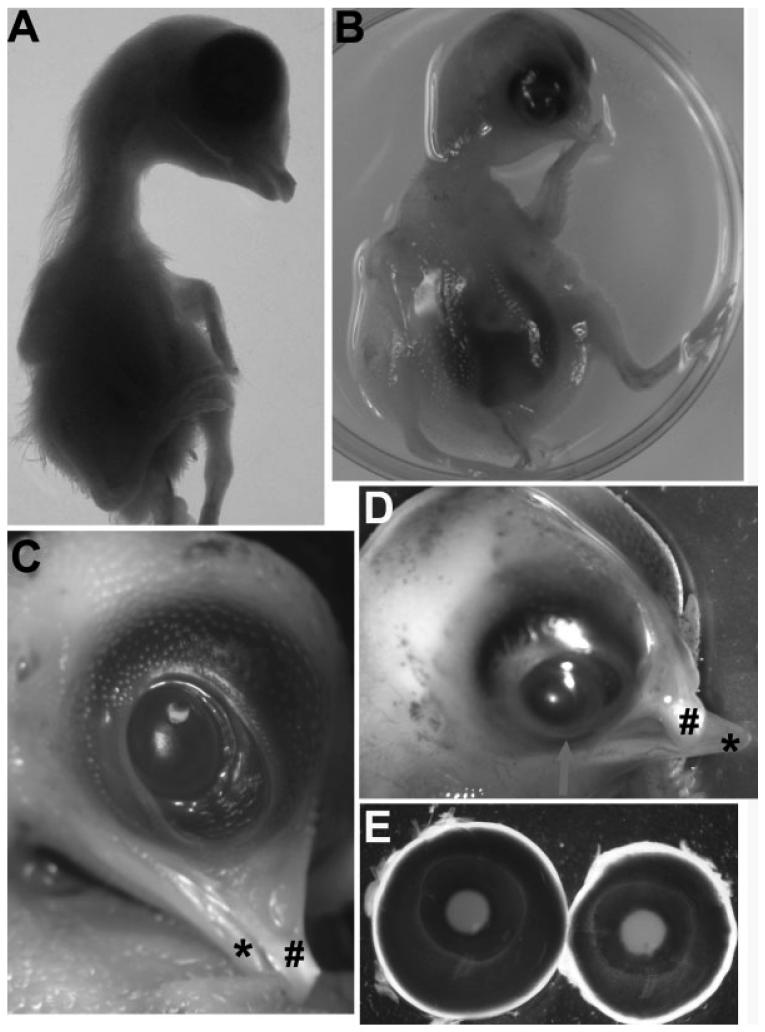
Chick embryos infected with RCAS-ash1 exhibited gross abnormalities, including microphthalmia [Fig. 2(B,D)], loss of eye lids, corneal protrusion [Fig. 2(D)], hypopigmentation in the uvea [Fig. 2(E)], a short upper beak whose tip deviated toward the right side, the side receiving microinjection [Fig. 2(D)], and fatty liver (data not shown). The gross abnormalities were noticeable from E8 and became more conspicuous at later stages. These abnormalities were not observed with RCAS-ngn2 (data not shown), nor with the control virus RCAS-GFP [Fig. 2(A,C,E)] (Li et al., 1999; Yan and Wang, 2001).
Figure 2.
Gross abnormalities from ash1 overexpression. A: An E12 control embryo infected with RCAS-GFP. B: An E12 embryo infected with RCAS-ash1. C: A closer view of the head region of A. “#” denotes the upper beak, whereas “*” marks the lower beak. D: A closer view of the head region of B. “#” denotes the curved upper beak, whereas “*” marks the lower beak. E: A comparison of E10 eyes from the experimental embryo (left) and the control (right).
Overproduction of Amacrine Cells from ash1 Overexpression
Studies showed that RCAS-driven overexpression of bHLH genes may alter retinal neurogenesis in a gene-specific manner (Yan and Wang, 1998; Li et al., 2001; Liu et al., 2001; Xie et al., 2004). We first tested the effect of ngn2 overexpression on retinal neurogenesis by microinjecting E2.5 embryos with RCAS-ngn2. A previous study showed RCAS-ngn2 induces de novo genesis of cells molecularly and morphologically resembling retinal neurons from non-neural RPE cell culture (Yan et al., 2001). Histological analysis of the retinas infected with RCAS-ngn2, either completely [Fig. 3(A)] or partially [Fig. 3(B)], revealed no alterations. Molecular analyses with markers identifying different types of cells showed no changes either (data not shown). Thus, overexpression of ngn2 produced no detectable alterations in the developing retina, even though ngn2 can elicit retinal neurogenesis in the context of cultured RPE cells.
Figure 3.
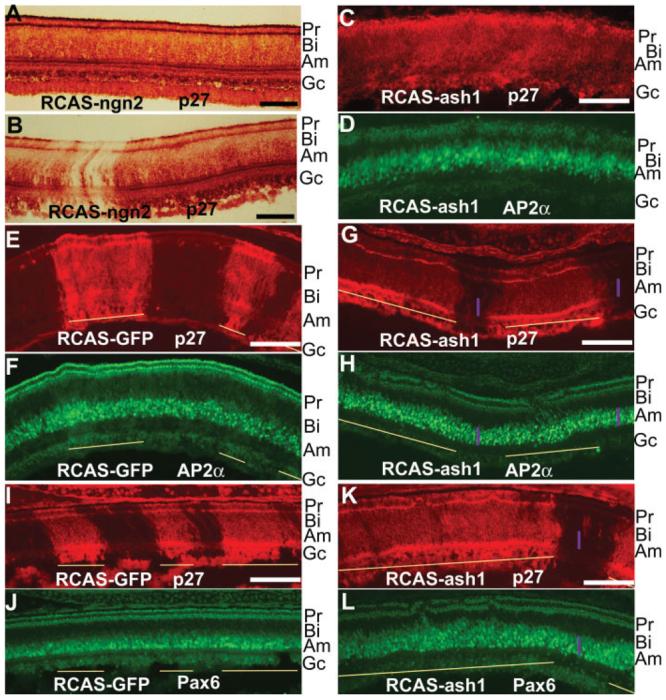
Expansion of amacrine territories in retinas infected with RCAS-ash1. A, B: Immuno-staining for viral protein p27 in E12 retinas thoroughly (A) or partially (B) infected by RCAS-ngn2. C, D: Double-labeling of an E8 retina thoroughly infected with RCAS-ash1 for viral protein p27 (C) and for AP2α (D). E, F: Double-labeling of an E10 control retina partially infected with RCAS-GFP for p27 to identify viral infection (E) and for AP2α to identify amacrine cells (F). G, H: Double-labeling of an E10 retina partially infected with RCAS-ash1 for p27 (G) and for AP2α (H). I, J: Double-labeling of an E10 control retina partially infected with RCAS-GFP for p27 (I) and for Pax6 to identify amacrine cells (J). K, L: Double-labeling of an E10 retina partially infected with RCAS-ash1 for p27 (K) and for Pax6 (L). Purple bars mark the domain thickness of AP2α+ cells (G, H) or Pax6+ cells (K, L). Yellow lines mark virally infected regions. The anatomical location of each major cell type is marked on the right. Pr, photoreceptors; Bi, bipolar cells; Am, amacrine cells; Gc, ganglion cells. Scale bars: 100 μm.
Retinas infected with RCAS-ash1 showed both histological and molecular alterations. Retinas overexpressing ash1 often appeared disorganized, with their outer nuclear layer (the photoreceptor layer) no longer a contiguous structure. To determine whether retinal neurogenesis was altered upon ash1 overexpression, we examined the population of each major cell type with immunostaining or in situ hybridization. Among the six major cell types examined (photoreceptor, bipolar, horizontal, amacrine, ganglion, and Müller glial cells), only amacrine cells, identified with anti-AP2α antibodies (Bisgrove and Godbout, 1999) and Pax6 expression (Belecky-Adams et al., 1997), were overproduced. In the normal chick retina, amacrine cells occupy roughly the lower half of the inner nuclear layer, while bipolar cells the upper half, with the cell body of Müller glia in the middle and horizontal cells on the very top. In retinas infected with RCAS-ash1, amacrine cells occupied most of the inner nuclear layer, leaving a narrow zone of space for bipolar cells [Fig. 3(C,D)]. To minimize ambiguity associated with comparing retinal sections of different eyes, we generated partially infected retinas using a single microinjection, instead of repetitive microinjections. A partially infected retina allows for a direct comparison between virally infected and uninfected regions at adjacent locations in the same retinal section. Infection by RCAS-GFP did not affect the amacrine territory occupied by AP2α+ cells [Fig. 3(E,F)] or Pax6+ cells [Fig. 3(I,J)]. In retinas infected with RCAS-ash1, there was an expansion of AP2α+ [Fig. 3(G,H)] and Pax6+ [Fig. 3(K,L)] amacrine territory into the bipolar territory in infected regions compared with the adjacent, uninfected regions (internal controls). The immunostaining signals of the “extra” AP2α+ amacrine cells were relatively weaker than those of the “innate” ones [Fig. 3(H)].
To quantify the changes, the numbers of AP2α+ and Pax6+ cells were scored in the regions infected with RCAS-ash1, as well as in the adjacent, uninfected regions of the same size/length. Statistical analysis showed that the AP2α+ population was increased from a ratio (infected/uninfected) of 1.04 ± 0.06 in the control infected by RCAS-GFP to that of 1.27 ± 0.26 in the experimental retina [p < 0.05; Fig. 5(A)]. Likewise, the Pax6+ population was increased from 1.01 ± 0.16 in the control to 1.38 ± 0.22 in the experimental retina [p < 0.01; Fig. 5(A)].
Figure 5.
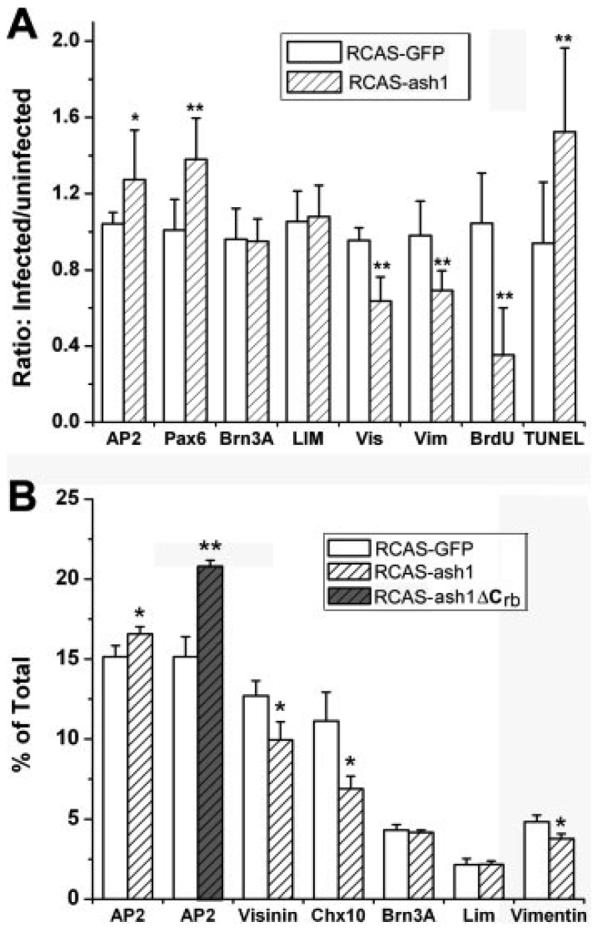
Quantitative analyses of the effect of ash1 overexpression on various retinal cell populations. A: A plot of the ratios of immuno-positive cells in infected regions over adjacent, uninfected regions in retinal sections. B: The percentage of cells positive for each marker. Data were obtained using dissociated E9 retinal cells (or E8 for RCAS-ash1ΔCrb) seeded into culture dishes. AP2, AP2α for amacrine cells; Pax6 for amacrine cells; Brn3A for ganglion cells; LIM for horizontal cells; Vis, visinin for photoreceptor cells; Vim, vimentin for Müller glia; chx10 mRNA for bipolar cells; BrdU for proliferating cells; TUNEL for apoptotic cells. Shown are means ± SDs. “*” indicates statistically significant at p < 0.05 level, and “**” at p < 0.01 level.
The domain of bipolar cells, identified with chx10 expression (Belecky-Adams et al., 1997), was not affected by infection with RCAS-GFP [Fig. 4(A,B)]. The chx10 mRNA+ domain, however, was decreased in the infected region compared with the uninfected region in retinas partially infected with RCAS-ash1 [Fig. 4(C,D)]. Similarly, infection by RCAS-GFP had no apparent effect on Müller glia population [Fig. 4(E,F)], identified with an anti-vimentin antibody (Herman et al., 1993), but overexpression of ash1 decreased the Müller glia population, as fewer vimentin+ cellular processes were present in the infected region than the uninfected region [Fig. 4(G,H)]. In regions infected by RCAS-ash1, deficiency in photoreceptor (visinin+; Yamagata et al., 1990) was also observed [Fig. 4(K,L)], whereas no such deficiency was observed in the control retina [Fig. 4(I,J)]. The photoreceptor deficiency, however, was not detectable at E6, the peak of photoreceptor genesis (Belecky-Adams et al., 1996), but became conspicuous at E10. No changes in the sizes of domains occupied by horizontal cells (LIM+; Liu et al., 2000) or ganglion cells (Brn3A+; Xiang et al., 1995) were observed. Statistical analysis showed that the visinin+ population was reduced from a ratio (infected/uninfected) of 0.95 ± 0.07 in the control to that of 0.64 ± 0.13 in the experimental retina [p < 0.01; Fig. 5(A)]. Similarly, the vimentin+ population was decreased from 0.98 ± 0.18 to 0.69 ± 0.10 (p < 0.01). No significant changes in the number of Brn3A+ (p = 0.88) and LIM+ (p = 0.75) cells in retinas infected with RCAS-ash1 compared with the control infected with RCAS-GFP [Fig. 5(A)].
Figure 4.
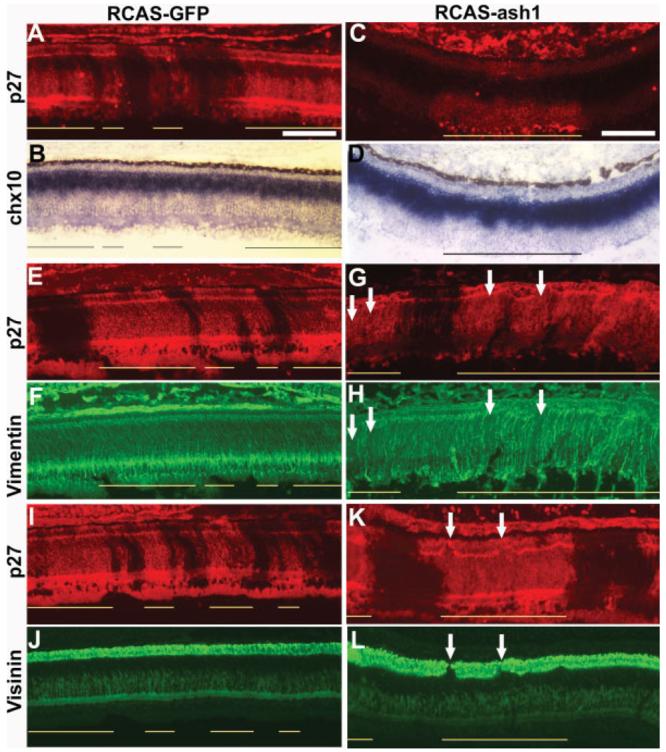
Reductions in retinal cell populations in retinas infected with RCAS-ash1. A, B: Double-labeling of an E10 control retina partially infected with RCAS-GFP for p27 to identify viral infection (A) and for chx10 expression (in situ hybridization) to identify bipolar cells (B). C, D: Double-labeling for viral protein p27 (C) and for chx10 mRNA (D) of an E10 retina partially infected with RCAS-ash1. E–H: Double-labeling for viral protein p27 (E, G) and for vimentin (F, H) of E10 retinas infected with RCAS-GFP (E, F) or RCAS-ash1 (G, H). Arrows point to regions missing vimentin+ cellular processes. I–L: Double-labeling for viral protein p27 (I, K) and for visinin (J, L) of E10 retinas infected with RCAS-GFP (I, J) or RCAS-ash1 (K, L). Arrows point to regions lacking visinin+ cells. Scale bars: 100 μm.
For an additional quantitative analysis and to avoid histological variations, the number of cells in each major population was scored using dissociated E9 retinal cells. In the control, 15.1% of the cells from RCAS-GFP infected retinas were AP2α+. In the experimental retinas, AP2α+ cells accounted for 16.5% of the total cells [p < 0.05; Fig. 5(B)]. In contrast, the percentage of cells expressing chx10 decreased from 11.1% in the control to 6.9% in the experimental retina (p < 0.05), and that of vimentin+ was reduced from 4.9 to 3.8% (p < 0.05). Reduction in photoreceptor cells (visinin+) was also observed (p < 0.05). No statistically significant changes were observed in cells positive for horizontal cell marker LIM or ganglion cell marker Brn3A [Fig. 5(B)]. Notably, in retinas overexpressing a recombinant form of ash1, ash1ΔCrb (more details later), the increase in amacrine cells was more pronounced: from 15.1% in the control to 20.7% in the experimental retinas, an 37% increase [Fig. 5(B)].
Decrease in Progenitor Population from ash1 Overexpression
The microphthalmia (small eyes) in chicks overexpressing ash1 suggested impaired cell proliferation or enhanced cell death, or both, in the retinas. BrdU incorporation analysis showed that in retinal regions infected with RCAS-ash1, there were fewer BrdU+ cells than in the adjacent, uninfected regions [Fig. 6(C,D)]. No reduction was apparent in the control infected with RCAS-GFP [Fig. 6(A,B)].
Figure 6.
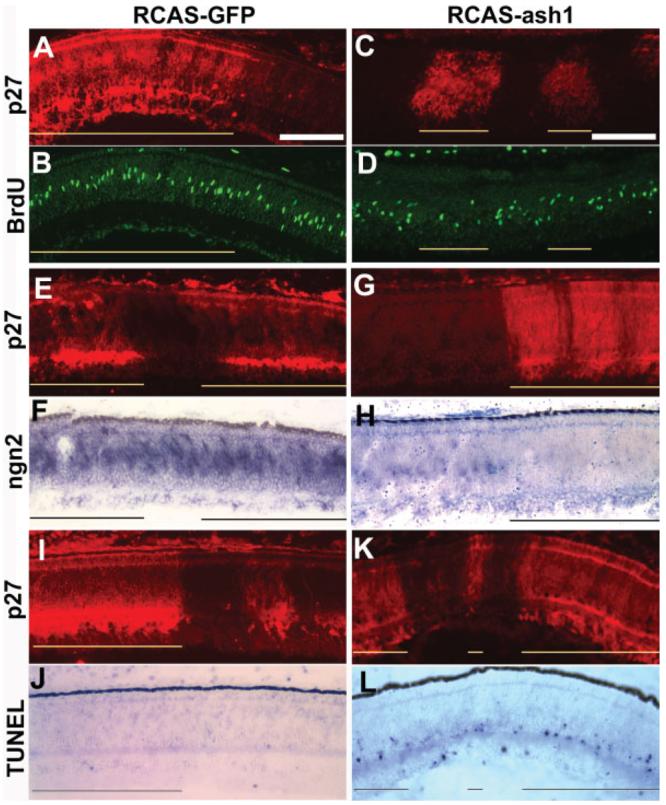
Reduction in progenitor pool and increase in cell death in retinas infected with RCAS-ash1. A–D: Double-labeling of E8 retinas infected with RCAS-GFP (A, B) or RCAS-ash1 (C, D) for viral protein p27 to identify infected regions (A, C) and for BrdU incorporation (B, D). E–H: Double-labeling of E8 retinas infected with RCAS-GFP (E, F) or RCAS-ash1 (G, H) for viral protein p27 (E, G) and for ngn2 mRNA with in situ hybridization (F, H). I–L: Double-labeling of E10 retinas infected with RCAS-GFP (I, J) or RCAS-ash1 (K, L) for viral protein p27 (I, K) and for cell death with TUNEL assay (J, L). Infected regions are indicated by lines. Scale bars: 100 μm.
Overexpression of ash1 diminished progenitor cells that expressed ngn2. In regions infected by the RCAS-ash1, fewer cells were ngn2 mRNA+, in comparison with the adjacent, uninfected regions [Fig. 6(G,H)]. Similar infection with RCAS-ngn2 had no effect on the expression of ash1 (data not shown). Infection with RCAS-GFP did not effect ngn2 expression [Fig. 6(E,F)] or ash1 expression (data not shown). With ash1 or ngn2 overexpression, the expression of neuroD, a bHLH gene mostly expressed in postmitotic cells (Liu et al., 2008) remained unchanged (data not shown).
The TUNEL assay was used to detect apoptotic cells in the retina. In the normal chick retina, the developmental death of ganglion cells occurs around E10, followed by the death of amacrine cells and bipolar cells (Cook et al., 1998). In retinas infected with RCAS-ash1, there were more TUNEL+ cells in the amacrine cell layer, in comparison with adjacent, uninfected regions, in which TUNEL+ cells were confined to the ganglion cell layer [Fig. 6(K,L)]. Infection with RCAS-GFP did not trigger substantial cell death, and very few TUNEL+ cells were seen among amacrine cells infected with RCAS-GFP [Fig. 6(I,J)] (Li et al., 1999). Statistical analysis [Fig. 5(A)] showed that the number of BrdU+ cells was reduced from a ratio (infected/uninfected) of 1.04 ± 0.26 in the control to 0.35 ± 0.25 in the experimental retinas (p < 0.01). On the other hand, the number of TUNEL+ cells was increased from 0.94 ± 0.32 in the control to 1.52 ± 0.44 in the experimental retinas (p < 0.05).
Specificity of amacrine overproduction from ash1 overexpression
Published studies showed that RCAS-driven overexpression of bHLH genes may alter retinal neurogenesis in a gene-specific manner. For instance, neuroD overexpression results in an overproduction of photoreceptor cells without alternating amacrine population (Yan and Wang, 1998). Overexpression of ath5, either alone (Liu et al., 2001) or in combination with NSCL1 (Xie et al., 2004), promotes ganglion cell production (Xie et al., 2004). Overexpression of NSCL2 causes atrophies of photoreceptor cells and Müller glia, but has no apparent effect on amacrine population (Li et al., 2001). Our recent studies show that similar overexpression of ngn3 results in ganglion overexpression at the expense of amacrine properties (Ma et al., submitted).
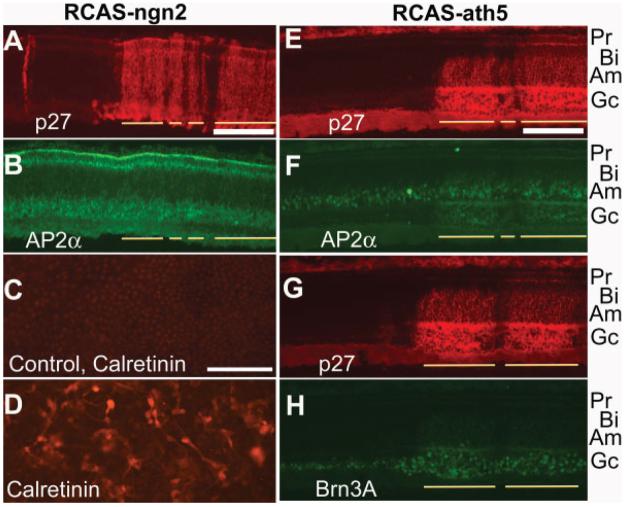
To further address whether the amacrine overproduction from ash1 overexpression was gene-specific, we first analyzed amacrine population in retinas infected with RCAS-ngn2. We found no increase in the number of AP2α+ cells [Fig. 7(A,B)]. To verify that functional Ngn2 protein was synthesized from the RCAS-ngn2 virus, we used an RPE transdifferentiation assay. In this bioassay, dissociated RPE cell culture was established and infected with RCAS-ngn2, or RCAS-GFP as a control. Cells in the culture were fixed 8 days after the administration of the virus and subjected to immunocytochemistry with markers that identify various types of retinal neurons. In RPE cell culture infected with RCAS-ngn2, a large number of cells developed neural morphologies and expressed neural markers, including calretinin [Fig. 7(D)], which in the chick retina identifies horizontal, amacrine, and ganglion cells (Ellis et al., 1991; Fischer et al., 2007), as well as visinin (data not shown; Yan et al., 2001) and RA4 (data not shown; Yan et al., 2001). No calretinin+ cells were detected in the control culture infected with RCAS-GFP [Fig. 7(C)]. Thus, the lack of phenotype in the retina infected with RCAS-ngn2 was not because of a lack of Ngn2 protein synthesis from the RCAS-ngn2 virus.
Figure 7.
Lack of amacrine overexpression in retinas infected with RCAS-ngn2 and RCAS-ath5. A, B: Double-labeling of an E10 retina infected with RCAS-ngn2 for viral protein p27 to label infected regions (A) and for AP2α to identify amacrine cells (B). C, D: Immunostaining for calretinin of RPE cell cultures infected with control virus RCAS-GFP (C) or RCAS-ngn2 (D). E–H: Double-labeling of an E10 retina infected with RCAS-ath5 for viral protein p27 (E, G) and for AP2α to label amacrine cells (F) or for Brn3A to identify ganglion cells (H). Infected regions are indicated by lines. The anatomical location of each major cell type is marked on the right. Pr, photoreceptors; Bi, bipolar cells; Am, amacrine cells; Gc, ganglion cells. Scale bars: 100 μm.
Next, we examined amacrine population in retinas infected with RCAS-ath5. We found no increase in the AP2α+ population [Fig. 7(E,F)], in spite of an expansion of Brn3A+ ganglion population [Fig. 7(G,H)] as previous studies have shown (Liu et al., 2001; Xie et al., 2004).
The N- and C-Terminal Regions in ash1's Function
Besides the bHLH domain, the functional domains of ash1 protein remain unclear. We thus constructed two viruses expressing truncated ash1 proteins: one missing its N-terminal 52 residues [ash1ΔN; Fig. 8(A)] and the other lacking the C-terminal 33 residues (ash1ΔC). A recombinant form of ash1ΔC, ash1ΔCrb, was also produced during our cloning process. The deduced protein from ash1ΔCrb differs from ash1ΔC by containing 19 extra residues at the C-terminus derived from shuttle vector Cla12Nco [Fig. 8(A)].
Figure 8.
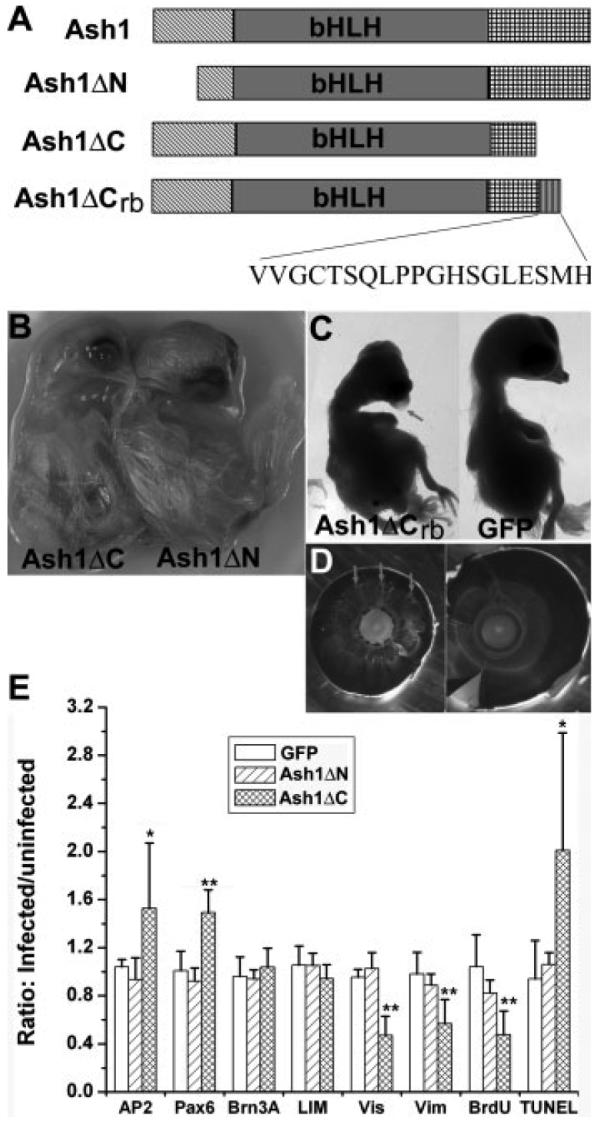
Varied effects on embryo development of different constructs derived from ash1. A: A schematic diagram showing the structural regions included in each construct. B: E14 embryos infected with RCAS-ash1ΔC (left) or RCAS-ash1ΔN (right). C: E12 embryos infected with RCAS-ash1ΔCrb (left) or RCAS-GFP (right). D: A comparison of an eye from an E12 embryo infected with RCAS-ash1ΔCrb (left) with the control (right). Arrows point to regions with hypo-pigmentation. E: A plot of the ratios of immuno-positive cells in infected regions over those in the adjacent, uninfected regions. Data were obtained from scoring the number of immuno-positive cells in retinal sections. Cell markers are: AP2 (AP2α) and Pax6 for amacrine; Brn3A for ganglion; LIM for horizontal; Vis (visinin) for photoreceptor; Vim (vimentin) for Müller glia; BrdU for proliferating; and TUNEL for apoptotic cells. Shown are means ± SDs. “*” indicates statistically significant at p < 0.05 level, and “**” at p < 0.01 level.
Embryos infected with RCAS-ash1ΔC showed phenotypical changes similar to that observed with RCAS-ash1 [Fig. 8(B,E)]. Embryos infected with RCAS-ash1ΔN, on the other hand, developed normally [Fig. 8(B)] with no apparent alteration in retinal neurogenesis [Fig. 8(E)]. In embryos older than E12, minor disorganizations of retina were observed (data not shown). Embryos infected with RCAS-ash1ΔCrb exhibited all, but more pronounced, phenotypes observed with RCAS-ash1 [Fig. 8(C–E)]. Embryonic death occurred earlier with ash1ΔCrb than with ash1: most of the embryos infected with RCAS-ash1ΔCrb died before E10. Like ash1, ash1ΔCrb overexpression caused microphthalmia, corneal protrusion, and hypo-pigmentation of the eye [Fig. 8(C,D)].
In retinas partially infected with RCAS-ash1ΔN, cell populations that were proliferating [BrdU+, Fig. 9(A,B)], expressing ngn2 [Fig. 9(C,D)], expressing amacrine marker Pax6 [Fig. 9(E,F)], or undergoing apoptotic cell death [TUNEL+, Fig. 9(G,H)] appeared unchanged in the infected regions compared with the adjacent, uninfected regions. The ratios of their numbers in the infected regions over uninfected region are not statistically different from those of the control infected with RCAS-GFP [Fig. 8(E)].
Figure 9.
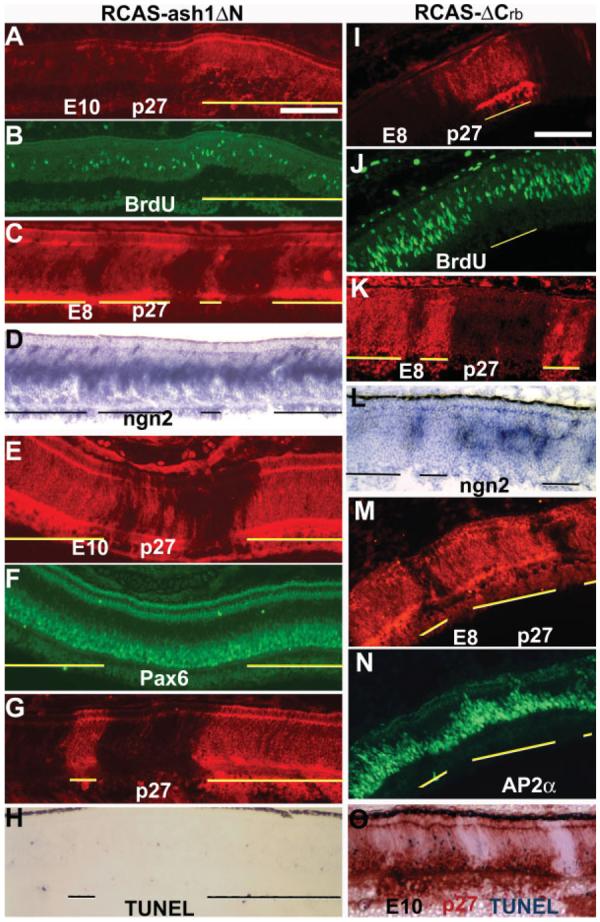
Differential effects on retinal cell populations between RCAS-ash1ΔN and RCAS-ash1ΔCrb. A–H: Double-labeling of E8 (A–D) or E10 (E–H) retinas infected with RCAS-ash1ΔN for viral protein p27 to identify infected regions (A, C, E, G) and for BrdU (B), ngn2 expression (D), Pax6 (F), or TUNEL (H). I–O: Double-labeling of E8 (I–L) or 10 retinas (M–O) infected with RCAS-ash1ΔCrb for viral protein p27 to identify infected regions (I, K, M, O) and for BrdU (J), ngn2 expression (L), AP2α (N), or TUNEL (O). Infected regions are marked by lines. Scale bars: 100 μm.
Like with RCAS-ash1, retinas infected with RCAS-ash1ΔCrb overproduced amacrine cells. In the E7 retina, regions infected with RCAS-ash1ΔCrb contained more AP2α+ cells in both the progenitor layer [Supp. Info. Fig. 1(A,B)] and in the prospective amacrine layer [Supp. Info. Fig. 1(C,D)], compared with the adjacent, uninfected regions. By E8, the territory occupied by AP2α+ cells expanded to the outer nuclear layer [Fig. 9(M,N); Supp. Info. Fig. 1(E,F)]. Scoring the number of AP2α+ with dissociated E8 retina cells showed a 37% increase in comparison with the control [Fig. 5(B)]. In addition, fewer cells expressed chx10 [Supp. Info. Fig. 2(A,B)]. The number of vimentin+ cells was reduced, and these alterations were evident at E8 [Supp. Info. Fig. 2(C,D)] and E10 [Supp. Info. Fig. 2(E,F)]. Photoreceptor deficits also occurred [Supp. Info. Fig. 2(G–I)]. Cells expressing ngn2 were absent in regions infected with RCAS-ash1ΔCrb [Supp. Info. Fig. 3(A–D)]. Absence of ngn2-expressing cells in infected regions was also observed in the brain [Supp. Info. Fig. 3(E,F)]. Cell proliferation activity in the retina, reflected by BrdU incorporation, was decreased by ash1ΔCrb at E6 (data not shown), when cell proliferation is active, and at E8, when cell proliferation activity naturally decreases [Fig. 9(I,J)]. In retinas infected with RCAS-ash1ΔCrb, there was a large number of TUNEL+ cells in the amacrine layer [Fig. 9(O)].
DISCUSSION
In ovo gain-of-function experiments were used to study whether and how ash1 participates in the genesis of neural diversity. Overexpression of ash1 was embryonically lethal. The lethality may not be simply attributed to toxicity of bHLH gene overexpression, even though similar overexpression of NSCL1 (Li et al., 1999) or ngn3 (Ma et al., submitted) is also embryonically lethal, because no lethality has been observed with bHLH genes ngn2, neuroD (Yan and Wang, 1998), ath5 (Xie et al., 2004) or NSCL2 (Li et al., 2001). Thus, the embryonic death observed is likely related to ash1's function, not bHLH genes in general. The gross abnormalities from ash1 overexpression also appeared not because of bHLH gene overexpression in general, as no such abnormalities were observed with the overexpression of ngn2, ath5, or NSLC2. The molecular causes of the lethality and the gross abnormalities are unclear; nevertheless, they showed that sustained expression of ash1 is detrimental to the developing chick embryo.
Overexpression of ash1 resulted in a small eye, likely because of reduced retinal cell proliferation and increased cell death. Fewer BrdU+ cells were present in regions infected with RCAS-ash1 compared with the internal control, and more TUNEL+ cells were detected in retinas infected with RCAS-ash1 compared with the control. Overexpression of ash1 also reduced the number of cells expressing ngn2, but not vise versa. The reduction in ngn2 expressing cells might result from ash1 diminishing progenitor cells; alternatively, it may imply a one-way inhibition of ngn2 expression by ash1.
Like ngn2, ash1 was normally expressed in a large number of progenitor cells in the chick retina with its expression temporally spanning the entire period in which neurogenesis takes place. Spatially, cells expressing ash1 appeared more confined than those expressing ngn2, suggesting a differential expression in subpopulations of progenitor cells. In retinal neuroepithelium, cells expressing ash1 were preferentially localized to where future amacrine cells would reside. Jasoni et al. (1994) believed that there is a temporal and spatial coincidence between amacrine cell genesis and ash1 expression in the developing chick retina and thus has proposed a role of ash1 in the production of amacrine cells. Our in ovo gain-of-function study with RCAS-ash1 showed that ash1 promoted overproduction of amacrine cells. The effect appeared specific to ash1, because the amacrine population was not increased with similar overexpression of bHLH genes ngn2, ath5, neuroD, NSCL1, NSCL2, or ngn3. Overexpression of neuroD results in photoreceptor overproduction (Yan and Wang, 1998); overexpression of ath5 expands ganglion, but not amacrine, populations (Liu et al., 2001; Xie et al., 2004); and overexpression of ngn3 increases ganglion cell production at the expense of amacrine cells (Ma et al., submitted). Even though NSCL2 is expressed in amacrine cells, its overexpression did not expand the amacrine population (Li et al., 2001). The source of those “extra” amacrine cells in ash1-overexpressing retinas remains to be investigated. One possibility is re-fating of certain cells that otherwise would adopt another fate. This is consistent with the fact that the extra amacrine cells showed weaker AP2α immunoreactivity. Another possibility is that these cells resulted from reduced cell death among amacrine cells. We think this scenario is unlikely, because more cell death in the amacrine layer was observed in retinas overexpressing ash1. Such a surge in apoptosis in the amacrine layer could be due to improper cell differentiation in those re-fated cells and/or enhanced competition among amacrines for synaptic targets in the retina.
In retinas overexpressing ash1, fewer Müller glia developed. This is consistent with the reported suppression by ash1 of gliogenesis (Bertrand et al., 2002). Photoreceptor deficiency was also observed in retinas overexpressing ash1, but only after retinal neurogenesis had essentially completed. The delayed deficiency could be due to a detrimental effect of ash1 on photoreceptor survival. Cai et al. (2000) have reported that misexpression of bHLH genes exerts a lethal effect on neurons. Alternatively, the photoreceptor deficiency might be secondary to altered neurogenesis, such as an abnormality of Müller glia. It has been shown that Müller glial cells play an important role in photoreceptor survival (Wahlin et al., 2000). Overexpression of ash1 also reduced the number of chx10 mRNA+ bipolar cells, an observation consistent with the lack of ash1 expression in the prospective zone of bipolar cells.
Results from deletion constructs suggest that the N-terminal 52 residues are required for the phenotypic alterations observed with ash1 overexpression. The C-terminal 33 residues, on the other hand, can be dispensed with. Notably, an addition of 19 residues from the cloning vector enhanced the effects of ash1. Although the biochemical reason for the enhancement is not known, it is plausible that the extra sequence at the C-terminus could render the overexpressed ash1ΔC protein more stable.
Our results showing ash1 promoting amacrine cell production at the expense of late born cells disagrees with studies describing ash1 as being required for late born retinal neurons in knockout mice (Tomita et al., 1996). The discrepancy could reflect that mouse and chick use ash1 differently during retinal neurogenesis. It could also reflect differences in experimental approaches. In retinas overexpressing ash1, premature cell cycle withdrawal may decrease the pool of progenitors that are competent to become late born cells, including bipolar cells and glia. In the knockout mouse retina, the absence of ash1 may affect cross-regulation among the regulatory factors, indirectly causing decreased bipolar cell population, or alternatively explant culture conditions are less permissive for the development of later born cells than for early born ones. Nonetheless, our results from in ovo gain-of-function experiments showing an increase in the amacrine population and reduction in progenitor, bipolar, and Müller glial populations provide experimental evidence that ash1 promotes amacrine genesis in the chick retina.
Acknowledgments
The authors thank Dr. Stephen Hughes for retroviral vector RCAS (B/P) and shuttle vector Cla12Nco, and Dr. Steven McLoon for RA4 monoclonal antibody.
Contract grant sponsors: NIH/NEI; contract grant numbers: R01 EY11640 and P30 EY03039.
Contract grant sponsor: EyeSight Foundation; contract grant number: FY2005-06-21
Contract grant sponsor: Research to Prevent Blindness.
Footnotes
Additional Supporting Information may be found in the online version of this article.
REFERENCES
- Adler R. A model of retinal cell differentiation in the chick embryo. Prog Retina Eye Res. 2000;19:529–557. doi: 10.1016/s1350-9462(00)00008-2. [DOI] [PubMed] [Google Scholar]
- Akagi T, Inoue T, Miyoshi G, Bessho Y, Takahashi M, Lee JE, Guillemot F, et al. Requirement of multiple basic helix-loop-helix genes for retinal neuronal subtype specification. J Biol Chem. 2004;279:28492–28498. doi: 10.1074/jbc.M400871200. [DOI] [PubMed] [Google Scholar]
- Alexiades MR, Cepko CL. Subsets of retinal progenitors display temporally regulated and distinct biases in the fates of their progeny. Development. 1997;124:1119–1131. doi: 10.1242/dev.124.6.1119. [DOI] [PubMed] [Google Scholar]
- Belecky-Adams T, Cook B, Adler R. Correlations between terminal mitosis and differentiated fate of retinal precursor cells in vivo and in vitro: Analysis with the “window-labeling” technique. Dev Biol. 1996;178:304–315. doi: 10.1006/dbio.1996.0220. [DOI] [PubMed] [Google Scholar]
- Belecky-Adams T, Tomarev S, Li H-S, Ploder L, McInnes RR, Sundin O, Adler R. Pax-6, Prox1, and Chx10 homeobox gene expression correlates with phenotyppic fate of retinal precursor cells. Invest Ophthalmol Vis Sci. 1997;38:1293–1303. [PubMed] [Google Scholar]
- Belliveau MJ, Young TL, Cepko CL. Late retinal progenitor cells show intrinsic limitations in the production of cell types and the kinetics of opsin synthesis. J Neurosci. 2000;20:2247–2254. doi: 10.1523/JNEUROSCI.20-06-02247.2000. [DOI] [PMC free article] [PubMed] [Google Scholar]
- Bertrand N, Castro DS, Guillemot F. Proneural genes and the specification of neural cell types. Nat Rev Neurosci. 2002;3:517–530. doi: 10.1038/nrn874. [DOI] [PubMed] [Google Scholar]
- Bisgrove DA, Godbout R. Differential expression of AP-2alpha and AP-2beta in the developing chick retina: Repression of R-FABP promoter activity by AP-2. Dev Dyn. 1999;214:195–206. doi: 10.1002/(SICI)1097-0177(199903)214:3<195::AID-AJA3>3.0.CO;2-8. [DOI] [PubMed] [Google Scholar]
- Braisted JE, Essman TF, Raymond PA. Selective regeneration of photoreceptors in goldfish retina. Development. 1994;120:2409–2419. doi: 10.1242/dev.120.9.2409. [DOI] [PubMed] [Google Scholar]
- Brown NL, Kanekar S, Vetter ML, Tucker PK, Gemza DL, Glaser T. Math5 encodes a murine basic helix-loop-helix transcription factor expressed during early stages of retinal neurogenesis. Development. 1998;125:4821–4833. doi: 10.1242/dev.125.23.4821. [DOI] [PubMed] [Google Scholar]
- Cai L, Morrow EM, Cepko CL. Misexpression of basic helix-loop-helix genes in the murine cerebral cortex affects cell fate choices and neuronal survival. Development. 2000;127:3021–3030. doi: 10.1242/dev.127.14.3021. [DOI] [PubMed] [Google Scholar]
- Cayouette M, Barres BA, Raff M. Importance of intrinsic mechanisms in cell fate decisions in the developing rat retina. Neuron. 2003;40:897–904. doi: 10.1016/s0896-6273(03)00756-6. [DOI] [PubMed] [Google Scholar]
- Cook B, Portera-Cailliau C, Adler R. Developmental neuronal death is not a universal phenomenon among cell types in the chick embryo retina. J Comp Neurol. 1998;396:12–19. doi: 10.1002/(sici)1096-9861(19980622)396:1<12::aid-cne2>3.0.co;2-l. [DOI] [PubMed] [Google Scholar]
- Ellis JH, Richards DE, Rogers JH. Calretinin and calbindin in the retina of the developing chick. Cell Tissue Res. 1991;264:197–208. doi: 10.1007/BF00313956. [DOI] [PubMed] [Google Scholar]
- Fekete DM, Cepko CL. Replication-competent retroviral vectors encoding alkaline phosphatase reveal spatial restriction of viral gene expression/transduction in the chick embryo. Mol Cell Biol. 1993;13:2604–2613. doi: 10.1128/mcb.13.4.2604. [DOI] [PMC free article] [PubMed] [Google Scholar]
- Fischer AJ, Stanke JJ, Aloisio G, Hoy H, Stell WK. Heterogeneity of horizontal cells in the chicken retina. J Comp Neurol. 2007;500:1154–1171. doi: 10.1002/cne.21236. [DOI] [PubMed] [Google Scholar]
- Hatakeyama J, Tomita K, Inoue T, Kageyama R. Roles of homeobox and bHLH genes in specification of a retinal cell type. Development. 2001;128:1313–1322. doi: 10.1242/dev.128.8.1313. [DOI] [PubMed] [Google Scholar]
- Herman J-P, Victor JC, Sanes JR. Developmentally regulated and spatially restricted antigens of radial glial cells. Dev Dyn. 1993;197:307–318. doi: 10.1002/aja.1001970408. [DOI] [PubMed] [Google Scholar]
- Huang S, Moody SA. Three types of serotonin-containing amacrine cells in tadpole retina have distinct clonal origins. J Comp Neurol. 1997;387:42–52. [PubMed] [Google Scholar]
- Hughes SH, Greenhouse JJ, Petropoulos CJ, Sutrave P. Adaptor plasmids simplify the insertion of foreign DNA into helper-independent retroviral vectors. J Virol. 1987;61:3004–3012. doi: 10.1128/jvi.61.10.3004-3012.1987. [DOI] [PMC free article] [PubMed] [Google Scholar]
- Jasoni CL, Walker MB, Morris MD, Reh TA. A chicken achaete-scute homolog (CASH-1) is expressed in a temporally and spatially discrete manner in the developing nervous system. Development. 1994;120:769–783. doi: 10.1242/dev.120.4.769. [DOI] [PubMed] [Google Scholar]
- Kim J, Wu HH, Lander AD, Lyons KM, Matzuk MM, Calof AL. GDF11 controls the timing of progenitor cell competence in developing retina. Science. 2005;308:1927–1930. doi: 10.1126/science.1110175. [DOI] [PubMed] [Google Scholar]
- Li C-M, Yan R-T, Wang S-Z. Misexpression of cNSCL1 disrupts retinal development. Mol Cell Neurosci. 1999;14:17–27. doi: 10.1006/mcne.1999.0765. [DOI] [PubMed] [Google Scholar]
- Li C-M, Yan R-T, Wang S-Z. Misexpression of chick NSCL2 causes atrophy of Müller glia and photoreceptor cells. Invest Ophthalmol Vis Sci. 2001;42:3103–3109. [PMC free article] [PubMed] [Google Scholar]
- Liu H, Etter P, Hayes S, Jones I, Nelson B, Hartman B, Forrest D, et al. NeuroD1 regulates expression of thyroid hormone receptor β2 and cone opsins in the developing mouse retina. J Neurosci. 2008;28:749–756. doi: 10.1523/JNEUROSCI.4832-07.2008. [DOI] [PMC free article] [PubMed] [Google Scholar]
- Liu W, Mo Z, Xiang M. The Ath5 proneural genes function upstream of Brn3 POU domain transcription factor genes to promote retinal ganglion cell development. Proc Natl Acad Sci USA. 2001;98:1649–1654. doi: 10.1073/pnas.98.4.1649. [DOI] [PMC free article] [PubMed] [Google Scholar]
- Liu W, Wang JH, Xiang M. Specific expression of the LIM/homeodomain protein Lim-1 in horizontal cells during retinogenesis. Dev Dyn. 2000;217:320–325. doi: 10.1002/(SICI)1097-0177(200003)217:3<320::AID-DVDY10>3.0.CO;2-F. [DOI] [PubMed] [Google Scholar]
- Livesey FJ, Cepko CL. Vertebrate neural cell-fate determination: Lessons from the retina. Nat Rev Neurosci. 2001;2:109–118. doi: 10.1038/35053522. [DOI] [PubMed] [Google Scholar]
- Ma W, Wang S-Z. The final fates of neurogenin2-expressing cells include all major neuron types in the mouse retina. Mol Cell Neurosci. 2006;31:463–469. doi: 10.1016/j.mcn.2005.10.018. [DOI] [PMC free article] [PubMed] [Google Scholar]
- Marquardt T, Ashery-Padan R, Andrejewski N, Scardigli R, Guillemot F, Gruss P. Pax6 is required for the multipotent state of retinal progenitor cells. Cell. 2001;105:43–55. doi: 10.1016/s0092-8674(01)00295-1. [DOI] [PubMed] [Google Scholar]
- Matter-Sadzinski L, Puzianowska-Kuznicka M, Hernandez J, Ballivet M, Matter JM. A bHLH transcriptional network regulating the specification of retinal ganglion cells. Development. 2005;132:3907–3921. doi: 10.1242/dev.01960. [DOI] [PubMed] [Google Scholar]
- Mu X, Fu X, Sun H, Beremand PD, Thomas TL, Klein WH. A gene network downstream of transcription factor Math5 regulates retinal progenitor cell competence and ganglion cell fate. Dev Biol. 2005;280:467–481. doi: 10.1016/j.ydbio.2005.01.028. [DOI] [PubMed] [Google Scholar]
- Otteson DC, Hitchcock PF. Stem cells in the teleost retina: Persistent neurogenesis and injury-induced regeneration. Vision Res. 2003;43:927–936. doi: 10.1016/s0042-6989(02)00400-5. [DOI] [PubMed] [Google Scholar]
- Rapaport DH, Dorsky RI. Inductive competence, its significance in retinal cell fate determination and a role for Delta-Notch signaling. Semin Cell Dev Biol. 1998;9:241–247. doi: 10.1006/scdb.1998.0232. [DOI] [PubMed] [Google Scholar]
- Rapaport DH, Wong LL, Wood ED, Yasumura D, LaVail MM. Timing and topography of cell genesis in the rat retina. J Comp Neurol. 2004;474:304–324. doi: 10.1002/cne.20134. [DOI] [PubMed] [Google Scholar]
- Reddy ST, Stoker AW, Bissell MJ. Expression of Rous sarcoma virus-derived retroviral vectors in the avian blastoderm: Potential as stable genetic markers. Proc Natl Acad Sci USA. 1991;88:10505–10509. doi: 10.1073/pnas.88.23.10505. [DOI] [PMC free article] [PubMed] [Google Scholar]
- Tomita K, Moriyoshi K, Nakanishi S, Guillemot F, Kageyama R. Mammalian achaete-scute and atonal homologs regulate neuronal versus glial fate determination in the central nervous system. EMBO J. 2000;19:5460–5472. doi: 10.1093/emboj/19.20.5460. [DOI] [PMC free article] [PubMed] [Google Scholar]
- Tomita K, Nakanishi S, Guillemot F, Kageyama R. Mash1 promotes neuronal differentiation in the retina. Genes Cells. 1996;1:765–774. doi: 10.1111/j.1365-2443.1996.tb00016.x. [DOI] [PubMed] [Google Scholar]
- Vetter ML, Brown NL. The role of basic helix-loop-helix genes in vertebrate retinogenesis. Semin Cell Dev Biol. 2001;12:491–498. doi: 10.1006/scdb.2001.0273. [DOI] [PubMed] [Google Scholar]
- Waid DK, McLoon SC. Ganglion cells influence the fate of dividing retinal cells in culture. Development. 1998;125:1059–1066. doi: 10.1242/dev.125.6.1059. [DOI] [PubMed] [Google Scholar]
- Wahlin KJ, Campochiaro PA, Zack DJ, Adler R. Eurotrophic factors cause activation of intracellular signaling pathways in Müller cells and other cells of the inner retina, but not photoreceptors. Invest Ophthalmol Vis Sci. 2000;41:927–936. [PubMed] [Google Scholar]
- Xiang M, Zhou L, Macke JP, Yoshioka T, Hendry SH, Eddy RL, Shows TB, et al. The Brn-3 family of POU-domain factors: Primary structure, binding specificity, and expression in subsets of retinal ganglion cells and somatosensory neurons. J Neurosci. 1995;15:4762–4785. doi: 10.1523/JNEUROSCI.15-07-04762.1995. [DOI] [PMC free article] [PubMed] [Google Scholar]
- Xie W, Yan R-T, Ma W, Wang S-Z. Enhanced retinal ganglion cell differentiation by ath5 and NSCL1 coexpression. Invest Ophthalmol Vis Sci. 2004;45:2922–2928. doi: 10.1167/iovs.04-0280. [DOI] [PMC free article] [PubMed] [Google Scholar]
- Yamagata K, Goto K, Kuo CH, Kondo H, Miki N. Visinin: A novel calcium binding protein expressed in retinal cone cells. Neuron. 1990;4:469–476. doi: 10.1016/0896-6273(90)90059-o. [DOI] [PubMed] [Google Scholar]
- Yan R-T, Ma W, Liang L, Wang S-Z. bHLH genes in retinal cell fate specification. Mol Neurobiol. 2005;32:157–171. doi: 10.1385/MN:32:2:157. [DOI] [PMC free article] [PubMed] [Google Scholar]
- Yan R-T, Ma W, Wang S-Z. Neurogenin2 elicits the genesis of retinal neurons from cultures of non-neural cells. Proc Natl Acad Sci USA. 2001;98:5014–15019. doi: 10.1073/pnas.261455698. [DOI] [PMC free article] [PubMed] [Google Scholar]
- Yan R-T, Wang S-Z. NeuroD induces photoreceptor cell overproduction in vivo and de novo generation in vitro. J Neurobiol. 1998;36:485–496. [PMC free article] [PubMed] [Google Scholar]
- Yan R-T, Wang S-Z. Embryonic abnormalities from misexpression of cNSCL1. Biochem Biophys Res Cummun. 2001;287:949–955. doi: 10.1006/bbrc.2001.5690. [DOI] [PubMed] [Google Scholar]
- Yang Z, Ding K, Pan L, Deng M, Gan L. Math5 determines the competence state of retinal ganglion cell progenitors. Dev Biol. 2003;264:240–254. doi: 10.1016/j.ydbio.2003.08.005. [DOI] [PubMed] [Google Scholar]


