

Abstract
Partial agonists are ligands which bind to receptors but produce only a small maximum response even at concentrations where all receptors are occupied. In the case of ligand-activated ion channels, it has been supposed ever since 1957 that partial agonists evoke a small response because they are inefficient at eliciting the change of conformation between shut and open states of the channel. We have investigated partial agonists for two members of the nicotinic superfamily, the muscle nicotinic acetylcholine receptor and the glycine receptor and find that the open-shut reaction is similar for both full and partial agonists, but the response to partial agonists is limited by an earlier conformation change (‘flipping’) that takes place while the channel is still shut. This has implications for the interpretation of structural studies, and in the future, for the design of partial agonists for therapeutic use.
Agonists are small molecules that bind to a receptor and activate it. The best understood receptors are ligand-gated ion channels. When neurotransmitters bind to their extracellular domain, the resulting change of conformation opens an ion channel, which carries current through the cell membrane, allowing electrical signals to propagate. The natural neurotransmitters, acetylcholine and glycine, are very efficacious agonists: when they are bound, the channel is open for 95-98% of the time1,2. In the 1950s, agonists were discovered that could not produce such a large response even when they saturated the binding sites. These were called partial agonists. Here we find that taurine can hold the glycine receptor channel open for at most about 54% of the time. del Castillo and Katz3 were the first to propose for an ion channel that when the receptor is occupied by a partial agonist, the ‘gating’ equilibrium between open and shut conformations lies towards the shut side. This is equivalent to saying that agonists work because they have a higher affinity for the open state than the shut state4,5 so their binding shifts the equilibrium towards the open state. The more efficacious the agonist, the greater is its selectivity for the open state. These views of partial agonism have persisted, essentially unchanged, for 50 years. However, recent findings suggest another possibility. Φ-value analysis indicates that, after binding, nicotinic receptors move through a number of brief intermediate shut states, a ‘conformational wave’, before the channel opens6-10. Our own work on glycine receptors suggested that it is possible to detect and measure the properties of an intermediate conformation, which we refer to as ‘flip’2. The flipped receptor has a higher affinity for the agonist than the resting receptor, so it is a sort of activated, pre-open state. Higher affinity could result from domain closure around the bound agonist, a phenomenon that is clear in structures of extracellular domains of glutamate channels11,12, but less obvious in the nicotinic superfamily13,14, where binding sites are at the interface between subunits.
Here we investigate two partial agonists, taurine for glycine receptors, and tetramethylammonium (TMA) for nicotinic receptors. When our single-channel measurements are interpreted in terms of the flip mechanism, it is found that the open-shut reaction is remarkably similar for full and partial agonists. In both receptors, partial agonism originates from a reduced ability to flip, rather than a reduced ability to open. From the viewpoint of selective affinity, it is a low affinity for the flipped state, relative to the resting state, that makes an agonist partial, rather than low affinity for the open state, relative to the resting state, as previously supposed. This interpretation places the root of partial agonism early in the chain of events that follow binding. It provides an experimental verification for Φ-value analysis 6,9,10 as well as a functional counterpart for future structural measurements and it may be exploitable in rational drug design.
Results with the glycine receptor
Figure 1a shows raw single-channel data for three concentrations of a full agonist, glycine, and a partial agonist, taurine, on heteromeric α1β glycine receptors. At the highest concentrations it is obvious that the channel is open for more of the time with glycine than with taurine.
Figure 1.

Glycine channels show short interruptions when activated by either full or partial agonists.
a, Single-channel currents (opening upwards) produced by a full agonist (Glycine) or a partial agonist (Taurine). Open probability increases with agonist concentration (b) reaching a maximum of 0.54 for taurine and 0.96 for glycine (17 - 60 clusters, 3 - 4 patches per point; Hill equation fits; glycine data from ref. 2). c, Short shut times are clearly detectable in channel activations by 1 mM taurine. Points are the digitised record and the continuous line is the best time-course fit obtained during idealization together with the estimated duration of the short gaps. d, Short shut times are the predominant component in shut-time distributions for both agonists. With the usual resolution of 30 μs, a large proportion of such short shuttings are missed, but quite enough are observed to obtain a good estimate of their duration. Dwell-time distributions were fitted here and in Fig. 4d with a mixture of exponentials using ekdist, so they are descriptive and not mechanism dependent.
At 1-100 mM taurine, openings occurred in long clusters separated by long shut periods, presumably sojourns in long-lived desensitized states. Below 1 mM, openings were sparse and occurred in short bursts of openings separated by short shuttings (Fig. 1c).
The probability of being open, Popen (the fraction of time for which the channel is open, i.e. the ratio between total open time per cluster and cluster length), reached a maximum of about 96% for glycine but only 54% for taurine (Fig. 1b). Unlike nicotinic channels, there was no sign of channel block by the agonist itself.
Plotting the distributions of apparent shut times (‘apparent’ means what is observed, as distorted by our inability to detect short events, Figure 1d) shows that for both the partial agonist, taurine and the full agonist, glycine, the mean lifetime of the brief shuttings is very similar, being between 10 and 14 μs, irrespective of concentration2.
In order to investigate what mechanisms might underlie our observations, we fitted putative mechanisms to the data with our hjcfit method. This method maximises the likelihood of the entire sequence of openings and shuttings, with exact allowance for missed events. Simulation studies2,15 showed that this method is capable of estimating up to 18 rate constants with values as fast as 130,000 s−1.
In order to estimate all the rate constants it is necessary to fit simultaneously a set of recordings at different agonist concentrations. First the mechanism to be tested must be postulated. We shall concentrate here on the ‘flip’ mechanism (Fig. 2a) because it provides a realistic description of the wild-type glycine receptor2 (see Discussion). It was not possible to use taurine concentrations lower than 1 mM, for technical reasons described in Supplementary Information. Thus it is not surprising that initial fits suggested that there were few monoliganded openings in our records. Therefore monoliganded flipped and open states were not included in the mechanism in the final fits (Fig. 2a, grey regions).
Figure 2.

Global fit of the taurine data with a ‘flip’ mechanism provides a good description of the observations.
a, The ‘flip’ activation mechanism fitted by Burzomato et al. (2004)2 to α1β channel activations by glycine. The success of the fit to the idealised records is judged by its ability to describe the experimental observations displayed in various ways15, as in b and c. The results of the fit predict accurately the channel open probability (b) and apparent open- and shut-time distributions at all concentrations as shown by the continuous lines (fit predictions) superimposed onto the data points and the histograms. The dashed lines in the histograms are the distributions predicted if the records were obtained with perfect resolution (i.e. no events were missed; full data display Supplementary Figure 1 and Supplementary Table 1).
Figure 2 shows the results of a fit to a set of three records with 3, 10 and 100 mM taurine. It shows that the flip mechanism can, with a single set of rate constants, predict well the observed open and shut times at all three concentrations and the observed Popen curve (continuous lines in Fig. 2c and b).
The average rate constants from nine recordings fitted as three independent sets (Table 1 and Supplementary Table 1) show that the opening rate for the fully liganded channel (β3) is almost the same for the partial agonist, taurine, as it is for glycine. The shutting rate (α3) is not greatly different from glycine either (14,500 s−1, compared with 7,000 s−1), so the open-shut equilibrium constants (E3 = β3/α3) for taurine and glycine are similar (compare with a 180-fold difference in flipping equilibrium constants, Table 1). It has been assumed since 19573 that partial agonism is a characteristic of the open-shut reaction but that is clearly not the case here. The major difference between taurine and glycine lies at an earlier stage, in the flipping reaction.
Table 1.
Summary of results with full and partial agonists. For estimates of all rate constants, and their errors, and more complete tests of fit, see Supplementary information.
| Glycine | Taurine | ACh (−100 mV) | ACh (+80 mV) | TMA (−80 mV) | TMA (+80 mV) | ||
|---|---|---|---|---|---|---|---|
| E 3 | 20 | 9.2 | E 2 | 34.4 | 3.1 | 28.1 | 2.8 |
| F 3 | 27 | 0.15 | F 2 | 3.8 | 1.1 | 0.14 | 0.060 |
| K (μM) | 520 | 1040 | K (μM) | 40.1 | 43 | 3000 | 2310 |
| KF (μM) | 8 | 690 | KF (μM) | 20.7 | 0.13 | 340 | 1240 |
| α3 (s-1) | 7000 | 14500 | α2 (s-1) | 2560 | 9550 | 2520 | 9100 |
| β3 (s-1) | 129000 | 133000 | β2 (s-1) | 87700 | 29400 | 70500 | 25000 |
For glycine the equilibrium constant for flipping (F3) is large (27) so most fully-liganded receptors will adopt the pre-open flipped conformation. But for taurine this equilibrium constant is only 0.15, so 87% of fully-liganded shut receptors will be in the resting conformation, not in the flipped, pre-open conformation. This is summarised in Figure 3. A schematic representation of the three states (resting, flipped and open) visited by the fully-liganded receptor is shown in Figure 3a. The rates of transition between states are indicated by the size of the arrows (Fig. 3b), for glycine and taurine. The open-shut transition is similar for both agonists. Another way to look at that is through the energy diagram in Figure 3c, in which the paths for the open-shut transition almost superimpose. The energy diagram shows also that the transition from resting to flipped state is downhill for glycine but uphill for taurine. The overall energy change, from resting to open state, is downhill for glycine, but nearly level for taurine, as expected since the channel is open for about half the time in saturating taurine. In the case of taurine, the transition from resting to flipped is slow, so the mean lifetime of the saturated resting state is much longer than for glycine (Fig. 3b, and animation in Supplementary information) and this is why taurine is a partial agonist.
Figure 3.
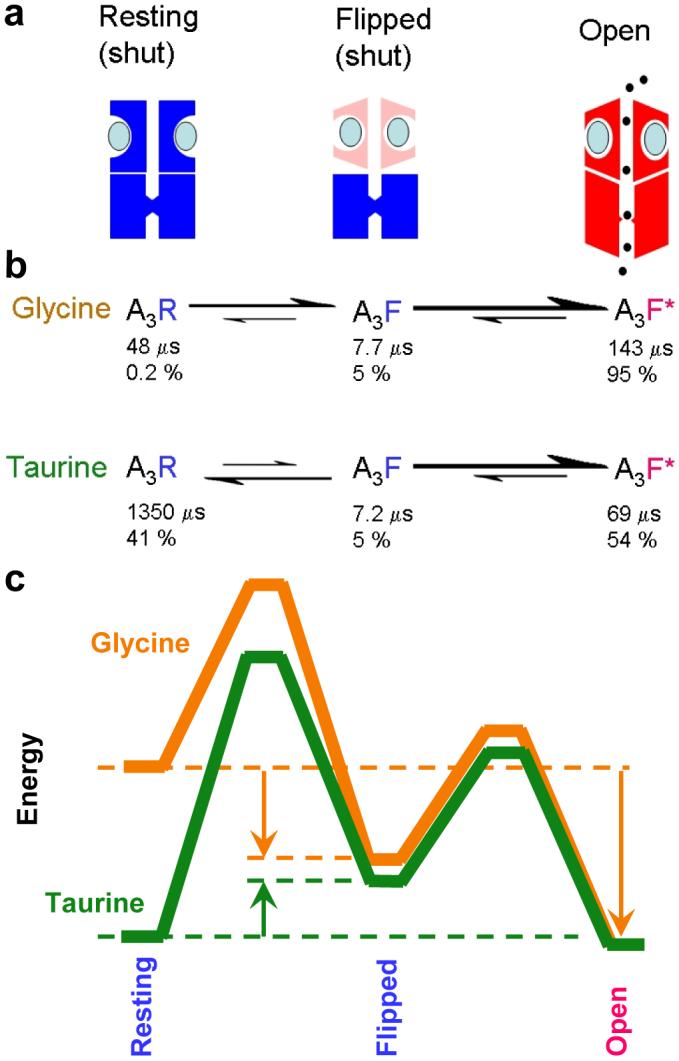
Activation of the glycine channel by the full agonist glycine and the partial agonist taurine.
a, The three states of the fully-saturated receptor. The resting (shut) channel changes conformation to reach a partially-activated state (‘flipped’), still shut, but with increased affinity for the agonist (blue ellipses). It is from this flipped state that the channel can open (red, right). b, The reaction rates for channel activation by glycine and taurine differ largely in the first step, the flipping. Relative rates are indicated by the size of arrows. The diagram shows also the mean lifetime of each state (μs) and the proportion of time (percent) spent by a bound channel in each of the states at equilibrium. A channel occupied by glycine doesn’t stay long in the resting state, but quickly flips. When taurine is bound, the channel takes a long time to flip, so it spends much more time in the closed resting state. Once the channel has reached the flipped intermediate state, it opens quickly, regardless of which agonist is bound. The probability of opening, rather than unflipping, is over 96% for both agonists, so a burst of many openings results. c, An energy diagram for the three states of the saturated receptor, for full agonist (glycine, orange) and partial agonist (taurine, green). Again, the difference lies largely in the resting-flipped transition. As indicated by arrows, the transition from resting to flipped is downhill for glycine, but uphill for taurine. The overall transition from resting to open is very downhill for glycine, but almost level for taurine, as expected from the maximum response of about 54% open. The calculations used a frequency factor27 of 107 s−1 and the lines are shifted vertically so they meet at the open state., See also Supplementary movie.
Another way to look at this result is that the effectiveness of an agonist depends largely on its relative affinity for resting and flipped conformations, rather than, as previously supposed, its relative affinity for resting and open conformations. Glycine binds with 65-times greater affinity to the flipped conformation than to the resting state, but taurine binds only slightly (about 1.5-fold) more tightly. Most of this difference arises from the lower affinity of taurine for the flipped state.
Results with the nicotinic receptor
Figure 4a depicts cell-attached muscle nicotinic receptor activations elicited by the full agonist, acetylcholine (ACh; −100 mV transmembrane potential) and by the partial agonist TMA (−80 and +80 mV).
Figure 4.

Short interruptions in openings of muscle nicotinic channels occur with both partial and full agonists and cannot be attributed entirely to channel block.
a, Single channel currents produced by a full agonist (ACh) and a partial agonist (TMA, openings downwards in the first six rows). b, Short shut times are a major feature of shut-time distributions irrespective of agonist, voltage and concentration (see Supplementary Fig 2 and 4). Some of these brief shuttings could result from fast open-channel block at negative potentials, but not at positive potential, when open channel block is essentially absent. c, Open probability reaches a maximum of 0.94 (± 0.004) for ACh at −100 mV but is lower (0.59± 0.01) for ACh at +80 mV and for TMA at −80 or + 80 mV, 0.78 ± 0.05 or 0.16 ± 0.02, respectively (2 - 4 patches per point; Hill equation fits). These fits give also, for ACh −100 mV: EC50= 5.3± 0.2 μM; nH= 1.7± 0.1; for ACh +80 mV: EC50= 29± 2 μM; nH= 1.7 ± 0.1; for TMA −80 mV: EC50= 2.2 ± 0.5 mM; nH= 1.3 ± 0.4, and for TMA +80 mV: EC50= 6.4 ± 1.9 mM; nH= 1.2 ± 0.4. d, Because of open-channel block, the amplitude of single-channel currents declines with increasing TMA concentrations at negative potentials (open circles), but not at positive transmembrane potentials (filled circles, 2-3 patches per point).
At negative membrane potentials, an ACh-activated channel is practically always open at saturating agonist concentrations (94% of the time), whereas a TMA-bound channel can open for only 78% of the time (Fig 4c).
TMA recordings showed many brief shuttings, which resemble closely those seen with the full agonist, ACh (mean duration about 13 μs at negative potentials1) (Fig. 4b). The time constant of the fastest component did not vary noticeably with TMA concentration, but was somewhat briefer at negative (12.8 ± 0.46 μs, 13 patches) than at positive (27.9 ± 1.9 μs; 7 patches) membrane potentials. Brief shuttings cannot be attributed entirely to channel block because they were frequent at positive as well as at negative membrane potentials.
Figure 4d shows an important difference between nicotinic and glycine receptors. At negative potentials the amplitude of the openings appears to decrease progressively with agonist concentration. This is because in nicotinic receptors the agonist can bind to a second, lower affinity site in the channel pore and produce fast block. Both openings and blockages are very brief and failure to resolve them results in the apparent decrease in channel amplitude (equilibrium constant for TMA block, KB, 8.9 ± 0.6 mM). At +80 mV there is little or no block, as expected16-18: channel amplitude is not affected by TMA concentrations as high as 100 mM, the highest on our Popen curve. At +80 mV both agonists are less efficacious than at negative potentials: a fully TMA-bound channel opens only for 16% of the time compared with 59% for ACh (Fig. 4a, and 4c; Supplementary Fig. 3).
The original motive for the flip mechanism was to describe in a physically plausible way the apparent strong interaction between binding sites in glycine receptors when conventional mechanisms were fitted2. That sort of apparent interaction is much less pronounced for the nicotinic receptor. Nevertheless the flip mechanism fitted nicotinic data well, and it has the virtue of obviating the need to add arbitrary shut states in order to get a good fit1,19.
Figure 5 shows part of the results of fitting TMA records with the mechanism in Figure 5a (see also Supplementary Fig. 4 and 5 and Table 1). At −80 mV the largest TMA concentration used for fits was 30 mM because channel block became too pronounced at higher concentrations (Fig. 4d). Again the distributions of apparent dwell times and the Popen curve are predicted well by the results of the fit (Fig 5b and c).
Figure 5.

The ‘flip’ mechanism describes well the activation of acetylcholine receptors by TMA.
a, Schematic representation of the ‘flip’ mechanism used here: this has two agonist binding sites. As in Figure 2, the experimental data are displayed as channel open probability values (b) or dwell-time distributions (c, d). The results of fitting the idealised records are used to calculate the predicted Popen - concentration curves and distributions (continuous lines). Both the open probability values and the dwell time distributions are well described by the fitted rate constants for TMA, at both −80 mV (c) and +80 mV (d). The dashed lines in the histograms are the distributions predicted if the records were obtained with perfect resolution (i.e. no events were missed). The full data display for the fits for ACh and TMA is in Supplementary Figures 2, 4, 5 and Supplementary Table 2).
The fully-liganded opening rate (β2) at −80 mV is about 71,000 s−1, very similar to the value for ACh, 88,000 s−1. The shutting rates also are almost identical, α2 = 2,560 s−1 for ACh and 2,520 s−1 for TMA. Consequently, the fully-liganded gating constant, E2, is similar for ACh and TMA. Again, what differs between full and partial agonist is the flipping step. For ACh the flipping equilibrium constant, F2 is 3.8 but for TMA it is only 0.14, so TMA has a far smaller ability to elicit the pre-open flipped state than ACh, and that is why it is a partial agonist.
It is important to rule out the possibility that these results could be influenced by channel block because at the highest TMA concentration fitted (10 mM), channels are blocked for about half the time at −80 mV. The experiments were therefore repeated at positive membrane potential, +80 mV, where block is essentially absent (Fig. 4d). Short shuttings are still present at positive membrane potentials, so they cannot all be caused by brief channel blockages. The open-shut equilibrium constant is reduced about ten-fold at +80 mV (Table 1), so ACh itself becomes a partial agonist18 (Fig. 4c and Supplementary Fig. 3). The maximum Popen for ACh is reduced from 94% at −100 mV to about 60% at +80 mV and the maximum Popen for TMA is reduced from 78% to 16%. So TMA is still much less efficacious than ACh when the complication of block is removed, and for exactly the same reason. The open-shut equilibrium constant for TMA at +80 mV (E2 = 2.8) is almost the same as that for ACh (E2 = 3.1), but again the flipping equilibrium constant for TMA, F2, is very small, only 0.06, almost 20-fold less than for ACh, so this remains the reason why TMA is a partial agonist.
Discussion
Our analysis of single-channel data suggests that in the nicotinic superfamily partial agonism is not, as has been supposed for 50 years, a property of the open-shut transition, but arises in the earlier conformation change from the resting state to an intermediate pre-open (or ‘activated’) conformation dubbed the flip state. The same conclusion was reached for two members of this superfamily, the nicotinic acetylcholine receptor and the heteromeric glycine receptor. Figure 3 represents schematically the states visited by the agonist-bound channel during activation and summarises our quantitative findings for the glycine receptor.
The conclusion that the final step in activation, channel opening, is much the same for full and partial agonists comes from the observation that both partial and full agonists produce similar brief shuttings (7 - 8 μs on average for both glycine and taurine). It has been supposed since 198120,21 that these brief closures are mostly oscillations between the open state and the immediately preceding fully-liganded shut state (here the flipped intermediate), and therefore reflect the properties of the open-shut reaction. The similarity in the open-shut transition for the two agonists is obvious from the fact that the energy profile for this step is almost identical for glycine and taurine (Fig. 3c).
It has been known for a long time22 that the conductance of single channels is the same whichever agonist activates them. It is intriguing that it we now find that not only the conductance, but also the opening and shutting rate of channels do not vary greatly between full and partial agonists in the nicotinic superfamily.
The maximum Popen response that can be obtained has always been assumed to depend only on the equilibrium constant for the open-shut step (E), being E/(1+ E)23. In the context of the flip mechanism, the maximum response depends not only on E but also on the equilibrium constant for flipping, F. The maximum Popen becomes Eeff/(1+ Eeff), where Eeff = EF/(1+F). Here this effective gating constant, Eeff is about 19 for glycine but only 1.2 for taurine, largely because F is lower for the partial agonist. For taurine, the early conformational step is uphill energetically (green arrow in Fig. 3c), and it is much slower than it is for glycine (illustrated by the size of the arrows in Fig. 3b; Supplementary Table 1). The equilibrium between resting and flipped favours the resting state, in which taurine-bound channels spend much more time (on average 1,350 μs) than glycine-bound channels (48 μs).
Our interpretation places the origin of partial agonism at an earlier stage in the activation process than before. This is entirely consistent with the conclusion of Grosman et al. (2000)6, whose analysis of linear free-energy relationships implied that the differences between nicotinic agonists lie early in the activation process, quite close to the transmitter binding site. Indeed calculation of the Φ value for the overall resting-to-open transition gives a value close to 1, as they found (Supplementary information). Our result also explains the observation that the conformation change close to the membrane, in the M2-M3 region, appears to be similar for both glycine and taurine, as judged by the reaction rate with a cysteine-reactive compound24.
We may speculate that flipping corresponds to the domain closure around the bound agonist seen in the extracellular domain of glutamate channels and, to a lesser extent, in the ACh binding protein11-14. This structural work cannot be compared directly with our results because it all comes from non-functional receptors, does not tell us how fast domain closure is, how it changes agonist affinity in the intact channel or how it relates to channel opening.
Our single-channel work allowed us to obtain for the first time a functional characterisation of a partially-activated intermediate state, to measure exit and entry rates into this state and its average lifetime with different agonists in two nicotinic superfamily channels. This finding will constrain and inform computational simulations of the dynamics of channel activation and influence the interpretation of structural studies. In addition to that, our findings may also help reinterpret earlier mutation studies, as the greater detail of our model now shows that what was called ‘affinity for the resting state’ may reflect also the higher affinity for a partially-activated intermediate. This could perhaps account for the awkward observation that some mutations that are nowhere near the binding site nevertheless appear to affect largely the agonist binding to the resting state25. Another implication testable by structural data is that partial and full agonists should differ in their interaction with the portion of the binding site that moves during domain closure.
Methods Summary
Cell-attached single-channel currents were recorded from HEK293 expressing26 human adult muscle nicotinic receptors or rat α1β glycine receptor.
Rate constant values were estimated by direct model fitting to sets of records idealised by time-course fitting (hjcfit and scan program, respectively; http://www.ucl.ac.uk/Pharmacology/dc.html).
Supplementary Material
Acknowledgments
This work was supported by grants from the MRC (Programme grant G0400869) and the Wellcome Trust (Project Grant 074491) to LGS and DC.
We are very grateful to Fe Abogadie for molecular biology, and to Dr David Jane (Department of Pharmacology, University of Bristol) for purification of taurine.
APPENDIX
Methods
Single-channel electrophysiology
Cell-attached single-channel currents were recorded at 19-21°C from HEK293 transiently-transfected by a Ca2+-phosphate co-precipitation method26 with pcDNA3.1 plasmids coding for human muscle ACh nicotinic receptor subunits (α1, β, δ, ε, ratio 2:1:1:1) or rat heteromeric glycine receptor subunits (α1, β, ratio 1:1 or 1:4), together with plasmid coding for eGFP. The pipette solution was freshly prepared by diluting agonist stocks with extracellular solution which contained (mM): 5.4 NaCl, 142 KCl, 1.8 CaCl2, 1.7 MgCl2 and 10 HEPES (pH adjusted to 7.4 with KOH) for acetylcholine receptor experiments or, for glycine receptor experiments, 102.7 NaCl, 20 Na gluconate, 4.7 KCl, 2 CaCl2, 1.2 MgCl2, 10 HEPES, 14 glucose, 15 sucrose, 20 TEA-Cl (pH adjusted to 7.4 with NaOH). Osmolarity was 320 mOsm for all solutions.
Taurine (Fluka) was found by an HPLC assay to be contaminated by glycine (3 parts in 100000, molar ratios). It was, therefore, purified before use (by Dr David Jane, Pharmacology Dept, University of Bristol). Taurine was passed through an ion exchange resin column, followed by crystallisation from the water eluate. This purification was found to be essential to avoid glycine-induced openings in recordings made at high taurine concentrations.
Patch pipettes were made from thick-walled borosilicate glass (GC150F, Harvard Instruments) and coated near the tip with Sylgard 184® (Dow Corning). Electrode resistance was in the range 8-15 MΩ after fire-polishing. Single-channel currents were recorded with an Axopatch 200B amplifier (Axon Instruments, California, USA), filtered at 10 kHz (sampling rate 100 kHz) and stored on the PC hard drive.
Pipette potential was held at +100 mV for the glycine experiments and at +100, −80 or +80 mV for the nicotinic experiments.
Analysis
For off-line analysis, data were filtered at 3 - 8 kHz and sampled at 33 - 100 kHz. Records were idealized by time-course fitting (scan program; http://www.ucl.ac.uk/Pharmacology/dc.html), and the appropriate resolution (20 - 100 μs) was imposed prior to fitting dwell-time distributions with mixtures of exponential probability densities (ekdist program). Rate constant values were estimated by direct model fitting to the idealised records (hjcfit program). This was performed on sets of experiments, each set containing three (four for ACh) agonist concentrations spanning the dose-response curve from the minimum concentration that elicited clusters of openings (that could be attributed to a single molecule) to the maximum Popen. Each experiment contained 10,000-20,000 transitions. Fits were repeated, systematically changing initial guesses to ensure that the convergence was to a global maximum of the likelihood surface.
References
- 1.Hatton CJ, Shelley C, Brydson M, Beeson D, Colquhoun D. Properties of the human muscle nicotinic receptor, and of the slow-channel myasthenic syndrome mutant εL221F, inferred from maximum likelihood fits. J Physiol. (Lond. ) 2003;547:729–760. doi: 10.1113/jphysiol.2002.034173. [DOI] [PMC free article] [PubMed] [Google Scholar]
- 2.Burzomato V, Beato M, Groot-Kormelink PJ, Colquhoun D, Sivilotti LG. Single-channel behavior of heteromeric α1β glycine receptors: An attempt to detect a conformational change before the channel opens. J. Neurosci. 2004;24:10924–10940. doi: 10.1523/JNEUROSCI.3424-04.2004. [DOI] [PMC free article] [PubMed] [Google Scholar]
- 3.del Castillo J, Katz B. Interaction at end-plate receptors between different choline derivatives. Proc. R. Soc. Lond. B. 1957;146:369–381. doi: 10.1098/rspb.1957.0018. [DOI] [PubMed] [Google Scholar]
- 4.Wyman J, Allen DW. The problem of the heme Interactions in hemoglobin and the basis of the Bohr effect. J. Polym. Sci. 1951;VII:499–518. [Google Scholar]
- 5.Monod J, Wyman J, Changeux J-P. On the nature of allosteric transitions: a plausible model. J. Mol. Biol. 1965;12:88–118. doi: 10.1016/s0022-2836(65)80285-6. [DOI] [PubMed] [Google Scholar]
- 6.Grosman C, Zhou M, Auerbach A. Mapping the conformational wave of acetylcholine receptor channel gating. Nature. 2000;403:773–776. doi: 10.1038/35001586. [DOI] [PubMed] [Google Scholar]
- 7.Chakrapani S, Bailey TD, Auerbach A. Gating dynamics of the acetylcholine receptor extracellular domain. J. Gen. Physiol. 2004;123:341–356. doi: 10.1085/jgp.200309004. [DOI] [PMC free article] [PubMed] [Google Scholar]
- 8.Zhou Y, Pearson JE, Auerbach A. ϕ-value analysis of a linear, sequential reaction mechanism: theory and application to ion channel gating. Biophys. J. 2005;89:3680–3685. doi: 10.1529/biophysj.105.067215. [DOI] [PMC free article] [PubMed] [Google Scholar]
- 9.Auerbach A. Gating of acetylcholine receptor channels: brownian motion across a broad transition state. Proc. Natl. Acad. Sci. U. S. A. 2005;102:1408–1412. doi: 10.1073/pnas.0406787102. [DOI] [PMC free article] [PubMed] [Google Scholar]
- 10.Purohit P, Mitra A, Auerbach A. A stepwise mechanism for acetylcholine receptor channel gating. Nature. 2007;446:930–933. doi: 10.1038/nature05721. [DOI] [PubMed] [Google Scholar]
- 11.Armstrong N, Sun Y, Chen GQ, Gouaux E. Structure of a glutamate-receptor ligand-binding core in complex with kainate. Nature. 1998;395:913–917. doi: 10.1038/27692. [DOI] [PubMed] [Google Scholar]
- 12.Jin R, Banke TG, Mayer ML, Traynelis SF, Gouaux E. Structural basis for partial agonist action at ionotropic glutamate receptors. Nat. Neurosci. 2003;6:803–810. doi: 10.1038/nn1091. [DOI] [PubMed] [Google Scholar]
- 13.Celie PH, et al. Nicotine and carbamylcholine binding to nicotinic acetylcholine receptors as studied in AChBP crystal structures. Neuron. 2004;41:907–914. doi: 10.1016/s0896-6273(04)00115-1. [DOI] [PubMed] [Google Scholar]
- 14.Hansen SB, et al. Structures of Aplysia AChBP complexes with nicotinic agonists and antagonists reveal distinctive binding interfaces and conformations. EMBO J. 2005;24:3635–3646. doi: 10.1038/sj.emboj.7600828. [DOI] [PMC free article] [PubMed] [Google Scholar]
- 15.Colquhoun D, Hatton CJ, Hawkes AG. The quality of maximum likelihood estimates of ion channel rate constants. J Physiol. (Lond. ) 2003;547:699–728. doi: 10.1113/jphysiol.2002.034165. [DOI] [PMC free article] [PubMed] [Google Scholar]
- 16.Adams PR. Voltage jump analysis of procaine action at frog end-plate. J. Physiol. (Lond.) 1977;268:291–318. doi: 10.1113/jphysiol.1977.sp011858. [DOI] [PMC free article] [PubMed] [Google Scholar]
- 17.Neher E, Steinbach JH. Local anaesthetics transiently block currents through single acetylcholine-receptor channels. J. Physiol. (Lond. ) 1978;277:153–176. doi: 10.1113/jphysiol.1978.sp012267. [DOI] [PMC free article] [PubMed] [Google Scholar]
- 18.Colquhoun D, Ogden DC. Activation of ion channels in the frog end-plate by high concentrations of acetylcholine. J. Physiol. (Lond) 1988;395:131–159. doi: 10.1113/jphysiol.1988.sp016912. [DOI] [PMC free article] [PubMed] [Google Scholar]
- 19.Salamone FN, Zhou M, Auerbach A. A re-examination of adult mouse nicotinic acetylcholine receptor channel activation kinetics. J. Physiol. (Lond) 1999;516:315–330. doi: 10.1111/j.1469-7793.1999.0315v.x. [DOI] [PMC free article] [PubMed] [Google Scholar]
- 20.Colquhoun D, Sakmann B. Fluctuations in the microsecond time range of the current through single acetylcholine receptor ion channels. Nature. 1981;294:464–466. doi: 10.1038/294464a0. [DOI] [PubMed] [Google Scholar]
- 21.Colquhoun D, Sakmann B. Fast events in single-channel currents activated by acetylcholine and its analogues at the frog muscle end-plate. J. Physiol. (Lond) 1985;369:501–557. doi: 10.1113/jphysiol.1985.sp015912. [DOI] [PMC free article] [PubMed] [Google Scholar]
- 22.Gardner P, Ogden DC, Colquhoun D. Conductances of single ion channels opened by nicotinic agonists are indistinguishable. Nature. 1984;309:160–162. doi: 10.1038/309160a0. [DOI] [PubMed] [Google Scholar]
- 23.Colquhoun D. Binding, gating, affinity and efficacy. The interpretation of structure-activity relationships for agonists and of the effects of mutating receptors. Br. J. Pharmacol. 1998;125:923–948. doi: 10.1038/sj.bjp.0702164. [DOI] [PMC free article] [PubMed] [Google Scholar]
- 24.Han NL, Clements JD, Lynch JW. Comparison of taurine- and glycine-induced conformational changes in the M2-M3 domain of the glycine receptor. J. Biol. Chem. 2004;279:19559–19565. doi: 10.1074/jbc.M400548200. [DOI] [PubMed] [Google Scholar]
- 25.Colquhoun D, Unwin N, Shelley C, Hatton C, Sivilotti LG. In: Drug Discovery and Drug Development. Abrahams D, editor. John Wiley; New York: 2003. pp. 357–405. [Google Scholar]
- 26.Groot-Kormelink PJ, Beato M, Finotti C, Harvey RJ, Sivilotti LG. Achieving optimal expression for single channel recording: a plasmid ratio approach to the expression of α1 glycine receptors in HEK293 cells. J. Neurosci. Meth. 2002;113:207–214. doi: 10.1016/s0165-0270(01)00500-3. [DOI] [PubMed] [Google Scholar]
- 27.Andersen OS. Graphic representation of the results of kinetic analyses. J. Gen. Physiol. 1999;114:589–590. doi: 10.1085/jgp.114.4.589. [DOI] [PMC free article] [PubMed] [Google Scholar]
Associated Data
This section collects any data citations, data availability statements, or supplementary materials included in this article.