

Abstract
Off-resonance imaging (ORI) techniques are being increasingly used to image iron oxide imaging agents such as monocrystalline iron oxide nanoparticles (MION). However, the diagnostic accuracy, linearity, and field dependence of ORI have not been fully characterized. In this study, the sensitivity, specificity, and linearity of ORI were thus examined as a function of both MION concentration and magnetic field strength (4.7 and 14 T). MION phantoms with and without an air interface as well as MION uptake in a mouse model of healing myocardial infarction were imaged. MION-induced resonance shifts were shown to increase linearly with MION concentration. In contrast, the ORI signal/sensitivity was highly non-linear, initially increasing with MION concentration until T2 became comparable to the TE and decreasing thereafter. The specificity of ORI to distinguish MION-induced resonance shifts from on-resonance water was found to decrease with increasing field because of the increased on-resonance water linewidths (15 Hz at 4.7 T versus 45 Hz at 14 T). Large resonance shifts (∼300 Hz) were observed at air interfaces at 4.7 T, both in vitro and in vivo, and led to poor ORI specificity for MION concentrations less than 150 μg Fe/mL. The in vivo ORI sensitivity was sufficient to detect the accumulation of MION in macrophages infiltrating healing myocardial infarcts, but the specificity was limited by non-specific areas of positive contrast at the air/tissue interfaces of the thoracic wall and the descending aorta. Improved specificity and linearity can, however, be expected at lower fields where decreased on-resonance water linewidths, reduced air-induced resonance shifts, and longer T2 relaxation times are observed. The optimal performance of ORI will thus likely be seen at low fields, with moderate MION concentrations and with sequences containing very short TEs.
Keywords: off-resonance imaging, monocrystalline iron oxide nanoparticle, diagnostic accuracy, magnetic field strength, myocardial infarction
Introduction
The development of superparamagnetic nanoparticles, such as monocrystalline iron oxide (MION), has been central to the development of magnetic resonance molecular imaging (1–3). Magnetic nanoparticles have been used to label stem cells for tracking (4,5), to image tissue macrophage infiltration (6,7), and to detect specific and sparsely expressed molecular targets (8,9) and transgenes (10,11). The strong magnetic dipole field generated by these susceptibility agents shifts the resonance frequency of water molecules in the vicinity of the nanoparticle and decreases their relaxation times. These effects lead to a strong and highly detectable decrease in the MRI signal intensity in the vicinity of the nanoparticle on T2-weighted, -weighted, and steady-state free precession images (8,12,13).
The detection of magnetic nanoparticles with sequences producing negative or hypointense signal has proven highly sensitive and capable of detecting nanomolar concentrations (13,14). However, these conventional imaging techniques do suffer from several problems: (1) extremely high local concentrations of MION may produce a complete signal void precluding the accurate quantification of nanoparticle concentration; (2) the detection of MION in regions with low intrinsic signal-to-noise ratio (SNR) is difficult; (3) it is difficult to distinguish MION-induced susceptibility changes from those caused by susceptibility artifacts such as air/tissue interfaces; (4) the long TEs required to detect low concentrations of MION complicate the detection of MION in moving objects, such as the heart, where short steady-state free precession images are optimal. Therefore, several techniques have recently been proposed to create positive or bright contrast from magnetic nanoparticles to attempt to overcome some of these challenges. These positive-contrast techniques fall into three general classes: (1) a gradient-dephasing-based imaging approach, (2) an off-resonance imaging (ORI) method, and (3) an off-resonance saturation technique.
The gradient-dephasing technique, first proposed by Seppenwoolde and co-workers (15), uses a slice gradient to dephase the background water signal followed by an incomplete gradient rephasing pulse. The dipole field of the susceptibility-based contrast agent compensates for the weak rephasing gradient, thereby selectively refocusing only the magnetization of water molecules in the vicinity of the magnetic nanoparticle. A gradient-depashing technique termed GRASP, developed by Mani, Fayad and co-workers, has recently been used to image ferumoxides in gel phantoms (16) as well as ferritin deposition in a rabbit model of carotid injury (17).
More recently, ORI approaches have been developed to produce positive contrast. Cunningham and co-workers used spectrally selective RF (SSRF) pulses to excite only the susceptibility-shifted, or ‘off-resonance’, water molecules (18,19). An alternative ORI technique termed IRON, proposed by Stuber and co-workers (20,21), uses an inversion recovery pulse sequence to null on-resonance water and fat, followed by a standard slice-selective spin-echo sequence with broadband detection.
In addition, an off-resonance saturation method has been developed by Zurkiya and Hu (22), in which water protons are imaged with and without the presence of an off-resonance saturation pulse. This method relies on diffusion-mediated saturation transfer to reduce the on-resonance MRI signal due to the off-resonance saturation pulse, similar to chemical exchange saturation transfer techniques (23).
These positive-contrast techniques have been predominantly used to successfully image high concentrations of magnetic nanoparticles, such as those found in exogenously labeled stem cells, at standard clinical field strengths. However, the potential of positive-contrast techniques to image low concentrations of iron oxide at 1.5 T was recently demonstrated by Mani et al. (16,17). The GRASP method was used to successfully image low concentrations of ferumoxides (0.05 mM Fe corresponding to 2.8 μg Fe/mL) and ferritin (5 μg Fe/mL) in gel-containing phantoms. However, no rigorous studies have been carried out to examine the sensitivity, specificity, and linearity of positive-contrast techniques over a range of field strengths. The aim of this study was thus to characterize the diagnostic accuracy and linearity of an ORI technique for the detection of iron oxides at field strengths ranging from 4.7 to 14 T. In vitro imaging of MION phantoms was performed at 4.7 and 14 T. The influence of the magnetic nanoparticle concentration and the magnetic field strength on the mean induced shift of the water resonance, the longitudinal and transverse relaxation rates, and the off-resonance signal intensity were determined. In vivo imaging of macrophage-targeted MION in a mouse model of post-infarction myocardial inflammation was then performed at 4.7 T. The sensitivity and specificity of the technique and the impact of various parameters, such as the water suppression bandwidth (WSBW) and TE, were extensively characterized.
The results of this study indicate that ORI is performed optimally at low magnetic fields and displays a non-linear response to higher concentrations of MION. These results have important implications for the use of this technique in both small animals and the clinical setting.
Materials and Methods
In vivo ORI
Three phantoms were used to characterize the off-resonance sequence in vitro. (1) A fluid-only phantom consisting of 3 mm NMR tubes (Wilmad LabGlass, Buena, NJ, USA) loaded with aqueous solutions of MION-47 (Center for Molecular Imaging Research, Boston, MA, USA) in the range 8–256 μg Fe/mL. The NMR tubes were immersed in a plastic tube filled with water. (2) A phantom with an air/fluid interface was constructed by filling eppendorf tubes approximately half way with aqueous solutions of MION in the range 8–256 μg Fe/mL. The eppendorf tubes were immersed in a water-containing plastic tube. (3) A fat/water phantom was constructed consisting of an eppendorf tube filled with olive oil and water.
MRI of the phantoms was performed on Bruker Avance (Billerica, MA, USA) 14 and 4.7 T scanners using transmit/receive bird-cage coils. The ORI pulse sequence consisted of a variable bandwidth on-resonance water excitation prepulse (10-lobed sinc pulse) followed by gradient crushers, a subsequent fat-selective excitation prepulse also followed by gradient crushers, and a standard slice-selective spin-echo imaging sequence (Fig. 1). Typical TE/TR values were 3.5/5000 ms at 14 T and 5.6/4000 ms at 4.7 T. T1 and T2 relaxation times were determined for different aqueous MION concentrations from inversion recovery spin-echo data and from multi-echo spin-echo data, respectively.
Figure 1.
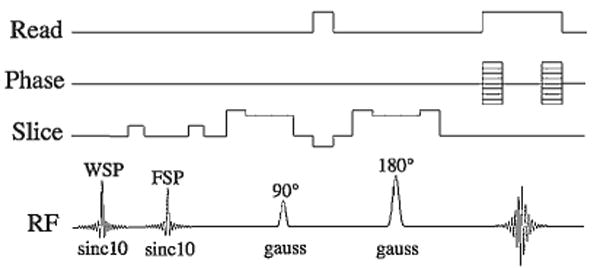
Schematic of the ORI pulse sequence. The sequence consists of a variable bandwidth water suppression pulse (WSP) followed by a crusher gradient, as well as a fat suppression pulse (FSP) followed by a crusher gradient. These pre-pulses are followed by a slice-selective spin-echo sequence to image the spins that have been shifted off-resonance and are thus not affected by the suppression prepulses. Sinc pulses (10-lobed) were used for the saturation prepulses, and Gaussian waveforms were used for the spin-echo readout to minimize the echo time of the sequence.
Quantification of the MION-induced resonance shifts
The mean water resonance shift induced by MION was quantified by varying the on-resonance WSBW and measuring the mean off-resonance signal intensity. The plot of the signal intensity versus WSBW was then fitted to a sigmoidal Boltzman function given by eqn (1):
| (1) |
This function is widely used to describe a distribution of states and was thus well suited to describing the distribution of resonance shifts induced by MION. The fit parameter x0 corresponds to the WSBW at which the signal intensity is half way between the maximum (A1) and minimum (A2) values. This corresponds to twice the mean induced resonance shift (δ): δ = ± x0/2.
Quantification of the diagnostic accuracy (sensitivity and specificity) of ORI
The diagnostic accuracy of ORI was determined for imaging both a fluid-only phantom and a phantom containing an air/fluid interface. In a fluid-only phantom, the diagnostic accuracy of ORI is determined by the ability of the technique to distinguish MION-shifted resonances from on-resonance water. In the presence of an air/fluid interface, however, the resonance shifts resulting from the susceptibility differences at the interface are far greater than the on-resonance water linewidth. In this situation, the diagnostic accuracy of ORI is thus determined by the ability of the technique to distinguish MION-shifted resonances from the nonspecific resonance shifts at the air/fluid interface. Receiver operating characteristic (ROC) curves for both the fluid-only phantom and the air/fluid phantom were thus generated as a function of WSBW and MION concentration.
Parametric models of sensitivity and specificity were used to derive the ROC curves. The SNR for each MION concentration, normalized to that obtained with no water suppression, was taken as a measure of the sensitivity. In particular, the normalized sigmoidal Boltzman function fitted to the WSBW dependence of the ORI SNR was used as a measure of the sensitivity, as given by eqn (2).
| (2) |
The values for the MION-induced resonance shift (MIS) and the suppression rate constant (ρ) are determined from the sigmoidal Boltzman fits of the experimental data, as described above in eqn (1).
Distinguishing on-resonance and MION-shifted resonances in the absence of an air interface depends on the ability of the water suppression pulse to suppress the on-resonance water. Specificity in this situation can thus be defined by the Lorentzian function given in eqn (3):
| (3) |
where LW is the on-resonance water linewidth. This parametric model simply represents the fraction of the on-resonance Lorentzian lineshape suppressed by the water suppression pulse. The specificity approaches unity when the on-resonance line is fully suppressed, WSBW ≫ LW, and zero when the LW ≫ WSBW.
In the presence of an air/tissue interface, the specificity of ORI can be defined as a function of the SNR of the signal induced by the susceptibility shifts at the air interface, normalized to the SNR obtained with no water suppression pulse. The normalized susceptibility artifact SNR depends on the WSBW and the severity of the air-induced resonance shift (AIS). Specificity in the presence of an air interface can thus be modeled as shown in eqn (4).
| (4) |
This model of specificity simply represents the fraction of the susceptibility artifact signal suppressed by the WSBW. The values for AIS and ρ were determined from the sigmoidal Boltzman fit of the WSBW dependence of the experimental ORI signal at an air/fluid interface as described in eqn (1). In particular, values of AIS = 311 Hz and ρ = 58 Hz were used.
ROC curves were generated for a range of MION concentrations by plotting the sensitivity versus 1–specificity as a function of WSBW. ROC curves were constructed for the fluid-only phantom at both 14 and 4.7 T to investigate the impact of field strength on diagnostic accuracy. ROC curves were also constructed at 4.7 T for a scenario where ORI is performed in a region containing an air/fluid interface. The area under each ROC curve was taken as a measure of the accuracy of the ORI technique for a given MION concentration and field strength. The optimal WSBW for each MION concentration was defined as that which maximized the sum of the sensitivity and specificity.
In vivo ORI
In vivo mouse ORI studies were performed on a 4.7 T Bruker Avance scanner with a custom-built solenoid coil (5 turn coil, 30 mm diameter, 70 mm length). The long axis of the solenoid coil was oriented perpendicular to the main field. The ORI pulse sequence used was identical with that used to image the phantoms and is shown in Fig. 1. The images were acquired without respiratory or cardiac gating to simplify the diagnostic protocol and because fine spatial resolution was not needed to characterize the signal and contrast behavior of the technique. Default parameters included: field of view = 35 × 30 mm, slice thickness = 1 mm, matrix = 128 × 128, on-resonance WSBW = 200 Hz, TR = 2000 ms, TE = 2.9 ms, and four signal averages. Images were acquired at five slice locations in the axial plane of the thorax, which approximates a short axis view of the heart in a mouse. Further images were acquired in these same locations with the same WSBW (200 Hz) but at TEs of 5.8, 8.7 and 11.6 ms. In addition, images with WSBWs of 400, 600 and 800 Hz were acquired at all four TEs.
An in vivo model of iron oxide uptake by macrophages infiltrating healing myocardial infarcts was used in this study for several reasons. Firstly, this model has been extensively characterized with conventional -based MRI and other molecular imaging methods (6,7). In addition, the natural uptake of iron oxide nanoparticles by tissue macrophages results in a more heterogeneous distribution of the nanoparticles than the local injection of heavily loaded stem cells. In particular, this model results in some areas of the injured myocardium having a high macrophage content (and hence iron oxide concentration), and thus resembling areas of myocardium injected with iron oxide-labeled cells. However, other areas of myocardium with low macrophage content may result in an iron oxide content per voxel more similar to that seen with targeted probes. The imaging of MION uptake by macrophages thus likely represents an intermediate scenario between the imaging of targeted contrast agents and the imaging of locally injected iron oxide-labeled cells. Finally, the thorax contains both fluid/fluid interfaces, such as the endocardium, and air/tissue interfaces, such as the chest wall, and was thus well suited to confirming the in vitro observations made in the phantoms.
The uptake of MION by macrophages infiltrating healing infarcts was imaged in infarcted C57Bl6 mice (n = 4) 4 days after permanent ligation of the left coronary artery. The mice were injected 48 h after coronary ligation with 15 mg Fe/kg MION via the tail vein. Imaging was performed a further 48 h later (96 h after the ligation) to allow the probe sufficient time to be taken up by the macrophages infiltrating the healing infarct. This protocol was identical with that used in two previous studies in which the uptake of iron oxide by macrophages in the healing infarct was demonstrated by conventional -based MRI, optical tomography, fluorescence microscopy, and histology (6,7). Uninfarcted mice (n = 3) were used as control animals. All experiments were performed in accordance with the guidelines for research animal care at our institution.
The uptake of MION in this study was quantified in the off-resonance images by comparing the contrast-to-noise ratio (CNR) between the anterolateral wall and the septum in control and infarcted mice [CNR = (anterolateral wall − septum)/standard deviation of noise]. Signal in the anterolateral wall was measured in two ways. The average signal was obtained from a region of interest encompassing the entire anterolateral wall. The peak signal in the anterolateral wall of the infarcted mice was measured in a region demarcated by the presence of a positive off-resonance signal. The CNR values of the control and infarcted mice were compared with an analysis of variance calculation (KaleidaGraph, Synergy Software, Reading, PA, USA), and statistical significance was defined by p < 0.05.
Results
Off-resonance images of aqueous MION phantoms acquired at 4.7 and 14 T, with a WSBW of 250 Hz, are shown in Fig. 2. In contrast with the previously reported experience at low magnetic field strengths (18), the ORI signal intensity as a function of MION concentration was highly non-linear at both 4.7 (Fig. 2c) and 14 T (Fig. 2g). In contrast, the mean induced resonance shifts at 4.7 (Fig. 2d) and 14 T (Fig. 2h), for MION concentrations of 8–256 μg Fe/mL, varied linearly with MION concentration. The minimum resolvable resonance shift corresponded to an aqueous MION concentration of 8 μg Fe/mL at 4.7 T and 32 μg Fe/mL at 14 T.
Figure 2.
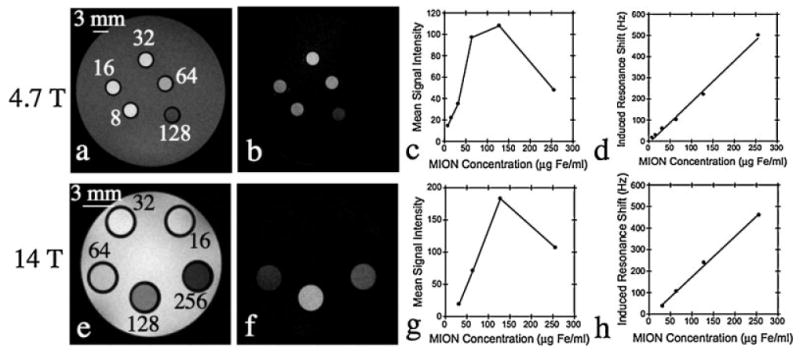
Spin-echo (a, e) and off-resonance (b, f) images of a phantom containing different aqueous MION concentrations in the range 8-256 μg Fe/mL. The relationship of off-resonance signal intensity (c, g) and induced resonance shift (d, h) to MION concentration at high field strengths is also shown. A highly non-linear relationship between MION concentration and signal intensity is seen at both 4.7 (c) and 14 T (g). This reflects the profound effect of MION on the transverse relaxation time (T2) and underscores the need for echo times significantly shorter than the T2 of the tissue of interest. In contrast, the mean induced resonance shift varies linearly with MION concentration at both 4.7 (d) and 14 T (h).
The longitudinal (T1) and transverse (T2) relaxation times were measured at 4.7 and 14 T. The longitudinal (r1) and transverse (r2) relaxivities of MION were calculated from the slope of the plot of relaxation rate (R1 = 1/T1 or R2 = 1/T2) versus MION concentration. The resulting relaxivity values are listed in Table 1 and included a r1 of 4.2 (mM Fe)−1 s−1 at 4.7 T and 0.9 (mM Fe)−1 s−1 at 14 T. The corresponding r2 values were 84.7 (mM Fe)−1 s−1 at 4.7 T and 83.3 (mM Fe)−1 s−1 at 14 T. These values are consistent with the superparamagnetic nature of MION, where r2 values plateau at ∼0.5 T.
Table 1. Factors promoting and opposing positive contrast at high magnetic field strengths. Both the MION-induced resonance shift (δ) and the longitudinal relaxivity (r1) promote positive contrast, whereas the large transverse relaxivity (r2) leads to signal loss and opposes the positive contrast.
| Promoting positive contrast | Opposing positive contrast | ||
|---|---|---|---|
| Field strength (T) | δ/[MION] (Hz/μg Fe/mL) | r1 (mM−1 s−1) | r2 (mM−1 s−1) |
| 4.7 | 1.9 | 4.2 | 84.7 |
| 14 | 1.9 | 0.9 | 83.3 |
Off-resonance images of the air/water and air/oil phantoms, acquired at 4.7 T, are shown in Fig. 3. Excellent suppression of the on-resonance water in both phantoms was achieved. However, in both phantoms, significant positive signal intensity was observed at air/water and air/oil interfaces. This is seen at the meniscus of the air/water phantom as well as in the water abutting air-containing portions of the air/water phantom (Fig. 3b). Similarly, fat-suppressed off-resonance images of the air/oil phantom revealed significant positive signal intensity near the air/oil interface despite excellent fat suppression in the rest of the phantom (Fig. 3f). This is due to the shift of the fat resonance, induced by susceptibility differences at the air/oil meniscus, leading to incomplete fat suppression.
Figure 3.
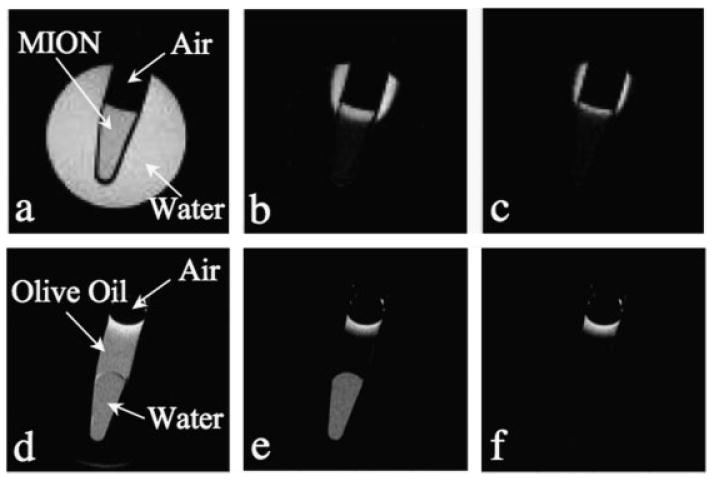
Positive contrast from susceptibility shifts at air/water (a–c) and air/oil (d–f) interfaces. The images shown are: spin-echo image (a), off-resonance image with a 200 Hz WSBW (b), off-resonance image with a 400 Hz WSBW (c), spin-echo image (d), fat-suppressed spin-echo image (e), fat-suppressed off-resonance image with a 250 Hz WSBW (f). All images were acquired at 4.7 T with TE/TR = 5.6/4000 ms. A broadband water suppression pulse is needed to reduce/eliminate the off-resonance positive contrast at air interfaces.
An increase in the WSBW did produce a reduction in the positive signal seen at the air interfaces in these phantoms. However, some positive signal was still present even with WSBWs as great as 800 Hz (data not shown). The mean induced resonance shift at the air interfaces in the phantoms, as well as at the thoracic wall/air interface of the subsequently imaged mice, was ∼300 Hz. In particular, the average resonance shift at the thoracic wall interface in the mice was 303 ± 22 Hz (n = 4), which corresponds to that produced by an aqueous MION concentration of 150 μg Fe/mL.
Analysis of the ROC curves (Fig. 4) showed that a high degree of diagnostic accuracy (area under curve) could be obtained with the ORI technique when imaging a phantom with no air interface. However, for lower MION concentrations, the diagnostic accuracy was significantly higher at 4.7 T (Fig. 4a) than at 14 T (Fig. 4b). The area under the ROC curve and the optimal WSBW for each MION concentration in the phantom lacking an air interface are shown in Table 2. Diagnostic accuracy is high until the mean resonance shift induced by the MION becomes similar in magnitude to the on-resonance water linewidth. This occurs at a MION concentration of 8 μg Fe/mL at 4.7 T (on-resonance linewidth 15 Hz) but at 32 μg Fe/mL at 14 T (on-resonance linewidth 45 Hz). The diagnostic accuracy of ORI in the presence of an air interface is poor until a MION concentration greater than 150 μg Fe/mL is reached, as shown in Fig. 4c and Table 3. At this concentration, the MION-induced shift becomes greater than the mean resonance shift arising at the air interface (±300 Hz), and diagnostic accuracy improves.
Figure 4.
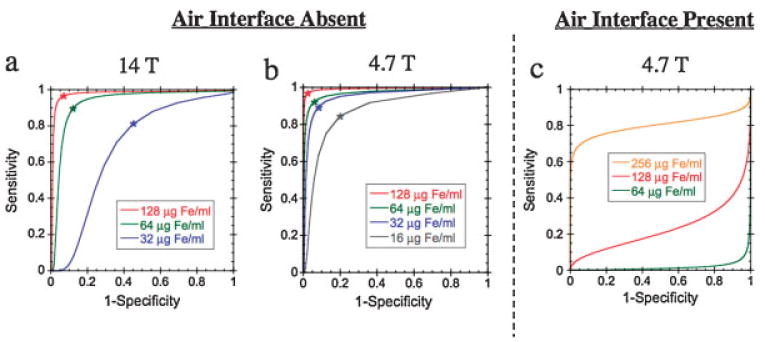
ROC curves for evaluating the diagnostic accuracy of ORI as a function of WSBW and MION concentration. In the absence of an air/tissue interface, the diagnostic accuracy is determined by the ability of the technique to distinguish MION-shifted resonances from on-resonance water. ROC curves for a fluid-only phantom have been plotted at 14 T (a) and 4.7 T(b). The increased on-resonance linewidth at 14 T (45 Hz) compared with 4.7 T (15 Hz) leads to a significant loss of diagnostic accuracy. In the presence of an air/fluid or air/tissue interface, the diagnostic accuracy is determined by the ability to resolve MION-shifted resonances from the large shifts induced at the air interface (c). The artifact-induced resonance shift (±300 Hz) leads to poor diagnostic accuracy for MION concentrations below 150 μg Fe/mL MION concentrations in the ROC curves are: 16 μg Fe/mL (gray), 32 μg Fe/mL (blue), 64 μg Fe/mL (green), 128 μg Fe/mL (red), 256 μg Fe/mL (orange). The optimal WSBW for each MION concentration (Table 2) is indicated by an asterisk.
Table 2. Diagnostic accuracy of ORI for disinguishing MION-shifted water resonances from on-resonance water at 14 and 4.7 T.
| Opimal WSBW (Hz) | Area under ROC curve | ||||
|---|---|---|---|---|---|
| MION concentration (μFe/mL) | MION-induced shift (Hz) | 14 T | 4.7 T | 14 T | 4.7 T |
| 256 | 502 | 300 | 140 | 0.991 | 0.997 |
| 128 | 222 | 200 | 100 | 0.976 | 0.992 |
| 64 | 102 | 120 | 60 | 0.926 | 0.970 |
| 32 | 60 | 50 | 50 | 0.678 | 0.951 |
| 16 | 29 | — | 30 | — | 0.872 |
Table 3. Diagnostic accuracy of ORI at 4.7 T for distinguishing MION-shifted water resonances from those water resonances shifted due to susceptibility differences at air interfaces.
| MION concentration (μg Fe/mL) | MION-induced shift (Hz) | Optimal WSBW (Hz) | Area under ROC curve |
|---|---|---|---|
| 256 | 502 | 800 | 0.801 |
| 128 | 222 | — | 0.230 |
| 64 | 102 | — | 0.195 |
In vivo off-resonance images of a control (Fig. 5a,b) and an infarcted (Fig. 5c,d) mouse are shown in Fig. 5. The off-resonance images have been mapped to a color scale and overlaid on conventional spin-echo images of the mice. In all mice, significant ORI signal intensity was observed at the air interface around the descending thoracic aorta and at the thoracic wall interface. The signal from these areas could be significantly attenuated, but not eliminated, by using a WSBW of 400 Hz (Fig. 5b,d). No off-resonance signal was seen in the myocardium of any of the non-infarcted control mice or in the remote uninjured myocardium of the infarcted mice. In contrast, a well-defined area of off-resonance positive contrast was seen in the injured anterolateral wall of each of the infarcted mice, as shown in Fig. 5c. However, when the WSBW was increased from 200 to 400 Hz, the positive contrast in the myocardium was consistently lost (Fig. 5d).
Figure 5.
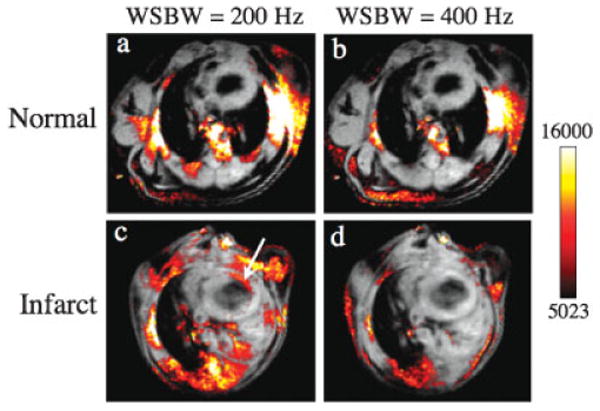
ORI of normal (a, b) and infarcted (c, d) mice acquired at 4.7 T with WSBWs of 200 (a, c) and 400 Hz (b, d). The off-resonance images have been mapped to a color scale and overlaid on to conventional spin-echo images. Iron oxide accumulation within macrophages infiltrating the injured myocardium produces positive off-resonance contrast (arrow) for a WSBW of 200 Hz. Increasing the WSBW to 400 Hz reduces much of the background off-resonance signal; however, the sensitivity to MION accumulation in the myocardium is lost. No off resonance signal was observed in the myocardium of any of the normal control mice.
Magnified views of spin-echo and off-resonance images of an infarcted mouse are shown in Fig. 6. The negative-contrast enhancement produced by MION can be seen in the thinned anterolateral wall of the myocardium on the spin-echo images, particularly as the echo time is increased (Fig. 6b). A corresponding area of positive-contrast enhancement is clearly seen in the anterolateral myocardium on the off-resonance images (Fig. 6c). However, when the echo time of the off-resonance image is increased from 2.9 ms to 8.7 ms, the positive contrast in the myocardium is completely lost (Fig. 6d). The loss of positive ORI contrast at longer echo times was consistently seen in all the infarcted mice.
Figure 6.
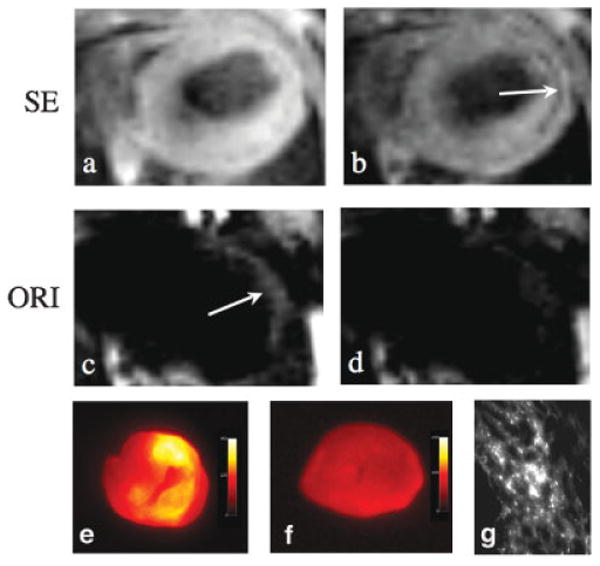
Off-resonance (ORI) and spin-echo (SE) imaging of MION accumulation within infarcted myocardium at 4.7 T. Fat suppressed spin-echo images were acquired with echo times of 2.9 (a) and 11.6 ms (b). The negative contrast enhancement produced by MION can be seen in the thinned anterolateral wall (arrow). Off-resonance spin-echo images were acquired using a WSBW of 200 Hz and echo times of 2.9 (c) and 8.7 ms (d). Positive contrast (arrow) is seen in the anterolateral myocardium at the shorter echo times but not at an echo time of 8.7 ms. The use of short echo times is thus critical to preserve the sensitivity of the ORI technique. (e) Ex vivo fluorescence imaging of the heart of a mouse injected with fluorescently labeled MION. The distribution of increased fluorescence intensity correlates well with the distribution of positive contrast with ORI. (f) Ex vivo fluorescence imaging of the heart of a control mouse. (g) Fluorescence microscopy showing accumulation of the iron oxide nanoparticle in the myocardium of an infarcted mouse.
The off-resonance CNR between the anterolateral wall and septum in the control mice was essentially negligible (0.07 ± 0.43). In contrast, the average off-resonance CNR between the anterolateral wall and septum in the infarcted mice was 7.2± 1.0 (p = 0.002). Peak CNR in the infarcted mice was even higher at 10.2 ± 1.6 (p = 0.003). However, CNR values almost twice as large were previously obtained when iron oxide nanoparticles were imaged in the identical model with a conventional -based approach (6).
The uptake of MION by macrophages in this mouse model of a healing myocardial infarct has been confirmed by fluorescence imaging, histology, and immunohistochemistry in two recent studies, where infarcted mice were injected with fluorescently labeled MION and imaged with MRI and fluorescence techniques (6,7). Increased fluorescence activity was consistently seen in the hearts of these mice in a distribution identical with that of the increased positive contrast seen with ORI in this study (Fig. 6c,e). Fluorescence microscopy confirmed the accumulation of the iron oxide nanoparticles in the infarcted myocardium of these mice (Fig. 6g), and the fluorescence signal colocalized strongly with immunohistochemistry stains for macrophages.
Discussion
The imaging of magnetic nanoparticles with positive contrast techniques, such as ORI, has the potential to become an extremely useful tool in cell tracking and molecular imaging. Stem cells heavily loaded with magnetic nanoparticles (18), and endogenous ferritin accumulation in carotid plaque (17), have already been successfully imaged with these techniques at 1.5 T. However, to date, no detailed studies of the sensitivity, specificity, and linearity of ORI have been performed over a range of field strengths. Such studies are particularly important for evaluating the potential of ORI for imaging iron oxides at the high fields needed for high-resolution animal imaging, and for detecting dilute and disperse concentrations of iron oxides, such as those produced by targeted molecular probes. The results of this study show that the diagnostic accuracy of ORI for iron oxide nanoparticles demonstrates a strong field dependence, and that ORI has a highly non-linear response to increasing nanoparticle concentrations.
Field dependence of ORI specificity
The specificity of ORI for distinguishing MION-induced off-resonance water from on-resonance water depends on both the on-resonance water linewidth and the WSBW [see eqn (3)]. Owing to the increased linewidths observed at 14 T (∼ 45 Hz) compared with 4.7 T (∼ 15 Hz), much greater WSBWs are required to obtain high specificity. This is clearly demonstrated by the ROC curves in Fig. 4 where the area under the curve (Table 2) is significantly less for a given MION concentration at 14 T (Fig. 4a) than at 4.7 T (Fig. 4b). In addition, the optimal WSBW (Table 2) is approximately twice as large at 14 T as at 4.7 T. These results clearly indicate that increased specificity is obtained at low magnetic field strengths where the on-resonance linewidths are narrowest and the greatest resolution between on-resonance and off-resonance waters is obtained.
For many in vivo applications, it is also critical to be able to distinguish MION-shifted waters from resonance shifts at air interfaces caused by susceptibility differences. The air/tissue interface of the thoracic cavity is an extreme example of such susceptibility artifact effects and was examined in this study. Large resonance shifts were consistently seen at air interfaces in this study both in vitro (Fig. 3) and in vivo (Fig. 5). The mean induced resonance shifts at the air interface of the phantom in vitro and the thoracic wall in vivo were both ∼300 Hz, which is equivalent to the shift induced by an aqueous MION concentration of 150 μg Fe/mL Therefore, the specificity of the ORI technique for MION in the presence of an air interface drops off dramatically for MION concentrations below 150 μg Fe/mL. This is demonstrated in the ROC curves of Fig. 4c, where good specificity is observed for 256 μg Fe/mL MION, whereas specificity equivalent to random chance (area under the curve = 0.5) was observed for concentrations of 128 and 64 μg Fe/mL. Suppression of non-specific background areas of positive contrast could be achieved, but only through the use of broad WSBWs. However, as shown in Fig. 5, the use of broad WSBWs also suppresses signals from lower concentrations of MION, such as those produced by targeted or macrophage-avid iron oxide probes, where the protons are shifted only slightly off-resonance.
It is therefore likely that a certain degree of non-specific background signal will need to be tolerated at air interfaces, such as the thoracic wall, in order to maintain the sensitivity of the technique for detecting dilute MION at high fields. These susceptibility-artifact-induced resonance shifts, however, will be significantly reduced at lower field strengths. This has recently been demonstrated by Stuber and co-workers (21) where a much smaller WSBW (170 Hz) was required to obtain adequate in vivo ORI specificity at 3 T in a rabbit model injected with MION. This study thus also indicates that improved ORI specificity can be achieved at low magnetic field strengths and provides further impetus for performing ORI at low fields.
Field dependence of ORI sensitivity
The sensitivity of ORI depends not only on the SNR, which typically increases with field strength, but also on the MION-induced resonance shift, the WSBW, and the TE. The superparamagnetic nature of MION causes the resonance shift it induces in surrounding water molecules to plateau at ∼0.5 T The resonance shift as a function of MION concentration was thus almost identical at both 4.7 and 14 T. In contrast, as discussed above, the on-resonance water linewidth increased with increasing field strength (∼15 Hz at 4.7 T and ∼45 Hz at 14 T) and therefore larger WSBWs were required at high fields to suppress the on-resonance water and accurately distinguish MION-shifted waters from on-resonance waters (Table 2). The increased WSBWs required at high fields in turn lead to decreased sensitivity [see eqn (2)]. The optimal field for ORI will thus be a compromise between maximal SNR and minimal linewidth and WSBW. For our experiments at 4.7 and 14 T, however, we have found that the spectral linewidths were the limiting factor in detecting low MION concentrations. It is therefore likely that ORI will work optimally at lower magnetic field strengths, where linewidths are narrower and there is greater spectral resolution between the on-resonance and off-resonance water molecules.
The lowest MION concentration detectable in our aqueous MION phantom at 4.7 T was 8 μg Fe/mL, whereas at 14 T it was 32 μg Fe/mL. It should be noted, however, that these detection limits have been calculated for MION in pure aqueous solution. It is likely that the aggregation or compartmentalization of MION in a tissue with restricted water diffusion/exchange would lead to greater induced resonance shifts for a given MION concentration and hence potentially an increased in vivo sensitivity. However, it has also previously been shown that aggregation in solution (24) or compartmentalization in cells of superparamagnetic iron oxide nanoparticles results in increased R2 (25) and (26) relaxation rates. Similarly, studies in gelatin phantoms observed a decrease in water diffusion and an increase in R2 relaxation rate with increasing gelatin concentration (27). The effects of MION compartmentalization on ORI signal intensity are thus likely to be highly complex, with compartmentalization promoting positive contrast through greater off-resonance shifts and opposing it through increases in R2.
Non-linearity of ORI
The sensitivity of ORI initially increased with increasing MION concentrations as the resonance frequency of greater numbers of water molecules were shifted outside of the WSBW (Fig. 2c,g). However, once the T2 became comparable to the TE, a significant decrease in sensitivity was observed. The non-linearity of the ORI signal intensity with MION concentration is explained by the very short T2 relaxation times observed for high MION concentrations, which leads to a loss of sensitivity even with very short echo times. The maximal signal intensity is therefore not necessarily obtained for the largest MION concentration. A similar decrease in sensitivity with very high iron oxide concentrations has recently been observed at 3 T in an ORI magnetic resonance angiography study of a rabbit model, where the CNR in the rabbit aorta 1 day after MION injection was significantly greater in rabbits that received 80 μmol/kg MION than in those that received 250 μmol/kg MION (21). The linearity in signal intensity observed by others at low fields (1.5 T) with ferumoxides (18) is most likely due to the significantly longer T2 relaxation times of iron oxide containing media or tissue at 1.5 T, the significantly smaller TE/T2 ratios obtainable, and the significantly smaller changes in the TE/T2 ratio as a function of iron oxide concentration.
The generation of positive contrast with off-resonance techniques is also influenced to varying degrees (depending on the technique used) by the r1 effects of iron oxide. With the technique used in this study, spins shifted off resonance by MION will also have a shorter T1 because of the local r1 effects of MION. The positive contrast generated by MION with the off-resonance technique is thus enhanced by its r1 effects. Conversely, the r2 effects of MION on the off-resonance spins produce a more rapid decay in the signal and oppose the generation of positive contrast (Table 1). Whereas the r1 values of MION decrease significantly with field strength, the r2 values of MION remain constant above 0.5 T, resulting in a significant increase in r2/r1 with increasing field strength. For instance, the r2/r1 value of MION-47 at 0.5 T is ∼2, whereas at 9.4 T and higher it exceeds 80 (28). The increase in r2/r1, in addition to the broader on-resonance linewidth, makes the generation of positive contrast with increasing field more challenging.
The large r2 relaxivity of most iron oxides indicates that, for optimal ORI sensitivity, it is critical to use very short TEs and moderate iron oxide concentrations. As ORI works optimally at very short TEs, it is well suited for imaging MION in regions that experience motion, such as the myocardium, where the longer TEs required for -weighted imaging could result in significant motion artifacts. The slower T2 decay observed at lower fields also indicates that increased sensitivity should be obtained at lower field strengths.
Implications for in vivo ORI
Positive contrast was consistently seen at the thoracic wall interface, in particular perpendicular to the direction of the applied B0 field, and also surrounding the descending thoracic aorta in both the control and infarcted mice imaged in this study (Fig. 5). However, no evidence of positive contrast was seen in the myocardium of any of the control mice, suggesting that the susceptibility shifts induced at the heart/lung interface were lower than those induced at the chest wall and the aorta. Clear evidence of positive contrast, however, was observed in the anterolateral myocardium in all the infarcted mice and was strictly confined to the injured anterolateral wall (Figs. 5 and 6), resulting in a high off-resonance CNR between it and the uninjured septum (Fig. 6). The presence of positive contrast in the myocardium was thus specific for the accumulation of MION in injured myocardium, as seen in previous studies using a conventional based approach (6,7). However, the maximal CNR between the septum and anterolateral wall obtained by ORI in this study was approximately half that obtained previously with conventional imaging of the identical animal model (6), suggesting a reduction in sensitivity with the ORI technique. Likewise, Mani et al. (17) were able to generate significant CNR with the GRASP technique from ferritin accumulation in a rabbit model of carotid injury, but the CNR generated with a weighted gradient-echo sequence of the carotids was ∼25% higher. The difference in the off-resonance and conventional CNR in the study by Mani et al. at 1.5 T was less than that seen in our study. This most likely reflects the reduced sensitivity of ORI at high field strengths, such as 4.7 T, as opposed to 1.5 T.
The disadvantage of the decreased sensitivity of the off-resonance techniques is, however, offset by several potential advantages such as the ability to detect iron oxides in regions that undergo motion, where very short TEs are required. In addition, although the detection and quantification of low concentrations of iron oxide are probably best performed with maps because of their high sensitivity, quantification of higher concentrations of iron oxides can potentially be performed more efficiently with only a single off-resonance image. However, care must be taken to ensure that the concentration of iron oxide does not exceed the linear dynamic range of the off-resonance technique, which is least likely to occur at lower field strengths and with sequences containing very short TEs. Finally, the use of off-resonance and T1-weighted imaging can also be extremely helpful in distinguishing negative contrast due to iron oxide on -weighted images from other causes of signal hypointensity such as calcification and partial voluming.
The sensitivity of ORI for detecting MION in the myocardium depends critically on both the WSBW and the TE. This is clearly seen in Figs. 5 and 6 where ORI sensitivity for MION at an echo time of 2.9 ms and a WSBW of 200 Hz was good (Fig. 5c), whereas no positive contrast was evident in off-resonance images acquired with either longer TEs (8.9 ms, Fig. 6d) or broader WSBWs (400 Hz, Fig. 5d). The lack of positive contrast for a WSBW of 400 Hz indicates that the mean resonance shift induced by the myocardial MION was significantly less than 400 Hz. Although the dependence of the induced resonance shifts on MION concentration has not yet been characterized in vivo, the aqueous MION phantoms can be used to estimate an upper bound for the in vivo MION concentration. With a WSBW of 400 Hz, a small ORI signal intensity was observable in the aqueous MION phantoms at 64 μg Fe/mL but not at 32 μg Fe/mL. This suggests that the MION concentration in the infarcted myocardium was less than 64 μg Fe/g myocardium. MION compartmentalization and restricted water diffusion would probably result in greater in vivo induced shifts compared with a given concentration of aqueous MION. Therefore, the actual MION concentration within the infarct may be significantly less than this upper bound of 64 μg Fe/mL.
Although the ORI sensitivity with a WSBW of 200 Hz was sufficient to detect dilute MION in the myocardium, the specificity was limited. Although the specificity could potentially be enhanced through the use of larger WSBWs, this would result in a loss of sensitivity. This is demonstrated very clearly in Fig. 5d where increasing the WSBW to 400 Hz not only eliminated most non-specific areas of positive contrast, but also eliminated positive contrast arising from dilute MION in the myocardium. However, moving to lower field strengths where the air-interface-induced shifts are reduced while the MION shifts are unchanged should provide a significant increase in specificity.
Although dextranated MION can be considered a macrophage-targeted nanoparticle, several receptor/ligand-targeted iron oxide probes have recently been developed (8,9). These probes could produce even lower tissue concentrations of magnetic nanoparticles, and the sensitivity of ORI for these probes will require further study. The impact of moving to lower fields will also need to be further studied. Although SNR and spatial resolution may suffer at lower fields, the reduction in the resonance shifts produced at air/tissue interfaces, the narrower spectral linewidths, and the longer T2 relaxation times observed at lower fields may all help to promote increased sensitivity and specificity. The advantages and disadvantages of ORI at higher field strengths will thus need to be considered on a case by case basis in the context of the biological question being addressed. Finally, the use of new-generation magnetic nanoparticles (29,30) with significantly higher relaxivities than MION-47 may provide significantly increased resonance shifts and hence greater sensitivity and specificity.
Conclusions
The results of this study show that the sensitivity of ORI is sufficient for the in vivo detection of iron oxides at high fields. However, the specificity is limited by the large on-resonance water linewidths and the large resonance shifts produced by susceptibility differences at high fields. Significantly improved specificity is expected at lower fields where decreased on-resonance water linewidths and reduced susceptibility artifact-induced resonance shifts are observed. In addition, the ORI signal intensity was highly non-linear and decreased for high MION concentrations because of the extremely short T2 relaxation times. These studies therefore indicate that ORI is performed optimally at low fields with moderate MION concentrations and with sequences containing very short TEs.
Acknowledgments
This research was supported by the National Institutes of Health (NCRR: P41-RR14075) and the Mental Illness and Neuroscience Discovery Institute (MIND). C.T.F. gratefully acknowledges support from the National Cancer Institute (T32-CA009502-19). D.E.S. gratefully acknowledges support from the National Heart, Lung, and Blood Institute (K08-HL079984-02).
Contract/grant sponsor: National Institutes of Health; contract/grant number: NCRR: P41-RR14075.
Contract/grant sponsor: Mental Illness and Neuroscience Discovery Institute (MIND).
Contract/grant sponsor: National Cancer Institute; contract/grant number: T32-CA009502-19.
Contract/grant sponsor: National Heart, Lung, and Blood Institute; contract/grant number: K08-HL079984-02.
Abbreviations
- CNR
contrast-to-noise ratio
- LW
linewidth
- MION
monocrystalline iron oxide nanoparticle
- ORI
off-resonance imaging
- WSBW
water suppression bandwidth
- ROC
receiver operating characteristic
- SNR
signal-to-noise ratio
References
- 1.Shen T, Weissleder R, Papisov M, Bogdanov A, Brady TJ. Monocrystalline iron oxide nanocompounds (MION): physicochemical properties. Magn Reson Med. 1993;29:599–604. doi: 10.1002/mrm.1910290504. [DOI] [PubMed] [Google Scholar]
- 2.Harisinghani MG, Barentsz J, Hahn PF, Deserno WM, Tabatabaei S, van de Kaa CH, de la Rosette J, Weissleder R. Noninvasive detection of clinically occult lymph-node metastases in prostate cancer. N Engl J Med. 2003;348:2491–2499. doi: 10.1056/NEJMoa022749. [DOI] [PubMed] [Google Scholar]
- 3.Sosnovik DE, Weissleder R. Magnetic resonance and fluorescence based molecular imaging technologies. Prog Drug Res. 2005;62:83–115. doi: 10.1007/3-7643-7426-8_3. [DOI] [PubMed] [Google Scholar]
- 4.Frank JA, Miller BR, Arbab AS, Zywicke HA, Jordan EK, Lewis BK, Bryant LH, Bulte JW. Clinically applicable labeling of mammalian and stem cells by combining superparamagnetic iron oxides and transfection agents. Radiology. 2003;228:480–487. doi: 10.1148/radiol.2281020638. [DOI] [PubMed] [Google Scholar]
- 5.Lewin M, Carlesso N, Tung CH, Tang XW, Cory D, Scadden DT, Weissleder R. Tat peptide-derivatized magnetic nanoparticles allow in vivo tracking and recovery of progenitor cells. Nat Biotechnol. 2000;18:410–414. doi: 10.1038/74464. [DOI] [PubMed] [Google Scholar]
- 6.Sosnovik DE, Nahrendorf M, Deliolanis N, Novikov M, Aikawa E, Josephson L, Rosenzweig A, Weissleder R, Ntziachristos V. Fluorescence tomography and magnetic resonance imaging of myocardial macrophage infiltration in infarcted myocardium in vivo. Circulation. 2007;115:1384–1391. doi: 10.1161/CIRCULATIONAHA.106.663351. [DOI] [PubMed] [Google Scholar]
- 7.Nahrendorf M, Sosnovik DE, Waterman P, Swirski FK, Pande A, Aikawa E, Figueiredo JL, Pittet MJ, Weissleder R. Dual channel optical tomographic imaging of leukocyte recruitment and protease activity in the healing myocardial infarct. Circ Res. 2007;100:1218–1225. doi: 10.1161/01.RES.0000265064.46075.31. [DOI] [PubMed] [Google Scholar]
- 8.Sosnovik DE, Schellenberger EA, Nahrendorf M, Novikov MS, Matsui T, Dai G, Reynolds F, Grazette L, Rosenzweig A, Weissleder R, Josephson L. Magnetic resonance imaging of cardiomyocyte apoptosis with a novel magneto-optical nanoparticle. Magn Reson Med. 2005;54:718–724. doi: 10.1002/mrm.20617. [DOI] [PubMed] [Google Scholar]
- 9.Nahrendorf M, Jaffer FA, Kelly KA, Sosnovik DE, Aikawa E, Libby P, Weissleder R. Noninvasive vascular cell adhesion molecule-1 imaging identifies inflammatory activation of cells in atherosclerosis. Circulation. 2006;114:1504–1511. doi: 10.1161/CIRCULATIONAHA.106.646380. [DOI] [PubMed] [Google Scholar]
- 10.Weissleder R, Moore A, Mahmood U, Bhorade R, Benveniste H, Chiocca EA, Basilion JP. In vivo magnetic resonance imaging of transgene expression. Nat Med. 2000;6:351–355. doi: 10.1038/73219. [DOI] [PubMed] [Google Scholar]
- 11.Tannous BA, Grimm J, Perry KF, Chen JW, Weissleder R, Breake-field XO. Metabolic biotinylation of cell surface receptors for in vivo imaging. Nat Methods. 2006;3:391–396. doi: 10.1038/nmeth875. [DOI] [PubMed] [Google Scholar]
- 12.Foster-Gareau P, Heyn C, Alejski A, Rutt BK. Imaging single mammalian cells with a 1.5 T clinical MRI scanner. Magn Reson Med. 2003;49:968–971. doi: 10.1002/mrm.10417. [DOI] [PubMed] [Google Scholar]
- 13.Heyn C, Bowen CV, Rutt BK, Foster PJ. Detection threshold of single SPIO-labeled cells with FIESTA. Magn Reson Med. 2005;53:312–320. doi: 10.1002/mrm.20356. [DOI] [PubMed] [Google Scholar]
- 14.Hogemann-Savellano D, Bos E, Blondet C, Sato F, Abe T, Josephson L, Weissleder R, Gaudet J, Sgroi D, Peters PJ, Basilion JP. The transferrin receptor: a potential molceular imaging marker for human cancer. Neoplasia. 2003;5:495–506. doi: 10.1016/s1476-5586(03)80034-9. [DOI] [PMC free article] [PubMed] [Google Scholar]
- 15.Seppenwoolde JH, Viergever MA, Bakker CJ. Passive tracking exploiting local signal conservation: the white marker phenomenon. Magn Reson Med. 2003;50:784–790. doi: 10.1002/mrm.10574. [DOI] [PubMed] [Google Scholar]
- 16.Mani V, Briley-Saebo KC, Itskovich VV, Samber DD, Fayad ZA. Gradient echo acquisition for superparamagnetic particles with positive contrast (GRASP): sequence characterization in membrane and glass superparamagnetic iron oxide phantoms at 1.5 T and 3 T. Magn Reson Med. 2006;55:126–135. doi: 10.1002/mrm.20739. [DOI] [PubMed] [Google Scholar]
- 17.Mani V, Briley-Saebo KC, Hyafil F, Fayad ZA. Feasibility of in vivo identification of endogenous ferritin with positive contrast MRI in rabbit carotid crush injury using GRASP. Magn Reson Med. 2006;56:1096–1106. doi: 10.1002/mrm.21060. [DOI] [PubMed] [Google Scholar]
- 18.Cunningham CH, Arai T, Yang PC, McConnell MV, Pauly JM, Conolly SM. Positive contrast magnetic resonance imaging of cells labeled with magnetic nanoparticles. Magn Reson Med. 2005;53:999–1005. doi: 10.1002/mrm.20477. [DOI] [PubMed] [Google Scholar]
- 19.Foltz WD, Cunningham CH, Mutsaers AJ, Conolly SM, Stewart DJ, Dick AJ. Positive-contrast imaging in the rabbit hind-limb of transplanted cells bearing endocytosed superparamagnetic beads. J Cardiovasc Magn Reson. 2006;8:817–823. doi: 10.1080/10976640600777819. [DOI] [PubMed] [Google Scholar]
- 20.Stuber M, Gilson WD, Schaer M, Bulte JW, Kraitchman DL. Shedding light on the dark spot with IRON - a method that generates positive contrast in the presence of superparamagnetic nanoparticles. Proc Intl Soc Magn Reson Med. 2005;13:2608. [Google Scholar]
- 21.Korosoglou G, Shah S, Gilson WD, Schar M, Tang L, Terrovitis I, Weiss RG, Weissleder R, Kraitchman DL, Stuber M. Off-resonance angiography: a new method to visualize vessels. J Card Magn Reson. 2007;9:209–2211. [Google Scholar]
- 22.Zurkiya O, Hu X. Off-resonance saturation as a means of generating contrast with superparamagnetic nanoparticles. Magn Reson Med. 2006;56:726–732. doi: 10.1002/mrm.21024. [DOI] [PubMed] [Google Scholar]
- 23.Ward KM, Aletras AH, Balaban RS. A new class of contrast agents for MRI based on proton chemical exchange dependent saturation transfer (CEST) J Magn Reson. 2000;143:79–87. doi: 10.1006/jmre.1999.1956. [DOI] [PubMed] [Google Scholar]
- 24.Perez JM, Josephson L, O'Loughlin T, Hogemann D, Weissleder R. Magnetic relaxation switches capable of sensing molecular interactions. Nat Biotechnol. 2002;20:816–820. doi: 10.1038/nbt720. [DOI] [PubMed] [Google Scholar]
- 25.Simon GH, Bauer J, Saborovski O, Fu Y, Corot C, Wendland MF, Daldrup-Link HE. T1 and T2 relaxivity of intracellular and extracellular USPIO at 1.5 T and 3 T clinical MR scanning. Eur Radiol. 2006;16:738–745. doi: 10.1007/s00330-005-0031-2. [DOI] [PubMed] [Google Scholar]
- 26.Bowen CV, Zhang X, Saab G, Gareau PJ, Rutt BK. Application of the static dephasing regime theory to superparamagnetic iron-oxide loaded cells. Magn Reson Med. 2002;48:52–61. doi: 10.1002/mrm.10192. [DOI] [PubMed] [Google Scholar]
- 27.Bulte JW, Vymazal J, Brooks RA, Pierpaoli C, Frank JA. Frequency dependence of MR relaxation times. II. Iron oxides. J Magn Reson Imaging. 1993;3:641–648. doi: 10.1002/jmri.1880030414. [DOI] [PubMed] [Google Scholar]
- 28.Wunderbaldinger P, Josephson L, Weissleder R. Tat peptide directs enhanced clearance and hepatic permeability of magnetic nano-particles. Bioconjug Chem. 2002;13:264–268. doi: 10.1021/bc015563u. [DOI] [PubMed] [Google Scholar]
- 29.Moffat BA, Reddy GR, McConville P, Hall DE, Chenevert TL, Kopelman RR, Philbert M, Weissleder R, Rehemtulla A, Ross BD. A novel polyacrylamide magnetic nanoparticle contrast agent for molecular imaging using MRI. Mol Imaging. 2003;2:324–332. doi: 10.1162/15353500200303163. [DOI] [PubMed] [Google Scholar]
- 30.Lee JH, Huh YM, Jun YW, Seo JW, Jang JT, Song HT, Kim S, Cho EJ, Yoon HG, Suh JS, Cheon J. Artificially engineered magnetic nanoparticles for ultra-sensitive molecular imaging. Nat Med. 2007;13:95–99. doi: 10.1038/nm1467. [DOI] [PubMed] [Google Scholar]