Abstract
Economic choice is the behavior observed when individuals select one of multiple options available in alternative to each other. In economic choice, there is no intrinsically “correct” answer; the choice depends on subjective preferences. This behavior is traditionally the object of economic analysis1 and is also of primary interest in psychology2. However, the underlying mental processes and neuronal mechanisms are not well understood. Theories of human and animal choice have a cornerstone in the concept of value1–3. Consider for example a monkey offered one raisin versus one piece of apple. Behavioral evidence suggests that the animal chooses by assigning values to the two options4. But where and how are values represented in the brain? Here we show that, during economic choice, neurons in orbitofrontal cortex5–18 (OFC) encode the value of offered and chosen goods. Importantly, OFC neurons encode value independently of visuospatial factors and motor responses. For example, if a monkey chooses between A and B, neurons in OFC encode the value of the two goods independently of whether A is presented on the right and B on the left, or vice versa. This trait distinguishes OFC from other brain areas where value modulates activity related to sensory or motor processes19–25. Our results have broad implications for possible psychological models of economic choice. They suggest that economic choice is at its essence choice between goods, as opposed to choice between actions. In this scheme, neurons in OFC seem a good candidate network for value assignment underlying economic choice.
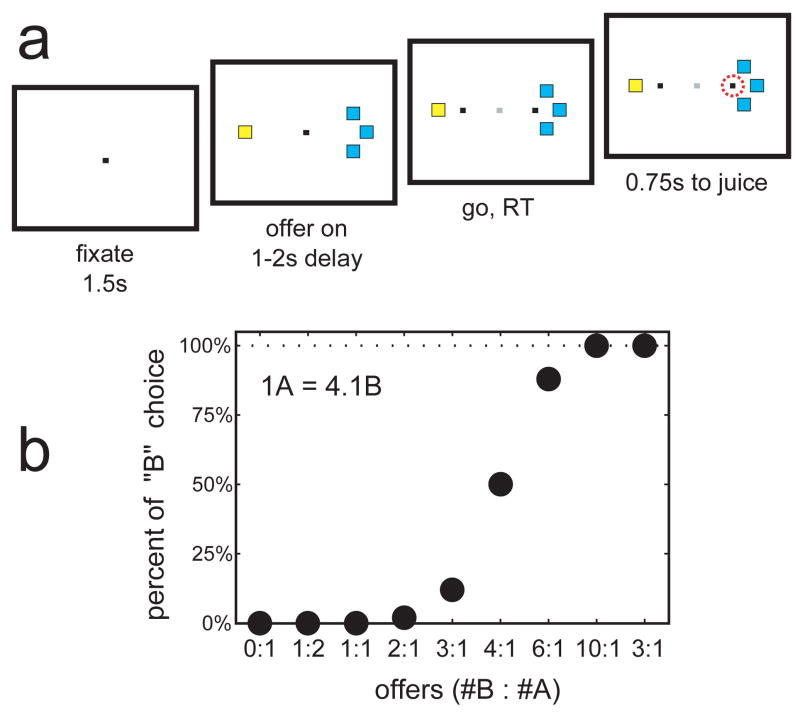
In our experiments, monkeys choose between two types of juice (A and B; A preferred) offered in different amounts. For example, in the session shown in figure 1, the monkey chooses between water (juice A) and unsweetened Kool-Aid (juice B). Offer types include 1B:2A, 1B:1A, 2B:1A, 3B:1A, 4B:1A, 6B:1A, and 10B:1A, and the “forced choices” 0B:1A and 3B:0A. Behaviorally, we observe a trade-off between juice type and juice quantity. The monkey chooses A when 1B, 2B, or 3B are available in alternative, it is roughly indifferent between the two juices when offered 4B:1A, and it chooses B when 6B or 10 B are available. We interpret this pattern of choice in terms of relative value of the two juices4: in this case, the value of 1A is roughly equal to the value of 4B. Fitting a sigmoid provides the better estimate V(1A)=V(4.1B). Assuming a linear value function, we obtain V(A)=4.1V(B). This equation puts different quantities of juices A and B on a same value scale. On this basis, we can compute for each trial the value of the juice chosen by the monkey. Expressing values in units of V(B), the chosen value is ≈4 when the monkey chooses 1A or 4B. When the monkey chooses 2A, the chosen value is ≈8. When the monkey chooses 6B, 10B, and 3B, the chosen value is respectively equal to 6, 10, and 3. Hence, we can make specific hypotheses regarding the neuronal representation of juice values. In different sessions and with different juices, we record different behavioral choice patterns. We then analyze each cell in relation to the choice pattern recorded in the same session.
Figure 1.
Experimental design. a. Trial structure (see Methods). b. Example of behavioral choice pattern. The plot shows the percentage of trials in which the monkeys chose juice B (y-axis) for various offer types (x-axis). A sigmoid fit provides the measure of the relative value n*=4.1.
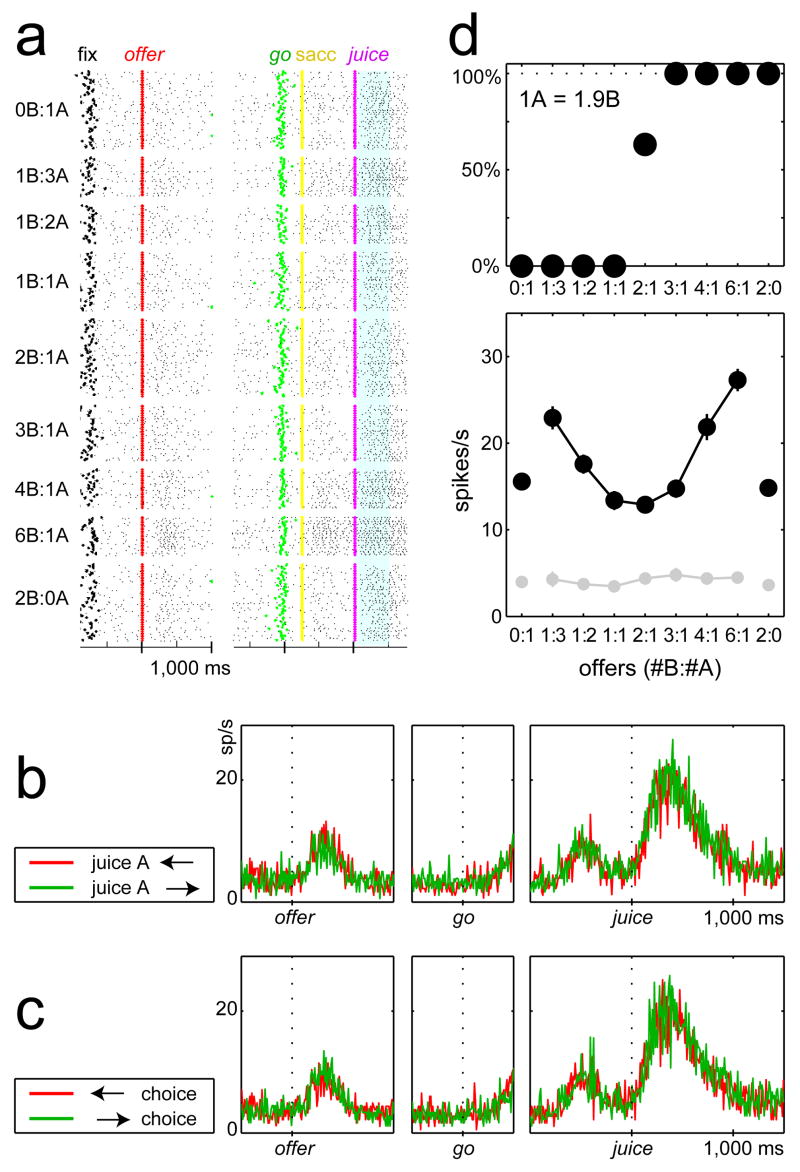
Our recordings focused on area 13 in OFC. Figure 2 illustrates the activity of one representative neuron. The cell’s activity does not depend on whether juice A is offered on the left or on the right (figure 2b). It also does not depend on whether the monkey chooses the juice on the left or the juice on the right (i.e., makes an eye movement to the left or to the right; figure 2c). However, the cell’s activity varies with the offer type. This is consistent across the neuronal population. We recorded the activity of 931 cells and we analyze their neuronal responses in seven time windows. We test the activity of each cell in each time window with a 3-way ANOVA (factors: [position of juice A] × [movement direction] × [offer type], p<0.001). Rarely do responses depend on either the spatial configuration of the offers or the motor output (<5% neurons). In contrast, the activity of 505 (54%) neurons varies significantly depending on the offer type in at least one time window. Pooling time windows, a total of 1379 responses are significantly modulated by the offer type (Supplementary Figure S2).
Figure 2.
Activity of one neuron. a. Rasters. Each line represents one trial and each small dot represents one spike. Trials, arranged by offer type, are aligned at the offer (left) and at the juice (right). The blue highlight marks the post-juice time window. b. Activity profiles shown separately for trials in which juice A is offered on the left (red) or on the right (green). The cell activity does not depend on the spatial configuration of the visual stimulus. c. Activity profiles shown separately for trials in which the monkey chooses the juice offered on the left (red) or on the right (green). The cell activity does not depend on the direction of the eye movement. d. Top: choice pattern recorded in this session (n*=1.9). Bottom: activity of the cell (±s.e.m.) recorded in the pre-offer (light gray, control) and post-juice time window (black). Note that the response does not reflect simple physical properties of the visual stimulus, such as the number of squares displayed on the monitor. For example, offer types 1B:3A and 3B:1A, which are visually identical except for the color of the squares, elicit very different activation.
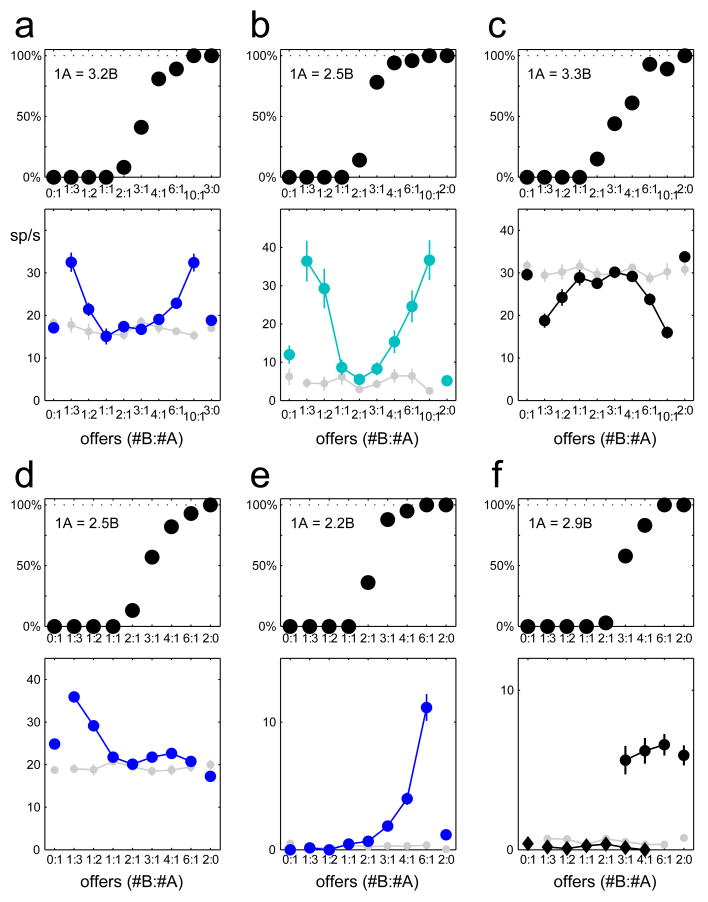
The cell shown in figure 2d has a “U-shaped” response similar to that hypothesized for a neuron encoding the chosen value. For this session V(A)=1.9V(B). Accordingly, the activity of the cell is lower when the monkey chooses 1A or 2B (in units of V(B), chosen value ≈ 2), it is higher when the monkey chooses 2A or 4B (chosen value ≈ 4), and it is highest when the monkey chooses 3A or 6B (chosen value ≈ 6). A linear regression of this response on the variable chosen value provides R2=0.86. Similar U-shaped responses are frequent in OFC, and figures 3a–c illustrate three more examples. We also find other types of responses. For example, neuronal responses often reflect the value of one of the two juices alone. Figures 3d–e show two cells whose activity co-varies with the value of A offered and the value of B offered, respectively. We label these responses as related to the offer value. Other frequently observed responses vary in a binary fashion depending on the type of juice chosen by the monkey, independently of the amount (figure 3f). We interpret these responses as related to juice taste.
Figure 3.
Activity of six neurons. For each cell, the top panel shows the choice pattern, with the relative value indicated on the top left. a–c. Responses encoding the chosen value. The response in c is negatively correlated with the chosen value (high activity for low value). d–e. Responses encoding the value of juice A offered (d) and the value of juice B offered (e). We refer to these responses as related to the offer value. d. Response encoding the juice taste. Here we separate trials in which the monkey chose juice A (diamonds) or juice B (circles). The response reflects the chosen juice type independently of the amount. Responses were recorded in the post-offer (a d e, blue), pre-juice (b, cyan), and post-juice (c f, black) time windows. For each cell, the curves in light gray show the activity in the pre-offer time window. Error bars represent the s.e.m.
While many neurons appear to encode chosen value, offer value or juice taste, the relation between their activity and these three variables could be subordinate to a correlation with other behavioral variables. For example, neurons in OFC might encode the number of squares on the monitor (or variables proportional to number, such as juice quantity, or absolute luminance of the visual stimulus). To cast a wide net, we examine the linear dependence of neuronal data on 19 possible variables (Supplementary Figure S1). For example, we analyze the variables chosen number, total number, and total value. We include in this analysis 1379 responses significantly modulated by the offer type, and we regress each response separately on each variable. Collectively, the 19 variables explain 1227 (89%) neuronal responses. However, the 19 variables are often highly correlated. To identify a few variables that best describe the neuronal population, we adapt procedures for variable selection commonly used in multi-linear regression in the presence of multi-collinearity. Both the stepwise and the best-subset methods identify variables offer value, chosen value, and taste, which explain well the large majority of responses (1085/1379=79% responses explained, mean R2=0.63). A post-hoc analysis indicates that the explanatory power of these three variables is significantly higher than that of challenging alternatives. Furthermore, data from the two monkeys analyzed separately provide statistically indistinguishable results. Finally, a bi-linear regression analysis indicates that in 890/1085 (82%) cases adding a second variable or a quadratic value term does not improve the regression significantly (Supplementary Results, p.S5–S10; Figures S4–S11). We conclude that, indeed, OFC responses encode variables offer value, chosen value, and taste.
We next turn to a specific analysis of U-shaped responses (figures 2d, 3a–c). In our experiments, relative values were generally stable within any recording session. However, the relative value of any given pair of juices could vary from day to day. For example, the relative value of apple juice versus peppermint tea varied between 1.5 and 3. This variability provides a further opportunity to test the neuronal encoding of value; specifically, U-shaped responses should reflect this variability. For this analysis, we test the entire neuronal population with the regression function a0 +aA (# A) +aB (# B), where (#A) and (#B) represent the amounts of juices A and B chosen by the monkey. We define a response to be U-shaped if both aA and aB differ from zero (p<0.01). If U-shaped responses indeed encode the value of the chosen juice, the slope ratio k*=aA/aB should be, for each response, equal to the relative value (n*) measured in that session. Most importantly, the slope ratio k* obtained for different responses should co-vary with n*. To test this prediction, we compute the regression k*=b0+b1 n* separately for every juice pair. Averaging across juice pairs, we obtain b0=−0.13 (±0.15) and b1=1.05 (±0.15) (±s.e.m.), consistent with the identity k*=n*. This result demonstrates that U-shaped responses do not reflect the quantity of any particular juice ingredient (e.g., sugar). Rather, they encode the value monkeys assign to the juice they choose to consume (Supplementary Results, p.S10–S12; Figures S12–S14).
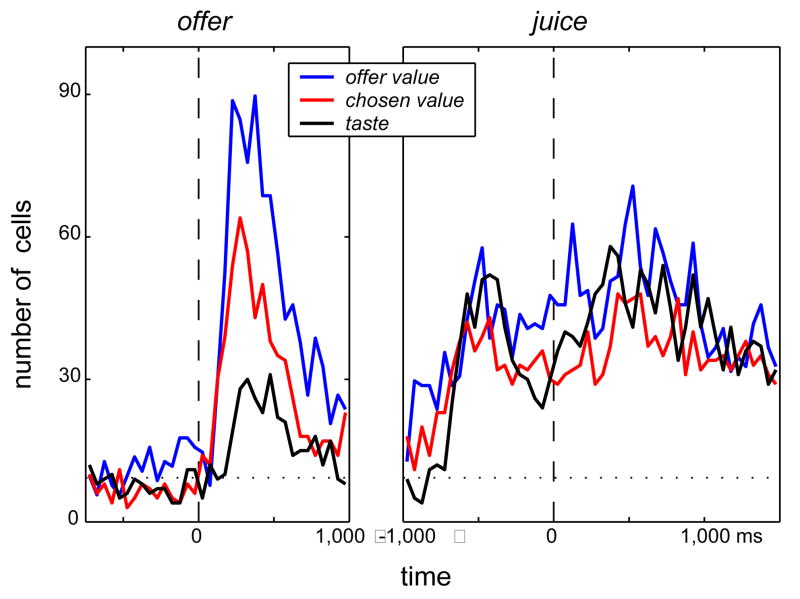
With respect to the timing of neuronal activation, the average neuronal activity peaks shortly after the offer, declines during the delay, is low before and during the eye movement, and has two secondary peaks at juice delivery (Supplementary Figure S3). To appreciate how the variables offer value, chosen value, and taste are represented in OFC over time, we analyze the activity of each cell in 50-ms, non-overlapping time bins. Figure 4 shows the number of cells encoding each of the three variables at different times. Remarkably, the time profile of different variables seems to reflect the mental processes the monkey likely undertakes during a trial. Shortly after the offer, when the monkey presumably assigns values to the two juices, neurons encoding the offer value (i.e., the value of one juice or the other) are most prevalent. Also during the delay, many neurons encode the chosen value (i.e., the value of the juice the monkey will eventually consume), even though the choice is still covert (because the go signal has not been given yet). Finally, after the monkey has indicated its choice, before and after juice delivery, many neurons encode the taste of the chosen juice.
Figure 4.
Time course. We assign each neuron to one variable of the three variables if the regression slope is significantly different from zero (p<0.01), and we include all 931 neurons in the analysis. The dotted line indicates chance level (9.31).
Conceptually, responses encoding the chosen value are particularly interesting because, in addition to being independent of the visuomotor contingencies of the task, they are also independent of the specifics of the good, namely juice type and juice amount. These responses encode economic value in a rather non-specific way. Further research is necessary to establish whether this result generalizes to other kinds of goods, such as non-comestible goods26. The interpretation of offer value responses is made more cautiously because, assuming linear value functions, the value of a given amount of juice is proportional to the juice quantity.
“Value” is known to modulate the activity of neurons in several sensory and motor areas19–25. For example, neurons in the lateral intraparietal area activate when monkeys plan a saccade towards a particular location of the visual field; their response is enhanced when the eye movement is associated with higher value20. On this basis, it has been proposed that parietal neurons encoding the value of all possible courses of action form a common path for decision-making, and that their activity is actually the subject of economic theory27. According to this “action-based” model, economic choice is fundamentally choice between actions. The fact that neurons in OFC encode the economic value of offered and chosen goods per se, and not as modulation of visuomotor processes, suggests an alternative “good-based” model, according to which economic choice is fundamentally choice between goods. In this view, choice is made between goods, and a suitable motor action is subsequently planned and executed. Several arguments seem to favor the good-based model. From a computational perspective, a modular design separating the mental operations of [choosing] and [moving] is more parsimonious28,29. In addition, values processed in OFC are logically sufficient for good-based choice. The action-based model would thus imply that, during economic choice, the nervous system operates in a computationally inefficient way, while undertaking all the processes needed to choose efficiently. Finally, a vast literature links choice in various domains to OFC. For example, human patients and monkeys with OFC lesions can present eating disorders and hyperorality6–8, abnormal risk-seeking and gambling behavior9,10, and impulsivity, altered personality and social behavior6,11. In contrast, parietal lesions typically result in visuospatial deficits such as hemi-neglect or Balint’s syndrome30. In conclusion, together with other lines of evidence, the present results support a good-based psychological model of economic choice behavior.
Methods
Each trial begins with the monkey fixating the center of a computer monitor (figure 1a). After 1.5s, two sets of squares appear on opposite sides of the fixation point (offer). The color of the squares indicates the juice type and the number of squares indicates the juice amount. For example, a monkey offered 3 blue squares versus 1 yellow square chooses between 3 drops of peppermint tea and 1 drop of grape juice. After a randomly variable delay (1–2s), two saccade targets appear near the offers (go). The monkey indicates its choice with an eye movement, and must maintain fixation on the target for an additional 0.75s before juice delivery (juice). The trial is aborted if the monkey breaks fixation before the go. The amounts of the two offered juices (0–10 drops) vary pseudo-randomly. For a given offer type, left/right positions are counterbalanced (i.e., the monkey may be offered 1A on the left and 3B on the right, or vice versa). A variety of different pairs of juices are used in different sessions (Supplementary Methods).
We analyze cell activity in the following time windows: 0.5s pre-offer (a control time window); 0.5s post-offer; late delay (0.5–1.0s after the offer); 0.5s pre-go; reaction time (RT; from go to saccade); 0.5s pre-juice; and 0.5s post-juice. For the statistical analysis, we separate for each offer type trials in which the monkey chooses juices A and B (Supplementary Methods).
Supplementary Material
Supplementary information is linked to the online version of the paper at www.nature.com/nature.
Acknowledgments
We thank Kim Irwin, Tim LaFratta, David Averbuch, John LeBlanc, Sharon Peled, and Jeff Harper for technical assistance and animal care; Emery Brown for a helpful discussion on the statistical analysis; and Todd Herrington, David Freedman, and Emilio Bizzi for comments on the manuscript. This work was supported by post-doctoral fellowships from the Lefler Foundation and from the Harvard Mind/Brain/Behavior Initiative (to C.P.S.) and by a grant from the National Institute of Neurological Disorders and Stroke (to J.A.A.).
References
- 1.Samuelson PA. Foundations of economic analysis. Harvard University Press; Cambridge, MA: 1947. [Google Scholar]
- 2.Kahneman D, Tversky A, editors. Choices, values and frames. Russell Sage Foundation - Cambridge University Press, Cambridge, UK; New York, NY: 2000. [Google Scholar]
- 3.Kagel JH, Battalio RC, Green L. Economic choice theory: an experimental analysis of animal behavior. Cambridge University Press; Cambridge, UK; New York, NY: 1995. [Google Scholar]
- 4.Padoa-Schioppa C, Jandolo L, Visalberghi E. Multi-stage mental process for economic choice in capuchins. Cognition. 2006;99:B1–B13. doi: 10.1016/j.cognition.2005.04.008. [DOI] [PubMed] [Google Scholar]
- 5.Ongur D, Price JL. The organization of networks within the orbital and medial prefrontal cortex of rats, monkeys and humans. Cereb Cortex. 2000;10:206–19. doi: 10.1093/cercor/10.3.206. [DOI] [PubMed] [Google Scholar]
- 6.Pasquier F, Petit H. Frontotemporal dementia: its rediscovery. Eur Neurol. 1997;38:1–6. doi: 10.1159/000112894. [DOI] [PubMed] [Google Scholar]
- 7.Hodges JR. Frontotemporal dementia (Pick’s disease): clinical features and assessment. Neurology. 2001;56:S6–10. doi: 10.1212/wnl.56.suppl_4.s6. [DOI] [PubMed] [Google Scholar]
- 8.Butter CM, McDonald JA, Snyder DR. Orality, preference behavior, and reinforcement value of nonfood object in monkeys with orbital frontal lesions. Science. 1969;164:1306–7. doi: 10.1126/science.164.3885.1306. [DOI] [PubMed] [Google Scholar]
- 9.Rahman S, Sahakian BJ, Hodges JR, Rogers RD, Robbins TW. Specific cognitive deficits in mild frontal variant frontotemporal dementia. Brain. 1999;122 (Pt 8):1469–93. doi: 10.1093/brain/122.8.1469. [DOI] [PubMed] [Google Scholar]
- 10.Bechara A, Tranel D, Damasio H, Damasio AR. Failure to respond autonomically to anticipated future outcomes following damage to prefrontal cortex. Cereb Cortex. 1996;6:215–25. doi: 10.1093/cercor/6.2.215. [DOI] [PubMed] [Google Scholar]
- 11.Raleigh MJ, Steklis HD. Effect of orbitofrontal and temporal neocortical lesions of the affiliative behavior of vervet monkeys (Cercopithecus aethiops sabaeus) Exp Neurol. 1981;73:378–89. doi: 10.1016/0014-4886(81)90273-9. [DOI] [PubMed] [Google Scholar]
- 12.Izquierdo A, Suda RK, Murray EA. Bilateral orbital prefrontal cortex lesions in rhesus monkeys disrupt choices guided by both reward value and reward contingency. J Neurosci. 2004;24:7540–8. doi: 10.1523/JNEUROSCI.1921-04.2004. [DOI] [PMC free article] [PubMed] [Google Scholar]
- 13.O’Doherty J, Kringelbach ML, Rolls ET, Hornak J, Andrews C. Abstract reward and punishment representations in the human orbitofrontal cortex. Nat Neurosci. 2001;4:95–102. doi: 10.1038/82959. [DOI] [PubMed] [Google Scholar]
- 14.Knutson B, Taylor J, Kaufman M, Peterson R, Glover G. Distributed neural representation of expected value. J Neurosci. 2005;25:4806–12. doi: 10.1523/JNEUROSCI.0642-05.2005. [DOI] [PMC free article] [PubMed] [Google Scholar]
- 15.Rolls ET, Sienkiewicz ZJ, Yaxley S. Hunger modulates the responses to gustatory stimuli of single neurons in the caudolateral orbitofrontal cortex of the macaque monkey. Eur J Neurosci. 1989;1:53–60. doi: 10.1111/j.1460-9568.1989.tb00774.x. [DOI] [PubMed] [Google Scholar]
- 16.Roesch MR, Olson CR. Neuronal activity related to reward value and motivation in primate frontal cortex. Science. 2004;304:307–10. doi: 10.1126/science.1093223. [DOI] [PubMed] [Google Scholar]
- 17.Wallis JD, Miller EK. Neuronal activity in primate dorsolateral and orbital prefrontal cortex during performance of a reward preference task. Eur J Neurosci. 2003;18:2069–81. doi: 10.1046/j.1460-9568.2003.02922.x. [DOI] [PubMed] [Google Scholar]
- 18.Tremblay L, Schultz W. Relative reward preference in primate orbitofrontal cortex. Nature. 1999;398:704–8. doi: 10.1038/19525. [DOI] [PubMed] [Google Scholar]
- 19.Kawagoe R, Takikawa Y, Hikosaka O. Expectation of reward modulates cognitive signals in the basal ganglia. Nat Neurosci. 1998;1:411–6. doi: 10.1038/1625. [DOI] [PubMed] [Google Scholar]
- 20.Platt ML, Glimcher PW. Neural correlates of decision variables in parietal cortex. Nature. 1999;400:233–8. doi: 10.1038/22268. [DOI] [PubMed] [Google Scholar]
- 21.Leon MI, Shadlen MN. Effect of expected reward magnitude on the response of neurons in the dorsolateral prefrontal cortex of the macaque. Neuron. 1999;24:415–25. doi: 10.1016/s0896-6273(00)80854-5. [DOI] [PubMed] [Google Scholar]
- 22.Shidara M, Richmond BJ. Anterior cingulate: single neuronal signals related to degree of reward expectancy. Science. 2002;296:1709–11. doi: 10.1126/science.1069504. [DOI] [PubMed] [Google Scholar]
- 23.Ikeda T, Hikosaka O. Reward-dependent gain and bias of visual responses in primate superior colliculus. Neuron. 2003;39:693–700. doi: 10.1016/s0896-6273(03)00464-1. [DOI] [PubMed] [Google Scholar]
- 24.Roesch MR, Olson CR. Impact of expected reward on neuronal activity in prefrontal cortex, frontal and supplementary eye fields and premotor cortex. J Neurophysiol. 2003;90:1766–89. doi: 10.1152/jn.00019.2003. [DOI] [PubMed] [Google Scholar]
- 25.McCoy AN, Crowley JC, Haghighian G, Dean HL, Platt ML. Saccade reward signals in posterior cingulate cortex. Neuron. 2003;40:1031–40. doi: 10.1016/s0896-6273(03)00719-0. [DOI] [PubMed] [Google Scholar]
- 26.Deaner RO, Khera AV, Platt ML. Monkeys pay per view: adaptive valuation of social images by rhesus macaques. Curr Biol. 2005;15 doi: 10.1016/j.cub.2005.01.044. [DOI] [PubMed] [Google Scholar]
- 27.Glimcher PW, Dorris MC, Bayer HM. Physiological utility theory and the neuroeconomics of choice. Games Econ Behav. 2005;52:213–256. doi: 10.1016/j.geb.2004.06.011. [DOI] [PMC free article] [PubMed] [Google Scholar]
- 28.Simon HA. The architecture of complexity. Proc Am Phil Soc. 1962;106:467–482. [Google Scholar]
- 29.Pinker S. How the mind works. Norton; New York, NY: 1997. [Google Scholar]
- 30.Zigmond MJ, Bloom FE, Landis SC, Roberts JL, Squire LR. Fundamental neuroscience. Academic Press; San Diego, CA: 1999. [Google Scholar]
Associated Data
This section collects any data citations, data availability statements, or supplementary materials included in this article.
Supplementary Materials
Supplementary information is linked to the online version of the paper at www.nature.com/nature.


