Abstract
Curricular maps can be used to link ability-based outcomes (ABOs) and content to courses in PharmD curricula as one component of an overall assessment plan. Curricular maps can also be used to meet some of the requirements delineated by Accreditation Council for Pharmacy Education, Standards 2007. Five steps can be followed to help ensure the successful production of a curricular map that both meets accreditation requirements and helps to inform curricular improvements. A case study is presented detailing how one college implemented a curricular mapping process that was subsequently used as data to inform curricular revisions.
INTRODUCTION
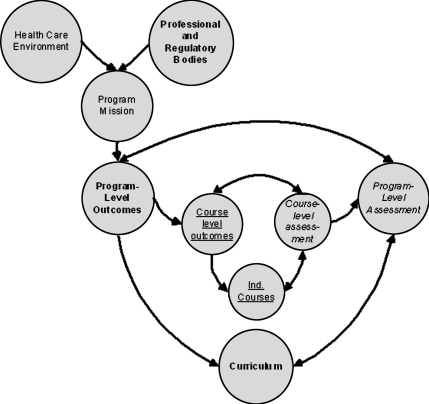
If the question “what is curriculum?” is posed to a room full of faculty members, a multitude of perspectives are offered. Some faculty members would list the courses that are required, others would describe courses that are taught, and some might even describe what students learn. Curriculum can be defined as the educational plan of an institution, school, college, department, program, or course.1 Imbedded within this broad definition of curriculum are 4 different conceptions of curriculum that form a curricular chain of causality.2 The first is the intended curriculum. This is the curriculum that “should be” or the planned curriculum (often specified in course catalogs), which may include the influences of regulatory agencies such as the Accreditation Council for Pharmacy Education (ACPE). By requiring mapping, the accrediting agencies can confirm that what they have defined as the required elements of a doctor of pharmacy (PharmD) curricula are in fact being delivered. The next is the enacted curriculum or what faculty actually “do” in the classroom (represented by syllabi). The third conception is the learned curriculum or what students experience. The final conception is the assessed curriculum or that for which we actually test or assess competence in the curriculum. By viewing curriculum from these 4 perspectives, a comprehensive picture can be formed that includes elements of design, delivery, and verification. A visual representation of curriculum, courses, and external influences is presented in Figure 1 where Porter and Smithson's conceptions of curriculum have been overlaid.2 At the heart of the diagram are the courses and course-level assessments that comprise the individual units of the curriculum. The sum of the individual courses then feed into the overall program, which in turn is influenced by the external agencies such as professional and regulatory bodies.
Figure 1.
Concept map of curriculum. Bold = designed or intended; underlined = enacted or delivered; italics = assessed.
Within the enacted or delivered curriculum, 4 dimensions can be captured to describe the construction of the curriculum. First, the topic coverage or content of the curriculum can be defined. This consists of the topics or information that is taught. Second is the relative emphasis of this content, how much of a given topic is taught, and how it relates to other topics in the curriculum. Third is the cognitive demand of the curriculum, which is defined as the functions or activities that are used to engage students with the material. Cognitive demand involves the determination of the level or degree to which students will interact with the material. Will students memorize facts or will they be asked to apply and interpret the knowledge gained? Fourth is the mode of presentation or the pedagogy used to deliver the material.2
In order to be able to use these conceptions and dimensions of curriculum for accountability and improvement purposes, a tool that effectively represents the ideas is necessary. Curricular mapping is such a tool. A curricular map is an assessment tool that provides a visual and spatial representation of selected curricular elements.3 Curricular maps can be used in programmatic assessment to help capture the elements of a curriculum in a way that helps visualize the curriculum, thus providing a basis of curricular analysis that can be used as input for the creation of improvement strategies. Maps can provide data to determine curricular issues such as gaps or overlaps of learning outcomes or content, and they can also be used to track curricular changes over time. Essentially each of the dimensions of curriculum described could be represented in a curricular map to both document the curriculum and to determine concordance between curricular elements. For example, a curricular map could be used to document which teaching techniques are being used and to determine the concordance between the intended and enacted curriculum. Plaza et al reviewed the use of curricular maps in health professions education and presented a method of curricular mapping and its potential use in program-level assessment for pharmacy.4
Curricular mapping is listed in the current ACPE Standards as a required element of program-level assessment. Standard 12 specifically requires a map linking curriculum to expected outcomes and competencies. This map could be valuable in showing concordance between the intended curriculum and the enacted curriculum. The intended curriculum can be represented by the program-level ability-based outcomes (ABOs) and the enacted curriculum by the courses. For a discussion of writing outcomes, please see Kelley et al.5 Standard 13 requires programs to show how their curricular content aligns with the content listed in Appendix B of Standards 2007 (again, intended curriculum linked to enacted curriculum). Any of the 4 conceptions of curriculum could be linked by selecting appropriate indicators. For example, by linking ability-based assessments to PharmD program-level ABOs, we could demonstrate that our degree programs are actually succeeding in training our students to perform the abilities of a recent PharmD graduate.
The curricular mapping process can also be used to help programs illustrate or document other Standards-related requirements. For example, Standard 11 requires that faculty members use a variety of teaching and learning techniques in the delivery of the curriculum. Standard 10 asks for documentation of the application and reinforcement of curricular content and the documentation of faculty awareness of the content, depth, and methodologies used across the curriculum and their relationship to program-level outcomes.6 All of these curricular elements could be captured, codified, and represented using a curricular map.
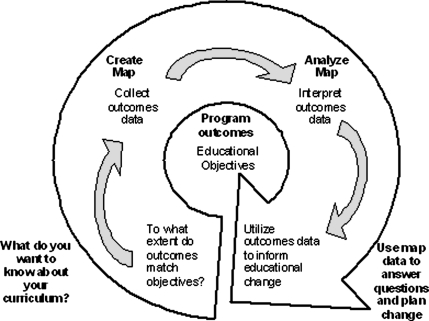
Ideally, the process of curricular mapping should be used not only to satisfy accountability requirements, ie, ACPE requirements, but also to inform curricular change and improvement. Figure 2 presents an elegant and simple original assessment loop on which the activities of curricular mapping have been overlaid to show their congruence with the original concept.3 This diagram illustrates the essential point that in order for the efforts of mapping to make a difference in the outcomes of student learning, the data collected and mapped must be used to inform change at the program and course level. Therefore, the goal of mapping should not stop at completing the task simply to comply with Standards 2007. Instead, mapping should be undertaken with the intention of gathering meaningful local data to be used for curricular reform efforts, thus providing a data driven mechanism for informing program changes. The remainder of this manuscript will provide information on the design and implementation of a mapping process, as well as a description or “case study” of how one college of pharmacy accomplished the mapping of its PharmD curriculum.
Figure 2.
Maki's Original Assessment Loop3 with the Mapping Loop overlaid in bold. Reprinted with permission. Copyright 2004, Stylus Publishing, LLC. Reproduced from Maki PL. Assessing for Learning: Building a Sustainable Commitment Across the Institution. Sterling, VA. Stylus Publishing LLC; 2001.
PHASES OF THE MAPPING PROCESS
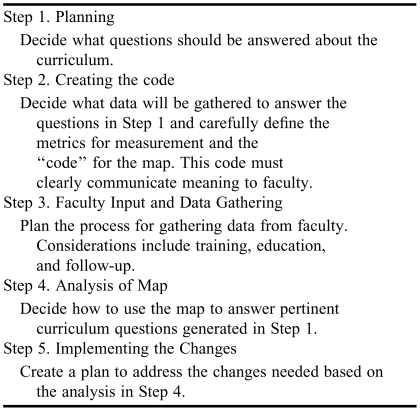
There are 5 general steps to consider when embarking on the process of mapping a curriculum (Table 1). Unless planning is adequate, the correct questions are asked, and the correct metrics are used, the data collected may not prove useful for continuous improvement of the curriculum.
Table 1.
Phases of the Curricular Mapping Process
Planning
Faculty members often have hunches or gut feelings about potential areas for improvement of the curriculum, and a map can help provide data to confirm or refute these hypotheses. For example, faculty members may feel that the first year of the curriculum is too dense with courses/content and produces a stressful learning environment for students. The map could help quantify and visually represent how much of the content is delivered in the first professional year (P1). In this case, the question might be something like “What percentage of the professional outcomes (or content) are addressed in the first year of the curriculum?” An important consideration in this step of creating the curricular questions is addressing any required (accreditation-related) questions. For example, “what types of teaching and learning strategies are used in the delivery of the curriculum?”
In terms of accomplishing Step 1, there are a few administrative details that are also helpful to consider. Often, the task of mapping the curriculum falls to an assessment or curriculum committee comprised of a representative sample of program faculty members. This large group may be less efficient when it comes to drafting the actual methods to be used or questions to be addressed. A more optimal plan is to have a subcommittee charged to draft pressing questions and present them to the larger group for input. Allowing sufficient time for discussion at full committee meetings is necessary. These committee meeting discussions can be quite productive and informative. Something as seemingly minor as all members using the same terminology with a shared understanding of each term's meaning is vital. The thoughts and ideas from the subcommittee become more refined as this iterative process unfolds in the larger committee. In order to facilitate continual progress, assigning “homework” to committee members that must be completed prior to the next meeting is another useful strategy to keep the project moving forward. Another consideration is to maintain a consistent committee membership as much as possible. When there is a high turnover in committee members from year to year, the committee tends to lose the “history” of projects in process, thus negatively impacting overall progress. For example, a 2-year faculty-member commitment to the committee works much better than a 1-year commitment.
Another administrative consideration is how much of the curriculum will be mapped. For example, if elective courses form a small portion of the overall program, and if there is no consistency to the electives taken by students, it may not make sense to map elective courses. If a program consists of multiple pathways that students may select, the map could be useful in evaluating whether the outcomes of each pathway are similar for all students.
Creating the Code
Once the curriculum committee has developed the questions, Step 2 consists of identifying the right metrics for the data gathering phase. For each question generated in Step 1, a metric as well as a method for codifying that information must be determined. These metrics and codes must be carefully and consistently defined so that they can be easily communicated to all faculty members who teach in the curriculum. As such, creating the codes or metrics for curricular mapping is a critical step.
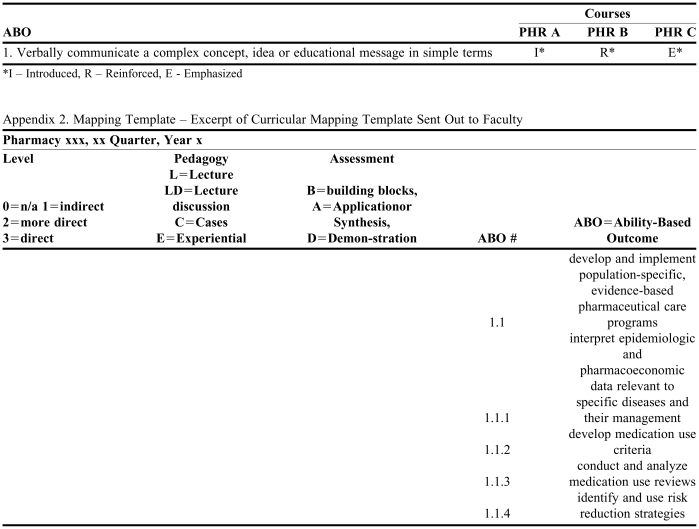
As an example, Rx University wants to know where their program-level outcomes are delivered in the curriculum and to what extent or degree these outcomes are covered. One way to approach this would be to determine a metric for the extent to which an outcome is covered in each course in the curriculum. One such metric could be a 3-level scale of introduced, reinforced, and emphasized. For each of these 3 levels, the curriculum committee should determine a consistent definition to be used (communicated) throughout the mapping process. These consistent definitions are important for maintaining interrater reliability among the faculty members who will be mapping the outcomes (or content) to their courses, ie, introduced should mean the same thing to Dr. Smith as it does to Dr. Jones. A visual sample of this code is presented in Appendix 1.
Once the metrics are determined and the coding decided, conducting a “pilot study” can be helpful. Assigning a few committee members the task of mapping their own courses using the developed metrics and codes can yield useful insights into the process. These committee members can then inform changes to the process prior to the larger data-gathering phase.
At this stage of the process, the curriculum committee must understand that their work is not done once the methods are developed for gathering the data. The creation of the data collection methods are important, but the entire process depicted in Figure 2 must be completed for curricular mapping to yield results that can improve the program.
Faculty Input and Data Gathering
Step 3 of the mapping process includes the generation of the data-gathering process, including any necessary training or follow-up. During this phase, the curriculum committee should consider how best to gather the information described in Step 2. Are the mapping process and code clear enough to send a paper or electronic survey instrument to faculty members to use in gathering the data? Is it necessary to conduct faculty workshops or training before embarking on a mapping process with the entire faculty? How will this training occur? Will it occur at faculty retreats, in small groups such as within departments or divisions, or by course sequences? Who will be asked to participate? Depending on the structure and delivery of courses, it may make sense to limit participation to course directors. No matter which approach is chosen, an important point to consider is that the code needs to be explained clearly or defined for those who are completing the mapping process. The “pilot data” gathered in Step 2 can be used as examples. In addition, training or instructions should also point out exactly how the data will be used. Assurances should be made that the data are for improvement purposes and not for reassignment of teaching responsibilities or placing blame for overlap or gaps.
A follow-up should be planned once the first set of data is obtained. For example, if there are “team-taught” courses, suggest that each faculty member complete a map for that course individually. Be sure to tell the faculty member that “comparing notes” with others who teach in the same course sequences should be done only after all the data are collected.
Analysis of Map
In Step 4, the data are compiled and depicted in a format that can be shared with members of the curriculum committee. An electronic spreadsheet can be helpful during this stage. At this point, the questions generated in Step 1 should be considered as the entire map is reviewed. Devoting an entire committee meeting to “poring over the data” is a good idea. Soon thereafter, it is important to reconnect with the faculty and share the first draft of the curricular map with them for discussion and identification of potential findings from the analysis, eg, overlap and/or gaps. If small groups of faculty members were assembled for training for mapping, these same groups can be reconvened for data discussions. Both the committee discussion and faculty discussions should result in a list of action items.
Implementing the Changes
Once the answers to the curricular questions have been identified and a list of actions has been generated, it is time to create a plan for the implementation of curricular change. Planning for the implementation of changes or improvements to the curriculum ensures that the map is part of a process of continuous curricular improvement and not simply an exercise in data gathering. The committee should, in consultation with the faculty participants, develop the implementation plan for any necessary or desirable curricular changes.
CASE STUDY
During the academic year 2006-2007, the College of Pharmacy at The Ohio State University created and analyzed a map of the PharmD curriculum. We undertook this with the intent to answer the following questions: Does the curriculum cover all of the ABOs determined necessary for an entry-level generalist pharmacist? Which courses contribute to the accomplishment of each of the outcomes? To what extent do particular courses contribute to a particular outcome? What teaching methods are used in each course? How do we measure what students learn relative to each of these outcomes?
For purposes of coding, we organized these questions into 3 groups: (1) location and degree: where and to what extent or level the outcomes are taught in the curriculum; (2) pedagogy: how outcome is taught; and (3) assessment: how the outcome is evaluated. Within each of these 3 groups, several value levels were identified. These value levels became the “code” for the map.
Within the location and degree group, the following values were defined/established:
Level 0, where there is no relationship between the course and the ABO;
Level 1, where there is an indirect relationship between the course and the outcome. In this case, the outcome itself is not the focus of the course; but at least one element of the course serves as a building block to the achievement of the final outcome;
Level 2, where a more direct relationship exists between the course and the outcome. A mixture of course elements support the final achievement of the outcome, but the final integration of the knowledge, skills, and attitudes necessary for its achievement is not accomplished in this course;
Level 3, where a direct relationship exists between the course and the outcome. At least one element of the course focuses specifically on the complex integration of knowledge, skills and attitudes necessary to perform the outcome.
Within the pedagogy group, the following values were defined/established: lecture; lecture/discussion; cases, which is any type of problem-based learning or learning applied to realistic scenarios; experiential, which is the actual practice of the outcome in a real or simulated environment; independent study, where students were required to learn material on their own outside of class but were tested as part of the course.
Within the assessments group, the following values were defined/established: building blocks, where students are assessed primarily on recall of information rather than ability to apply or synthesize that knowledge, skill, and/or attitude; application or synthesis, where students are assessed on their ability to apply and synthesize knowledge, skill, and/or attitude; performance, where students are assessed based on their ability to perform the knowledge, skill, and/or attitude.
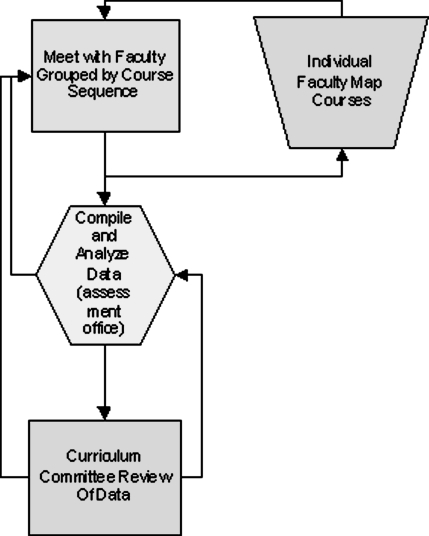
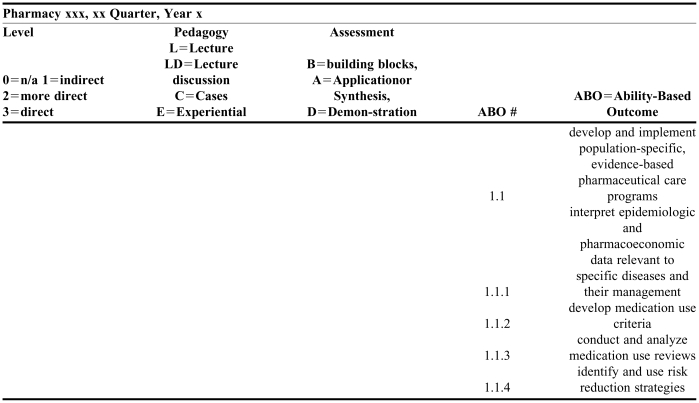
In order to complete the mapping process efficiently and provide adequate and consistent instruction to faculty members on how to map their courses, faculty members were assembled in groups according to the sequence in which they teach. For example, all of the faculty members teaching the 6 pharmacology courses met together to review the program-level ABOs and review the definitions of the levels on the mapping code. Faculty members were then asked to independently map their courses to the ABOs and submit these maps to the director of assessment. For each course, the instructor was provided with a sheet containing a list of each outcome followed by 3 columns, 1 for each assessment unit or coded element. For each outcome, the instructor was asked to provide the appropriate value level for each of the 3 assessment units. Once data for individual courses were obtained, the assessment director met a second time with the faculty groups described above. At the second meeting, an overview of individual responses was provided, and a discussion of the course sequence and the draft map ensued. Instructors then reevaluated their answers based on the input gathered as a group. Figure 3 presents a flowchart of the process of faculty member involvement in the generation of curricular mapping data and Appendix 2 is an excerpt of the data gathering template that was sent out to faculty members.
The data were then entered into an Excel file. As the spreadsheet contained approximately 15,000 data points (approximately 50 courses × 100 outcomes × 3 units of assessment), a mechanism for extracting meaningful information was required.
After studying and analyzing the data both by course sequence and by year in the program, several themes were readily discerned. For us, an informative analysis consisted of looking across the curriculum at each outcome from the first year to the fourth year. This showed that, in general, the level of coverage of the outcomes increased from early in the curriculum until late in the curriculum. In other words there was a logical progression of the curriculum from the first year through the fourth year. Another outcome of the analysis was the confirmation that all of our stated ABOs were covered somewhere in the curriculum. Looking at courses associated with accomplishing particular outcomes also allowed us to determine which courses had some affinity for one another in terms of coverage of ABOs.
The Curriculum Committee was able to use the data provided in the curricular map in conjunction with other assessment tools such as student surveys to identify 4 areas of focus for curricular improvement. These 4 areas or themes were: the distribution of common themes across the curriculum (ie, communication skills, drug information skills, professionalism); progression or building of competency across the curriculum (beginner to intermediate to advanced) in preparation for the final clinical year of training; identification of gaps or overlaps of coverage; and the degree of logical distribution of the curriculum (ie, were there pockets of intensity that could be more evenly distributed?)
The 4 areas identified by analysis of the map now form the basis for formulating plans for short-term curricular revision. The identified themes were assigned to 4 different working groups (all are members of the Curriculum Committee) who are meeting and designing suggested strategies to address the issues. These plans will be vetted by the entire Curriculum Committee and then voted upon by the College faculty. For example, the group responsible for addressing gaps is making recommendations for how and where it makes sense to add the missing elements into the curriculum.
An important limitation of a curricular map linking ABOs to courses is that it cannot reveal detailed information about the content that is delivered in the curriculum. For example, it is impossible to determine from this map whether a pharmacology sequence covers all classes of drugs and all medications for which an entry-level pharmacist is expected to have some knowledge. Furthermore, this map does not reveal the extent of overlap or redundancy that might be observed in material covered in courses in medicinal chemistry, pharmacology, and/or therapeutics. However, by combining the ABO map with a map of the required content (as specified in ACPE Standards 2007, Appendix B) linked to the courses of the curriculum, the limitation is easily remedied. In fact, Standards 2007 requires schools/colleges of pharmacy to create a map of Appendix B to the courses in a PharmD program. The process proposed here can be used to guide the creation of a map linking any of the described/desired curricular elements.
A carefully planned and executed curricular mapping process can yield a visual representation of the curriculum that serves as an assessment tool, fulfilling both accreditation requirements and informing curricular evaluation that may lead to change. When mapping outcomes to the courses in the curriculum, attention must be given to the process of mapping as well as how the gathered data will be used. Using the data collected in both the evaluation of the current curriculum and in the planning of curricular change yields a benefit that justifies the time and effort invested in the activity.
Mapping of the content of the curriculum (Standards 2007 Appendix B) has recently been completed at our College and added to the ABO map for analysis. In addition, the mapping data gathered as described here can be supplemented with student self-assessments of their ability to perform program-level ABOs, which adds another perspective to the faculty-driven mapping process described in this paper. Another potential project involves a determination of the impact of the curriculum on the practice or profession of pharmacy by combining an analysis of the map with input from program alumni. By asking alumni what they are doing with what they learned in the curriculum and combining this information with data in the map, an additional level of curricular analysis can be accomplished as depicted in Figure 1.
Figure 3.
Faculty involvement in the curriculum mapping process.
ACKNOWLEDGEMENTS
The authors would like to thank the College faculty members who participated in the mapping of the curriculum as part of the Curriculum or Program Committees and all of the faculty members who contributed by mapping their courses.
Appendix 1. Sample Curricular Map Depicting a Metric for Where an Outcome is Addressed in the Curriculum and to What Extent the Outcome is Covered in that Course
Appendix 2. Mapping Template – Excerpt of Curricular Mapping Template Sent Out to Faculty
REFERENCES
- 1.Ratcliff JL. What is a curriculum and what should it be? In: Gaff JG, Ratcliff JL, editors. Handbook of the Undergraduate Curriculum: A Comprehensive Guide To Purposes, Structures, Practices, And Change. 1st ed. San Francisco: Jossey-Bass Publishers; 1997. [Google Scholar]
- 2.Porter AC, Smithson JL. Defining, developing and using curriculum indicators. CRPE Research Report Series RR-048, Consortium for Policy Research in Education Philadelphia, PA; 2001
- 3.Maki PL. Assessing for Learning: Building a Sustainable Commitment across the Institution. Sterling, VA: Stylus Publishing LLC; 2001. [Google Scholar]
- 4.Plaza CM, Draugalis JR, Slack MK, Skrepnek GH, Sauer KA. Curriculum mapping in program assessment and evaluation. Am J Pharm Educ. 2007;71(2) doi: 10.5688/aj710220. Article 20. [DOI] [PMC free article] [PubMed] [Google Scholar]
- 5.Kelley KA, Coyle JD, McAuley JW, Wallace LJ, Buerki RA, Frank SG. Writing PharmD program-level, ability-based outcomes: Key elements for success. Am J Pharm Educ. 2008 doi: 10.5688/aj720598. [DOI] [PMC free article] [PubMed] [Google Scholar]
- 6.Accreditation Council for Pharmacy Education. Accreditation Standards and Guidelines for the Professional Program in Pharmacy Leading to the Doctor of Pharmacy Degree. The Accreditation Council for Pharmacy Education Inc. Available at: http://www.acpe-accredit.org/pdf/ACPE_Revised_PharmD_Standards_Adopted_Jan152006.pdf. Accessed on September 12, 2007.


