

Abstract
The cytosolic proteins PKCθ, Bcl10, and Malt1 play critical roles in T cell receptor (TCR) signaling to the transcription factor nuclear factor κB (NF-κB). Our data confirm that CD4+ T cells from PKCθ, Bcl10 and Malt1 knock-out mice show severe impairment of proliferation in response to TCR stimulation. Unexpectedly, we find that knock-out CD8+ T cells proliferate to a similar extent as wild-type cells in response to strong TCR signals, although a survival defect prevents their accumulation. Both CD4+ and CD8+ knock-out T cells express activation markers, including CD25, following TCR stimulation. Addition of exogenous interleukin-2 (IL-2) rescues survival of knock-out CD4+ and CD8+ T cells, but fails to overcome the proliferation defect of CD4+ T cells. CD4+ T cells from knock-out mice are extremely deficient in TCR-induced NF-κB activation, whereas NF-κB activation is only partially impaired in CD8+ T cells. Overall, our results suggest that defects in TCR signaling through PKCθ, Bcl10 and Malt1 predominantly impair NF-κB activation and downstream functional responses of CD4+ T cells. In contrast, CD8+ T cells maintain substantial NF-κB signaling, implying the existence of a significant TCR-regulated NF-κB activation pathway in CD8+ T cells that is independent of PKCθ, Bcl10 and Malt1.
Keywords: T cells, transcription factors, cell activation, signal transduction, transgenic/knock-out mice, NF-κB, Bcl10, Malt1, PKCθ
Introduction
T cell activation is initiated when the T cell receptor (TCR) encounters cognate peptide:MHC displayed on the surface of an antigen presenting cell (APC). Engagement of the TCR initiates a series of signal transduction events that culminate in T cell proliferation and gain of effector functions. One of the key transcription factors activated during this process is NF-κB, which is a central regulator of numerous genes involved in T cell survival, proliferation, and effector function.
NF-κB activation is a tightly controlled process (reviewed in (1-3)). In the absence of stimulation, NF-κB is retained in the cytoplasm through its association with inhibitor of κB (IκB) proteins, an interaction that masks the nuclear localization sequence of NF-κB. Following TCR engagement, PKCθ, a novel protein kinase C enzyme, is activated and phosphorylates Carma1, a CARD-containing MAGUK protein (4, 5). Carma1 then associates with a pre-existing complex, consisting of the CARD protein Bcl10 and the caspase-like protein Malt1, to form the Carma1-Bcl10-Malt1 (CBM) complex (6-8). Through its association with TRAF6, Malt1 then effects K63-linked polyubiquitination of the regulatory γ-subunit of the IκB kinase (IKK) complex (9, 10). Caspase 8 is also required for IKK activation, both via stabilizing IKK interaction with Bcl10 and Malt1 (11) and via recruiting Bcl10 and Malt1 to lipid rafts (12). K63-ubiquitinated IKKγ serves as a docking site for the kinase TAK1, which phosphorylates and activates IKKβ (9). Activated IKKβ phosphorylates IκB, leading to its subsequent K48-linked polyubiquitination and proteasomal destruction (13). NF-κB then enters the nucleus, where it controls the transcription of target genes.
Mice deficient in PKCθ, Bcl10 and Malt1 have been generated and characterized (14-19). T cells from these knock-out animals exhibit very similar phenotypes, including impaired NF-κB activation, deficient IL-2 production, reduced expression of activation markers, and diminished cell proliferation in response to TCR ligation. Overall, these previous studies suggest that PKCθ-/-, Bcl10-/- and Malt1-/-, T cells are essentially non-functional. However, a more recent study has shown that PKCθ-/- mice are able to mount effective CD8+ T cell responses to some viral infections (20), challenging the model that T cells are non-functional in the absence of PKCθ, Bcl10 or Malt1. We have therefore re-examined the responses of these knock-out T cells, using more robust TCR stimulation than was employed in the original studies of these animals (14-19). Our results confirm previous findings demonstrating that the loss of PKCθ, Bcl10, or Malt1 severely impacts CD4+ T cell proliferation. Surprisingly, however, we find that under conditions of strong TCR stimulation, CD8+ T cells from knock-out mice proliferate to a similar extent as wild-type cells, although a survival defect limits their accumulation. Both CD4+ and CD8+ knock-out T cells upregulate CD25 and CD44 in response to strong TCR stimulation, but these cells are highly deficient in IL-2 production. Addition of exogenous IL-2 improves knock-out T cell survival, but does not restore knock-out CD4+ T cell proliferation. CD4+ T cells from knock-out mice fail to activate NF-κB in response to TCR ligation, whereas a subset of CD8+ T cells from these animals successfully activate NF-κB. Our results suggest that while CD4+ T cells are highly dependent on PKCθ, Bcl10, and Malt1 to fully activate NF-κB in response to TCR ligation, CD8+ T cells are able to utilize an uncharacterized parallel pathway to successfully activate NF-κB and drive T cell proliferation in the absence of these molecules.
Materials and Methods
Mice
Tissues were harvested from 6-10 wk old C57BL/6 (WT) mice (NCI; Frederick, MD); Bcl10-/- and Malt1-/- mice (16, 17) (provided by T. Mak, University of Toronto, Toronto, Canada); and PKCθ-/- mice (18) (provided by A. Kupfer, Johns Hopkins University School of Medicine, Baltimore, MD). Bcl10-/- and PKCθ-/- mice were backcrossed with C57BL/6 mice for at least 5 generations. For TCR transgenic experiments, tissues were harvested from 4-7 wk old OTII (21), HY (22), PKCθ-/- OTII and PKCθ-/- HY mice. All mouse experiments were approved by the USUHS IACUC.
T cell purification and culture
Lymph nodes were collected in ice-cold HBSS and passed through a 70 μM cell strainer to create a single cell suspension. T cells were isolated by negative selection, using biotinylated antibodies to B220 (RA3-6B2), CD11b (M1/70), FCγR (2.4G2), and MHCII (KH74), followed by incubation and separation with streptavidin-coated magnetic beads (Dynal), resulting in T cell purities of 95-98%. To purify CD4+ T cells, biotin anti-CD8 (53-6.7; BioLegend) was added to the above antibody combination, resulting in CD4+ purities of 98% or greater. To purify CD8+ T cells, biotin anti-CD4 (GK1.5) was added, resulting in CD8+ purities of 94% or greater. Cells were rested for an average of 2.5 h (range: 1 h 45 min to 4 h) before plating by incubation in EHAA media. For some experiments, cells were rested in EHAA media supplemented with 5 ng/mL rmIL-7 (Fig.1A, C, D, E; Fig. 6C-F). T cell cultures received 1 μg/mL αCD28 (37.51; BD Pharmingen) unless otherwise indicated.
Figure 1. CD4+ T cells from PKCθ-/-, Bcl10-/-, and Malt1-/- mice fail to proliferate in response to TCR stimulation.
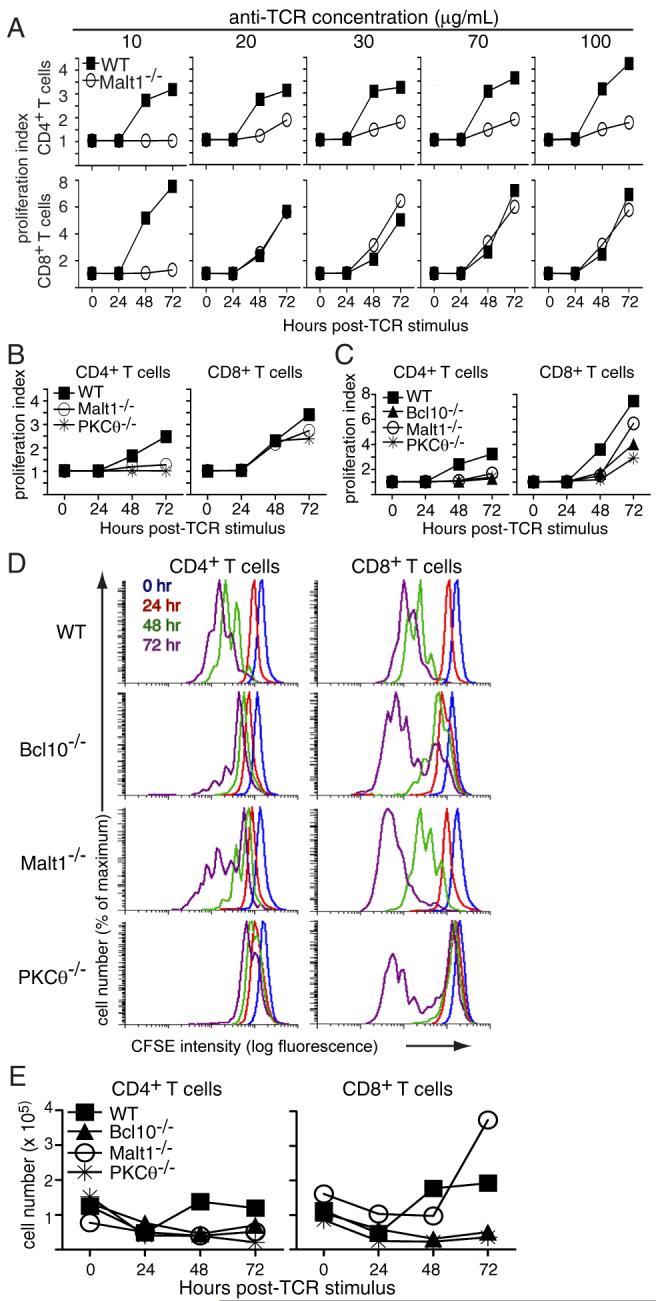
Purified T cells from the indicated strains of mice were labeled with CFSE and stimulated with plate-bound anti-TCRβ at (A) the indicated concentrations; (B) 100 μg/mL; and (C) 30 μg/mL. Proliferation was assessed every 24 h by flow cytometry. (D) Primary CFSE histogram data from the experiment shown in (C). Overlays show the dilution of CFSE in CD4+ and CD8+ T cells over time. (E) Total numbers of live T cells from the experiment in (C) were quantified by Trypan Blue staining. Data in panel A are representative of 2 experiments performed at similar doses of anti-TCRβ stimulation, while data in panels B-E are representative of 4 experiments performed with 30-100 μg/mL anti-TCRβ stimulation.
Figure 6. Differential IκBα phosphorylation in CD4+ and CD8+ T cells from PKCθ-/-, Bcl10-/-, and Malt1-/- mice.

(A) Western blots of whole cell lysates prepared from WT and PKCθ-/- T cells stimulated with the indicated concentrations of plate-bound anti-CD3ε plus soluble anti-CD28 (1 μg/mL). Data are representative of 2 experiments. (B) Validation of the phospho-IκBα flow assay. Purified WT T cells were stimulated with 100 μg/mL plate-bound anti-TCRβ plus 1 μg/mL soluble anti-CD28. Media, DMSO, or IKK inhibitors 82 (BAY 117-7082) or 85 (BAY 11-7085) were added after 48 h, and cells were harvested at 30 min and 2 h. Phospho-IκBα levels were assessed as described in Materials and Methods. Data are representative of 3 experiments. (C-E) Intracellular FACS analysis of phospho-IκBα. Purified T cells from the indicated strains of mice were stimulated with (C) 100 μg/mL plate-bound anti-TCRβ plus 1 μg/mL soluble anti-CD28, (D) 100 μg/mL plate-bound anti-TCRβ, or (E) 30 μg/mL plate-bound anti-TCRβ plus 1 μg/mL soluble anti-CD28. Error bars in (C) indicate standard deviation of data from 3 parallel samples from 3 mice. Data in (D) are representative of 3 experiments. Data in (E) are representative of at least 3 experiments per phenotype performed between 30-100 anti-TCRβ. (F) Primary histogram data from stimulation experiment in (E), showing 0 h (no fill) and 48 h (grey fill) post-TCR ligation. Dashed line indicates the peak level of IκBα phosphorylation at t=48 h in WT cells. (G) Primary histogram overlays showing phospho-IκBα levels in parent and divided CD8+ T cells at t=0 h (no fill) and t=48 h (grey fill) post-TCR ligation. (H) Quantification of phospho-IκBα levels in parent and divided CD8+ T cells. CFSE labeled cells were stimulated with the indicated concentration of anti-TCRβ. Parent and divided cells were identified using a similar gating strategy as in Fig. 5B, and phospho-IκBα levels were determined in each population.
T cell proliferation
A 96 well plate was coated overnight at 4°C with the indicated concentrations of anti-TCRβ (H597), followed by 6 washes with HBSS. Purified T cells were labeled with CFSE (1mM) and plated at a density of 3-4 × 10⁵ cells per well in 100-200 μL EHAA media (Invitrogen). At the indicated times, cells were stained with anti-CD4 APC (RM4-5; Caltag) and anti-CD8 PerCP (53-6.7; BD Pharmingen), and CFSE dilution was assessed by flow cytometry. In some experiments (Figs. 4 and 5), cells were supplemented with recombinant murine IL-2 (R&D Systems) at 2 ng/mL or 50 ng/mL after 24 hours of culture.
Figure 4. IL-2 fails to rescue knock-out CD4+ T cell proliferation.
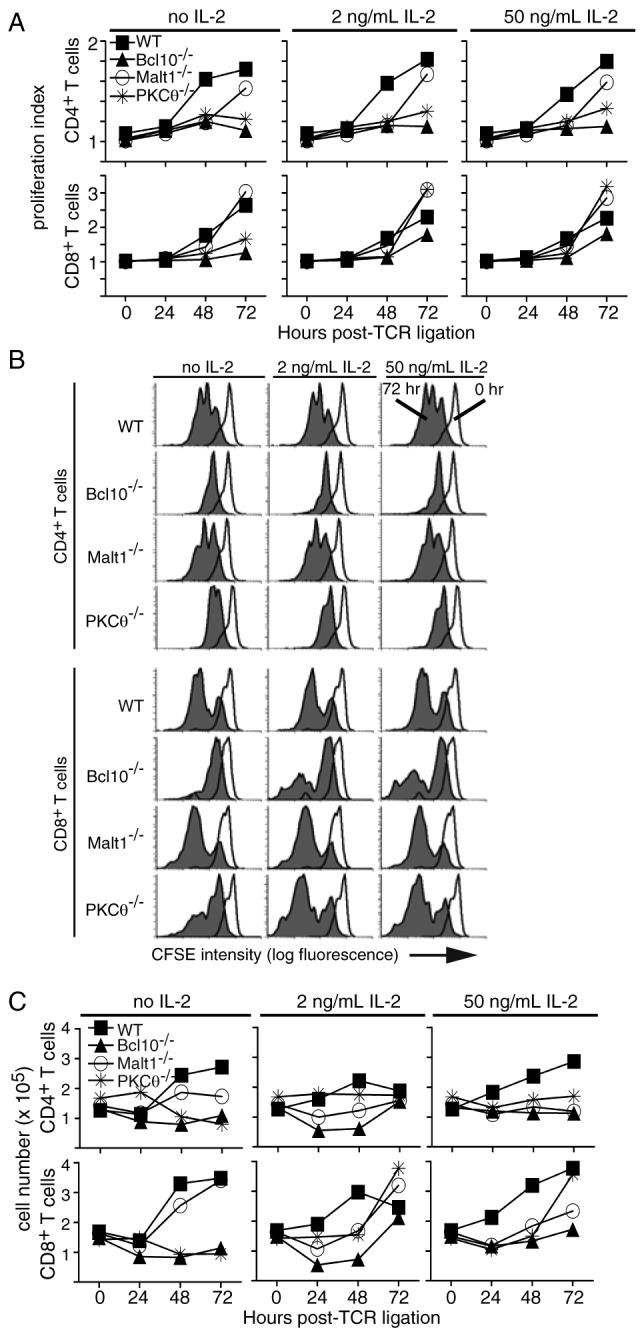
(A) CFSE-labeled T cells were stimulated with 30 μg/mL plate-bound anti-TCRβ and were supplemented with the indicated concentrations of recombinant murine IL-2 at t=24 h. Proliferation was assessed by FACS at the indicated times post-stimulation. (B) Primary CFSE histogram data from Figure 4A, showing the dilution of CFSE signal in CD4+ and CD8+ T cells at 0 and 72 h post-TCR ligation. (C) Total cell number data from Figure 4A. Cells were counted every 24 h, and live cell numbers determined by Trypan Blue staining. Data are representative of 2 experiments performed with 30-100 μg/mL anti-TCRβ and 1-50 ng/mL rmIL-2.
Figure 5. Ectopic IL-2 improves knock-out CD8+ T cell survival.
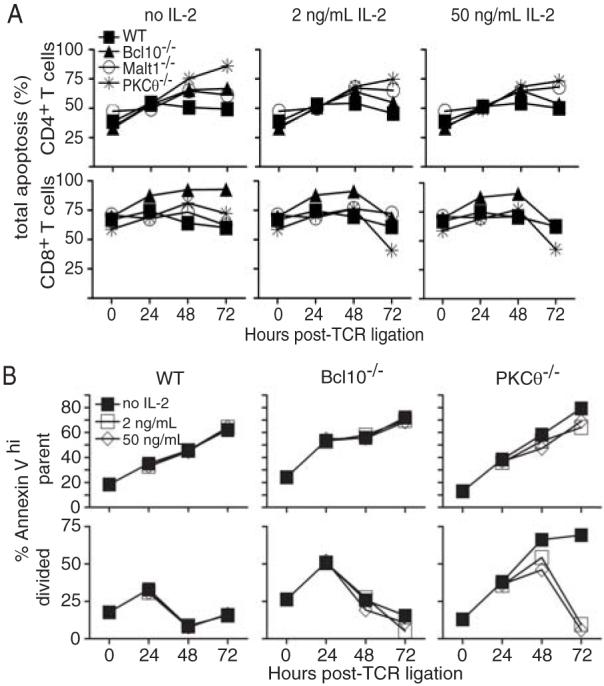
(A) T cells from the experiment in Fig. 4A were stained with anti-CD4 and anti-CD8 antibodies and with PI and Hoechst 33342 to measure apoptosis. Data are representative of 2 experiments performed with 30-100 μg/mL anti-TCRβ and 1-50 ng/mL rmIL-2. (B) Quantification of apoptosis in parent (undivided) and divided CD8+ T cells from WT, PKCθ-/-, and Bcl10-/- mice in the presence or absence of exogenous IL-2. A second experiment using PI to quantify apoptotic cells yielded highly similar results.
For assessment of antigen-stimulated proliferation, C57BL/6 splenocytes were treated with mitomycin C (40 μg/mL), and 1 × 10⁵ cells were plated in a 96-well plate. Lymphocytes were isolated from OTII or HY TCR-transgenic mice, labeled with CFSE, and 4 × 10⁵ lymphocytes were cultured with peptide-pulsed splenocytes. Wild-type ovalbumin (OVA) (325-339) (QAVHAAHAEINEAGR) or the OVA 331K (23) non-stimulatory (null) variant were used to stimulate OTII T cells, and SMCY (738-746) (KCSRNRQYL) or the null variant SMCY 743A (24) were used to stimulate HY T cells. Cells were harvested every 24 h and stained with anti-CD4 APC (RM4-5; Caltag) and anti-Vβ5 PE (MR9-4; BD Pharmingen) to identify OTII T cells, or with anti-CD8 Alexa 647 (53-6.7) and anti-Vβ8 PE (F23.1; BD Pharmingen) to identify HY T cells.
Flow cytometry was performed on a Beckman-Coulter LSRII, and data analysis was performed using WinList 5.0. The proliferation index for CFSE-labeled cells was calculated using ModFit software (Version 3.1, Service Pack 3) (Verity Software House).
Western blotting
Primary C57BL/6 or PKCθ-/- T cells were purified with Cellect T cell columns (Cedarlane), and stimulated with plate-bound anti-CD3ε plus soluble anti-CD28. Whole cell lysates were prepared on ice by direct lysis of cells and sonication in 1x Laemmli buffer. Protein lysates were separated by SDS-PAGE, and blotted onto nitrocellulose membranes. Proteins were detected by a monoclonal antibody against PKCθ (BD Pharmingen), and polyclonal antibodies against phospho-IκBα (Ser 32, Cell Signaling Technologies), cyclin E and actin (both from Santa Cruz Biotechnology). Proteins were detected by chemiluminescence using HRP-conjugated secondary antibodies, except for actin, which was detected by direct fluorescence of a Cy3-conjugated secondary antibody.
Phospho-IκBα staining
Stimulated T cells were harvested and stained with anti-CD4 PE (GK1.5; eBioscience) and anti-CD8 PerCP (53-6.7; BD Pharmingen). Cells were washed twice, fixed, and permeabilized. Phospho-IκBα was detected by overnight incubation at 4°C with a rabbit polyclonal antibody (Ser 32, Cell Signaling Technology), followed by 30 min incubation with Alexa 647 goat anti-rabbit IgG (Molecular Probes) and flow cytometry analysis. Experiments conducted with a rabbit monoclonal antibody to phospho-IκBα (Ser32, Cell Signaling Technology) yielded similar results. For experiments with IKK inhibitors, T cells were treated at 48 h post-TCR stimulation with 5 μg/mL of BAY-117082 or BAY-117085 (Calbiochem) in DMSO, or with an equivalent volume of DMSO or EHAA media. Cells were harvested after 30 min and 2 h, and phospho-IκBα was detected as described above.
Epifluorescence microscopy
Purified T cells were harvested every 24 h and stained with anti-CD4 Oregon Green (GK1.5) and anti-CD8 Alexa 647 (53-6.7). Cells were placed on poly-D-lysine coated coverslips, and incubated at 37° C for 5 min. Cells were fixed, permeabilized, blocked, and stained with rabbit anti-NF-κB p65 (C-20; Santa Cruz Biotechnology), followed by Alexa 555 goat anti-rabbit (Molecular Probes) and DAPI (Molecular Probes). Fluorescence images were collected and deconvolved using a Zeiss Axiovert 200M/TILL Photonics imaging system as previously described (25). Three deconvolved images, representing the approximate middle of the cell (0.9 μM crossection) were combined, using a maximal projection algorithm. Regions of interest were drawn in the nucleus and cytoplasm of cells (using DAPI staining to define the nucleus), and the mean pixel intensity calculated. After correcting for background fluorescence, the nuclear p65/cytoplasmic p65 ratio was calculated.
Analysis of apoptosis and cell surface markers
T cells were purified and divided into 2 populations. CFSE-labeled cells were plated on anti-TCRβ as described above, then harvested every 24 h and stained with anti-CD4 APC Cy7 (GK1.5; BD Pharmingen) and anti-CD8 Alexa 647 (53-6.7), followed by subsequent staining with Hoechst 33342 and propidium iodide (PI), according to the manufacturer’s instructions (Molecular Probes). Cells were analyzed by flow cytometry, and total apoptosis was calculated by adding the percentage of cells with loss of membrane integrity (PI bright) to the percentage of cells with sub-genomic DNA content (PI-excluding cells with <2n DNA content, as determined by Hoechst 33342 staining). High apoptosis at t=0 was consistent, and was due to cell death during the harvesting and purification procedures. All events were included in the FACS gating. For detection of cell surface markers, unlabeled T cells were plated on anti-TCRβ, harvested every 24 h and stained with anti-CD4 APC (RM4-5; Caltag), anti-CD8 Alexa 647 (53-6.7), anti-CD25 PE (PC61; BD Pharmingen) and anti-CD44 FITC (IM7; eBioscience).
Analysis of apoptosis in divided cells
T cells were purified, labeled with CFSE, and stimulated with 100 μg/mL plate-bound anti-TCRβ. After 24 h, rmIL-2 (R&D Systems) was added at 2 ng/mL and 50 ng/mL. Cells were harvested every 24 h, and stained with Annexin V - APC (BD Biosciences) according to the manufacturer’s instructions. CFSE dilution was assessed in CD8+ T cells, and the percentage of Annexin Vhi cells in the parent and divided cell populations was determined.
IL-2 ELISA
ELISAs were performed using rat anti-mouse IL-2 capture antibody and biotinylated goat anti-mouse IL-2 detection antibody (R&D Systems). Data were analyzed using the MKASSAY program developed by J. Kappler.
Results
CD4+ T cells from PKCθ-/-, Bcl10-/-, and Malt1-/- mice fail to proliferate in response to TCR stimulation
To assess the proliferative capacity of CD4+ and CD8+ T cells from wild-type (WT), PKCθ-/-, Bcl10-/-, and Malt1-/- mice under conditions simulating a strong antigen signal, purified T cells were labeled with CFSE and stimulated with 10-100 μg/mL plate-bound anti-TCRβ. As shown in Figure 1A, CD4+ T cells from Malt1-/- mice show little to no proliferation in response to a range of anti-TCRβ concentrations, while WT CD4+ T cells show modest proliferation in response to the lowest tested doses of anti-TCRβ (10 and 20 μg/mL), and robust proliferation in response to higher concentrations of plate-bound anti-TCRβ (30-100 μg/mL). Surprisingly, while Malt1-/- CD8+ T cells did not proliferate in response to the lowest concentration of anti-TCRβ (10 μg/mL), these cells exhibited WT levels of proliferation in response to all other concentrations of anti-TCRβ (20 -100 μg/mL).
To determine if these proliferative differences could also be generalized to T cells from PKCθ-/- and Bcl10-/- mice, we stimulated PKCθ-/- and Bcl10-/- T cells with plate-bound anti-TCRβ and examined proliferation, relative to WT T cells. Consistent with the response of Malt1-/- cells, CD4+ T cells from PKCθ-/- mice showed little to no proliferation following anti-TCRβ stimulation, while PKCθ-/- CD8+ T cells proliferated to almost the same extent as WT cells (Fig. 1B). In a side-by-side comparison of proliferation, CD4+ T cells from PKCθ-/-, Bcl10-/-, and Malt1-/- mice exhibited a strong proliferative defect, relative to WT cells, following TCR ligation. In contrast, CD8+ T cells from these animals proliferated modestly, although not as well as WT cells in this experiment (Fig. 1C). Interestingly, there was a gradation of proliferative responses among the knock-out CD8+ T cells, with Malt1-/- CD8+ T cells proliferating to a greater extent than Bcl10-/- CD8+ T cells, and PKCθ-/- CD8+ T cells showing the least robust proliferation.
Examination of the primary CFSE data (Fig. 1D) revealed that the proliferating PKCθ-/-, Bcl10-/-, and Malt1-/- CD8+ T cells generally underwent as many divisions as the WT CD8+ T cells. However, in contrast to WT cells, there was also a significant population of CD8+ T cells from the knock-out animals that did not divide at all. In contrast, CD4+ T cells from PKCθ-/-, Bcl10-/-, and Malt1-/- mice not only had a larger population of cells that failed to divide, but they also divided fewer times than their WT counterparts. Once again, there was a gradation in the severity of the proliferative defect, with PKCθ-/- T cells being the most impaired and Malt1-/- T cells being the least impaired.
Consistent with the proliferation data, the number of live knock-out CD4+ T cells in culture declined over the course of 72 h (Fig. 1E). Interestingly, the number of live Bcl10-/- and PKCθ-/- CD8+ T cells in culture also declined during the experiment, suggesting that although these cells proliferate vigorously, they may have a survival defect. Notably, the CD8+ Malt1-/- T cells showed a dramatic increase in total cell numbers between 48 and 72 h, demonstrating that these T cells successfully expand in culture, although with delayed kinetics. Overall, these data demonstrate that the loss of PKCθ, Bcl10, or Malt1 differentially affects the proliferation of CD4+ and CD8+ T cells, with CD4+ T cells being severely affected under all conditions of stimulation, whereas CD8+ T cells show little to no proliferative deficiency under conditions of strong stimulation through the TCR.
PKCθ is required for antigen-stimulated proliferation of CD4+, but not CD8+, T cells
To ensure that the results presented in Figure 1 did not reflect an artifact of using high levels of anti-TCRβ antibody for stimulation, we performed experiments employing peptide antigens presented by APCs. To examine antigen driven CD4+ T cell proliferation, lymphocytes from OVA-peptide specific OTII TCR transgenic or PKCθ-/- OTII TCR transgenic mice were purified and stimulated with splenocytes pulsed with a range of concentrations of OVA peptide. As shown in Figure 2, CD4+ T cells from PKCθ-/- OTII mice failed to proliferate in response to all tested concentrations of OVA, whereas OTII CD4+ T cells showed measurable proliferation at all doses of OVA, particularly at concentrations above 0.2 μg/mL. In contrast, an analogous comparison between HY TCR transgenic and PKCθ-/- HY TCR transgenic CD8+ T cells demonstrated that both HY and PKCθ-/- HY CD8+ T cells mice proliferated in response to all doses of the stimulatory SMCY peptide. Moreover, at concentrations above 1 μg/mL SMCY peptide, PKCθ-/- HY CD8+ T cells exhibited WT levels of proliferation (Fig. 2). These results confirm that the proliferative differences between knock-out CD4+ and CD8+ T cells are observed upon stimulation with a broad range of concentrations of peptide antigen. These data therefore strongly suggest that the differential proliferative responses of CD4+ and CD8+ T cells from PKCθ-/-, Bcl10-/-, and Malt1-/- mice are physiologically relevant.
Figure 2. Defects in PKCθ-/- CD4+ T cell proliferation in response to specific antigen stimulation.
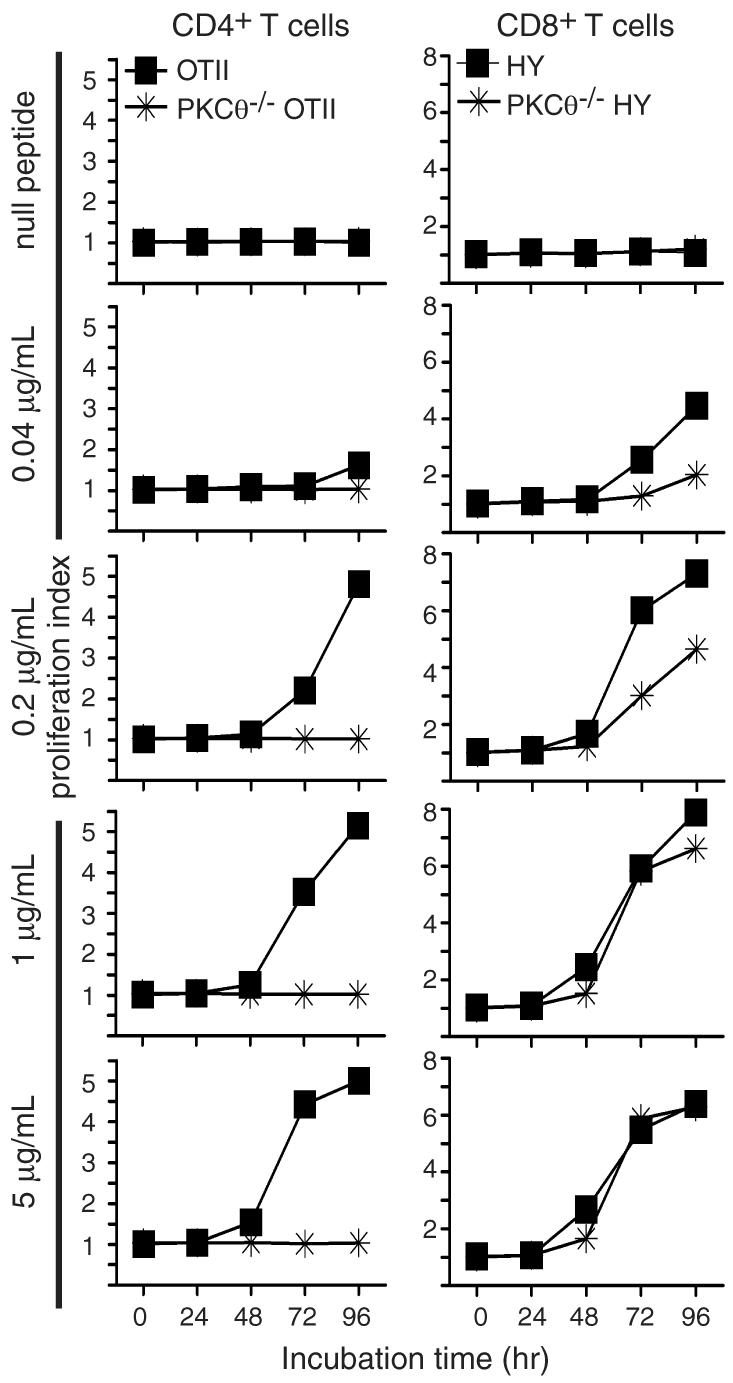
CFSE-labeled lymphocytes from the indicated strains of mice were incubated with mitomycin C-inactivated C57BL/6 splenocytes plus the indicated concentrations of stimulatory peptide or 5 μg/ml of a null variant. Proliferation was assessed at the indicated times by flow cytometry.
PKCθ, Bcl10 and Malt1 are required for IL-2 production, but not for expression of CD44 and CD25/IL-2Rα
Previously published studies demonstrated that PKCθ-/-, Bcl10-/-, and Malt1-/- T cells exhibit defective IL-2 production in response to TCR ligation (14-19). However, due to the substantial levels of knock-out CD8+ T cell proliferation observed with modest to strong TCR stimuli (Figs 1-2), we felt it was prudent to re-examine IL-2 production by T cells from these knock-out animals. Thus, WT, PKCθ-/-, and Malt1-/- T cells were stimulated with 100 μg/mL of plate-bound anti-TCRβ, and supernatants were harvested every 24 h for IL-2 ELISA. As shown in Figure 3A, WT T cells showed a robust production of IL-2 in response to TCR ligation. In contrast, T cells from PKCθ-/- and Malt1-/- mice produce a small amount of IL-2 (2-3 ng/mL) after 48 h of anti-TCRβ stimulation. IL-2 production by Bcl10-/- T cells was generally comparable to that of PKCθ-/- cells (data not shown). The low level of IL-2 secretion by Malt1-/- cells is consistent with previously published data (15), although the temporal kinetics of IL-2 production were not reported in that study. Separation of Malt1-/- T cells into CD4+ and CD8+ subsets revealed that both CD4+ and CD8+ T cells produce a measurable amount of IL-2, but CD4+ T cells made >10× more IL-2 than CD8+ T cells by 72 h post-TCR ligation (Fig. 3B). Similarly, WT CD4+ T cells produced substantially more IL-2 than WT CD8+ T cells. Consistent with the results shown in Fig 3A, WT cells produced much more IL-2 than MALT1-/- T cells. Overall, these results indicate that PKCθ-/-, Bcl10-/-, and Malt1-/- T cells are highly deficient in IL-2 production, even under conditions of very strong stimulation through the TCR. Furthermore, assuming that the data from MALT1-/- T cells (Fig. 3B) can be generalized, the deficiency in IL-2 production appears to affect CD4+ and CD8+ T cells to a similar degree.
Figure 3. PKCθ-/-, Bcl10-/-, and Malt1-/- T cells show defects in IL-2 production, but upregulate CD44 and CD25 after TCR ligation.
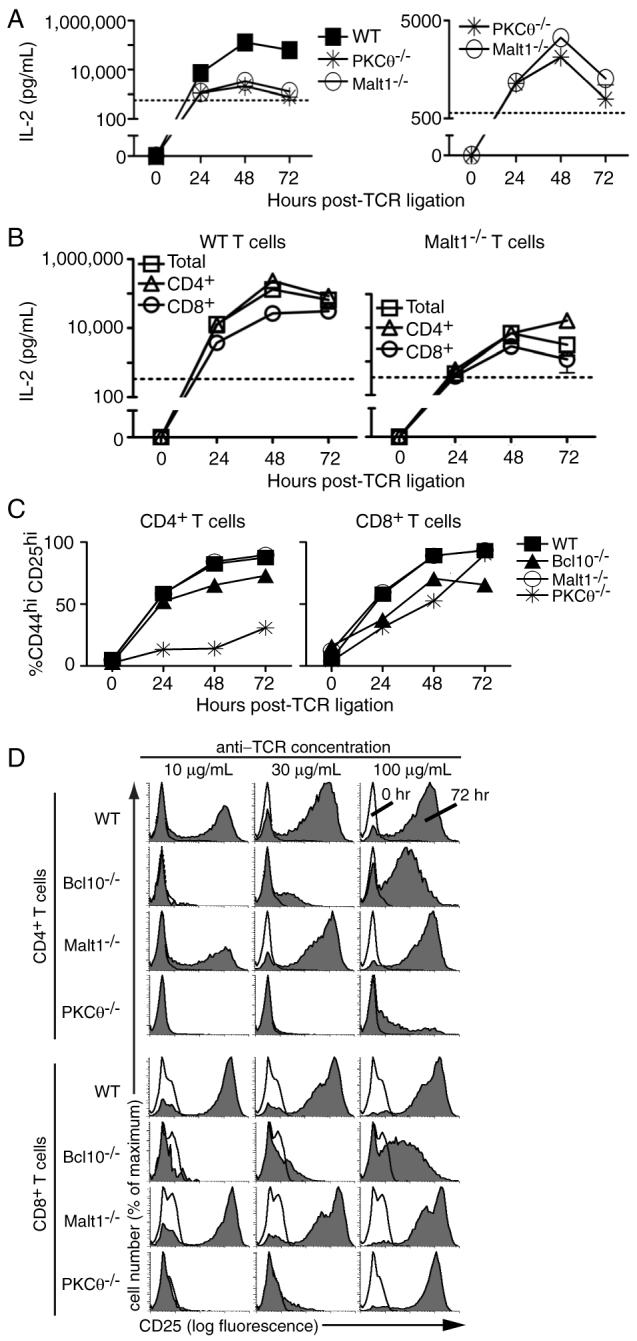
(A) IL-2 ELISAs of supernatants from T cells stimulated with 100 μg/mL of anti-TCRβ(detection limit=570 pg/mL). Data are representative of 3 experiments; bars indicate SEM. (B) IL-2 ELISAs of total T cells or purified CD4+ or CD8+ T cells from WT or Malt1-/- mice stimulated with 100 μg/mL anti-TCRβ (detection limit=340 pg/mL). Data are representative of 2 biological replicates; bars indicate SEM. (C) FACS analysis showing the percentage of CD4+ and CD8+ T cells upregulating both CD44 and CD25 in response to 100 μg/mL anti-TCRβ. Data are representative of 3 experiments at doses ranging from 10-100 μg/mL anti-TCRβ. (D) Cells were stimulated with the indicated concentrations of plate-bound anti-TCRβ and stained every 24 h with antibodies to CD25 and CD44. Histogram overlays show CD25 expression on CD4+ and CD8+ T cells at 0 and 72 h post-TCR ligation.
In addition to defects in IL-2 production, previous studies of PKCθ-/-, Bcl10-/-, and Malt1-/- T cells have shown impaired upregulation of cell surface activation markers, particularly CD25. To determine if the loss of PKCθ, Bcl10, or Malt1 negatively impacts CD44 and CD25 expression under conditions of robust TCR stimulation, T cells were stimulated with anti-TCRβ and the expression of CD44 and CD25 was analyzed over a period of 72 h. As shown in Figure 3C, CD4+ T cells from Malt1-/- and Bcl10-/- mice displayed strong upregulation of CD44 and CD25 expression after TCR ligation, while CD4+ T cells from PKCθ-/- mice increased CD44 and CD25 levels to a lesser extent. Interestingly, CD44 and CD25 expression on all knock-out CD8+ T cells approached WT levels under the highest levels of anti-TCRβ stimulation (100 μg/mL). We also examined the induction of CD25 expression in a dose-response experiment (Fig. 3D). At the two lower doses of anti-TCRβ stimulation (10 and 30 μg/mL), the expression of CD25 on the surface of PKCθ-/- and Bcl10-/- T cells was reduced compared to WT cells, and the expression of CD25 was only very weakly induced on CD4+ PKCθ-/- T cells at 100 μg/mL anti-TCRβ stimulation. In contrast, the TCR-stimulated expression of CD25 on Malt1-/- T cells was slightly reduced at 10 μg/mL anti-TCRβ (Malt1:WT CD25+ = 39%:49% and 71%:76%, for CD4+ and CD8+ T cells, respectively (Fig. 3D and data not shown)) and was essentially indistinguishable from WT T cells at the two higher stimulatory doses. These data show that loss of PKCθ, Bcl10, or Malt1 shifts the anti-TCR dose-response of CD25 expression (although the loss of Malt1 had only a small impact CD25 expression under the tested conditions). Overall, these results demonstrate that CD44 and CD25 are efficiently upregulated on CD4+ and CD8+ PKCθ-/-, Bcl10-/-, and Malt1-/- T cells, following strong stimulation through the TCR, with the exception of CD4+ T cells from PKCθ-/- mice, which show only a modest upregulation of these activation markers.
Ectopic IL-2 fails to rescue the proliferative defect of PKCθ-/-, Bcl10-/-, and Malt1-/- CD4+ T cells
The TCR-stimulated upregulation of CD25 on PKCθ-/-, Bcl10-/-, and Malt1-/- T cells suggested that these cells retain the ability to efficiently respond to IL-2, raising the possibility that the proliferative defect of knock-out CD4+ cells could be rescued by ectopic IL-2 under conditions of strong anti-TCR stimulation. To test this hypothesis, T cells were stimulated with anti-TCRβ and cultured with or without recombinant IL-2. Surprisingly, the addition of IL-2 did not have a substantial impact on the PKCθ-/-, Bcl10-/- or Malt1-/- CD4+ T cell proliferation index, regardless of the amount of IL-2 used to supplement the culture (2 or 50 ng/mL) (Fig. 4A). In contrast, the addition of IL-2 increased the proliferation index of Bcl10-/- CD8+ T cells to near WT levels by 72 h post-stimulation, while the proliferative index for PKCθ-/- CD8+ T cells exceeded WT levels at 72 h post-stimulation. Interestingly, the addition of exogenous IL-2 had little to no effect on the proliferation index of Malt1-/- CD8+ T cells. Consistent with these results, the total number of knock-out CD4+ T cells did not increase following the addition of 2 or 50 ng/mL ectopic IL-2, while the number of PKCθ-/-, Bcl10-/-, and Malt1-/- CD8+ T cells increased substantially following the addition of ectopic IL-2 (Fig. 4C). Overall, these data show that ectopic IL-2 does not rescue the proliferative defect of knock-out CD4+ T cells, but does increase the proliferative index and total number of CD8+ T cells from PKCθ-/- and Bcl10-/- mice.
IL-2 enhances survival of PKCθ-/-, Bcl10-/-, and Malt1-/- T cells
The data in Figure 4A demonstrated that ectopic IL-2 has a measurable effect on the proliferative index of CD8+ T cells from PKCθ-/- and Bcl10-/- mice. However, this effect could be the result of enhanced survival, enhanced proliferation or both. As shown above (Fig. 1E and Fig. 4C), enumeration of total live cells suggested that proliferating CD8+ T cells from knock-out mice have a survival defect, relative to WT T cells. Close examination of the primary CFSE data showed that the addition of ectopic IL-2 did not appear to increase the number of divisions that WT and knock-out CD8+ T cells undergo, but instead increased the number of divided cells (Fig. 4B), suggesting that ectopic IL-2 improved the survival of proliferating cells, but did not promote CD8+ T cell proliferation. To formally investigate this possibility, we examined the levels of apoptosis in PKCθ-/-, Bcl10-/-, and Malt1-/- T cells cultured with and without exogenous IL-2. Cells were harvested every 24 h after plating on anti-TCRβ-coated wells, and apoptosis was evaluated by staining with PI and Hoechst dyes, identifying cells with loss of membrane integrity and with sub-genomic (<2n) DNA content, respectively. As shown in Figure 5A, knock-out CD4+ and CD8+ T cells generally exhibited equivalent or higher levels of apoptosis than their wild-type counterparts at t=0 and at all time points post-TCR ligation. However, ectopic IL-2 clearly had a positive effect on PKCθ-/- and Bcl10-/- T cell survival, with PKCθ-/- CD8+ T cells showing the greatest reduction in apoptosis at 72 h post-stimulation. This effect was maximal at 2 ng/mL, as 50 ng/mL IL-2 resulted in the same improvement in knock-out T cell survival.
As an additional measure of survival, we directly examined apoptosis in divided and undivided CD8+ T cells in the presence or absence of ectopic IL-2. Annexin V staining was used to quantify apoptosis in parent and divided cell CD8+ T cell populations (Fig. 5B). This experiment demonstrated that undivided (parent) CD8+ T cells from WT mice showed higher levels of Annexin V staining compared to divided cells. Clearly, the addition of ectopic IL-2 did not appreciably improve the survival of divided or parent WT CD8+ T cells. In contrast, both undivided and divided CD8+ T cells from PKCθ-/- or Bcl10-/- mice showed very high levels of Annexin V staining, indicating high levels of apoptosis in both populations. The addition of 2 or 50 ng/mL ectopic IL-2 had little effect on the survival of undivided CD8+ PKCθ-/- or Bcl10-/- T cells, but dramatically improved the survival of divided cells from PKCθ-/- mice.
Overall, the data in Figures 4 and 5 demonstrate that the proliferative defect of PKCθ-/-, Bcl10-/-, and Malt1-/- CD4+ T cells is not the result of defective IL-2 production, since ectopic (or endogenous) IL-2 improved survival, but did not correct the proliferation defect. Thus, an IL-2-independent defect is responsible for the impaired proliferation of PKCθ-/-, Bcl10-/-, and Malt1-/- CD4+ T cells.
Residual TCR-mediated phosphorylation of IκBα in CD8+ T cells from PKCθ-/-, Bcl10-/-, and Malt1-/- mice
The above data demonstrated that TCR-stimulated proliferation and upregulation of activation markers was quite robust in CD8+ T cells, following modest to high levels of anti-TCRβ or antigen stimulation. Therefore, either PKCθ-/-, Bcl10-/-, and Malt1-/- CD8+ T cells retain some ability to activate NF-κB, or significant proliferation and upregulation of activation markers can occur in CD8+ T cells in the absence of NF-κB activation, under conditions of robust TCR stimulation. To distinguish between these possibilities, we first used western blotting to examine the kinetics of IκBα phosophorylation (an indicator of IKK activation) in WT versus PKCθ-/- T cells following TCR ligation. As shown in Figure 6A, WT T cells showed robust activation of NF-κB (indicated by the appearance of phospho-IκBα) in response to TCR ligation. Additionally, activation of NF-κB correlated well with proliferation, as indicated by expression of cyclin E. In contrast, PKCθ-/- T cells exhibited greatly reduced NF-κB activation after TCR ligation, with little to no NF-κB activation below 10 μg/mL anti-CD3ε stimulation. Interestingly, under the strongest conditions of anti-CD3ε stimulation (10-100 μg/mL), PKCθ-/- T cells showed clear NF-κB activation and proliferation/cyclin E expression, albeit less than wild-type cells. These data therefore demonstrated that PKCθ-/- T cells retain some capacity to activate the IKK complex and proliferate, especially under conditions of strong TCR/CD3 stimulation.
Based on the severe proliferative defect observed in CD4+ T cells from PKCθ-/-, Bcl10-/-, and Malt1-/- mice (Figs. 1-2), we hypothesized that CD8+ T cells accounted for the great majority of IκBα phosphorylation in total T cells from PKCθ-/- mice (Fig. 6A). To rigorously test this hypothesis, we developed a flow cytometry based assay to detect IκBα phosphorylation in individual CD4+ and CD8+ T cells. As shown in Figure 6B, stimulation of WT T cells with plate-bound anti-TCRβ antibody resulted in an increase in phospho-IκBα in both CD4+ and CD8+ T cells over the course of 48 h. To ensure that the increase in phospho-IκBα was due to activity of the IKK complex, we treated cells with the IKK inhibitors BAY11-7082 or BAY11-7085 at 48 h and harvested cells after 30 min and 2 h. As shown in Figure 6B, treatment of CD4+ and CD8+ T cells with IKK inhibitors decreased phospho-IκBα fluorescence to nearly undetectable levels as early as 30 min after the addition of the inhibitor. Although addition of DMSO or media also resulted in decreased phospho-IκBα levels, presumably due to disturbing T cell interactions with anti-TCR during pipetting, the magnitude of reduction was consistently modest in comparison with cells treated with the IKK inhibitors. The inhibitor data therefore provide strong evidence that the flow cytometry assay specifically detects IKK-dependent phosphorylation of IκBα.
As shown in Figures 6C-E, TCR stimulation of WT CD4+ T cells leads to a gradual increase in IκBα phosphorylation, with activation levels peaking at 48 h and declining at 72 h post-TCR ligation. In contrast, PKCθ-/-, Bcl10-/-, and Malt1-/- CD4+ T cells showed little to no NF-κB activation over the same time period. In the case of CD8+ T cells, the induction of IκBα phosphorylation in WT cells was more rapid, with a significant increase seen by 24 h post-TCRβ stimulation and declining activation by 72 h post-stimulation. Importantly, PKCθ-/-, Bcl10-/-, and Malt1-/- CD8+ T cells showed clear IκBα phosphorylation, but the kinetics of activation were delayed, with the response peaking at 48 h (Fig. 6C, D) or continuing to increase at 72 h (PKCθ-/- and Bcl10-/- CD8+ T cells; Fig. 6E).
Close examination of the primary flow cytometry data showed that the majority of WT CD4+ and CD8+ T cells phosphorylated IκBα following TCR ligation, as demonstrated by a clear shift in fluorescence intensity 48 h after TCR engagement (Fig. 6F). In contrast, CD4+ T cells from knock-out animals showed very little IκBα phosphorylation in the same time period, with a subset of cells increasing in fluorescence intensity, but never reaching WT levels. In the case of CD8+ T cells from PKCθ-/-, Bcl10-/-, and Malt1-/- animals, there was also a subset of cells that phosphorylated IκBα, but unlike the CD4+ T cells, the level of activation met or exceeded the levels observed in WT cells. In both cell types, a substantial proportion of cells showed little to no IκBα phosphorylation. These results are reminiscent of the proliferation data for knock-out CD8+ T cells, in which a proportion of CD8+ T cells from PKCθ-/-, Bcl10-/-, and Malt1-/- mice failed to divide, while a second population proliferated in a manner largely indistinguishable from WT cells, with the exception of a kinetic delay (Fig. 1D). Overall, these data strongly suggest that, in response to modest or strong signals through the TCR, the threshold for IKK-stimulated proliferation is met in a subset PKCθ-/-, Bcl10-/-, and Malt1-/- CD8+ T cells, whereas the threshold required for proliferation is not reached in knock-out CD4+ T cells.
To provide further evidence of a mechanistic connection between IKK activity and CD8+ T cell proliferation, we examined phospho-IκBα levels in parent (undivided) and divided populations in response to a range of anti-TCRβ stimulation. As shown in Figure 6G, there was a clear increase in phospho-IκBα levels in divided cells from WT, PKCθ-/- and Malt1-/- mice after 48 h of stimulation with 100 μg/mL anti-TCRβ. In contrast, parent cells showed a decrease in phospho-IκBα levels, indicating that non-proliferating cells undergo very little NF-κB activation. These data are further quantified in Figure 6H, which shows that in undivided WT cells, phospho-IκBα levels increased from 0 to 24 h following TCR ligation, regardless of the concentration of anti-TCRβ used to activate the cells. However, after 24 h, there was a steep decline in phospho-IκBα levels continuing through 72 h. In contrast, divided WT cells showed a steady increase in phospho-IκBα levels over the course of 48 h, followed by a plateau or a slight reduction in phospho-IκBα levels by 72 h. Consistent with and extending the data in Figure 6F, the levels of IκBα phosphorylation in the divided population of both PKCθ-/- and Malt1-/- CD8+ T cells were quite similar to and in some cases exceeded levels seen in WT cells. Overall, these data strongly suggest that those knock-out CD8+ T cells that achieve IKK activation successfully enter the cell cycle, whereas those cells that fail to activate IKK fail to proliferate and eventually apoptose.
To assess NF-κB activation events downstream of IκBα phosphorylation, we used epifluorescence microscopy to directly visualize TCR-stimulated translocation of the p65 (RelA) subunit of NF-κB to the nucleus of WT and PKCθ-/- T cells. As shown in Figures 7A and 7C, WT CD4+ and CD8+ T cells had little nuclear p65 at t=0 h, whereas a significant amount of p65 was localized to the nucleus by 24 h. Consistent with the phospho-IκBα data (Fig. 6 D-E), stimulated PKCθ-/- CD4+ T cells showed significantly less nuclear p65 compared to WT CD4+ T cells at 24 h and 48 h post-TCR ligation (Fig. 7B), and no significant increase in nuclear p65, compared to t=0 h. Interestingly, PKCθ-/- CD8+ T cells showed an increase in p65 over the course of 48 h, with nuclear p65 at 48 h equivalent to WT levels. However, although stimulated PKCθ-/- CD8+ T cells displayed increased nuclear p65, the maximal level of p65 nuclear translocation was greatly reduced compared to WT cells, representing a clear difference relative to the IκBα phosphorylation data. Thus, although PKCθ-/- CD8+ T cells activate NF-κB, they do so to a lesser extent that WT CD8+ T cells. Furthermore, the kinetics of p65 nuclear localization differed between the cell types, with peak WT CD8+ nuclear p65 levels occurring at 24 h, while PKCθ-/- CD8+ nuclear p65 levels peaked at 48 h (Fig. 7B-C).
Figure 7. PKCθ-/- T cells show defective p65 nuclear localization.
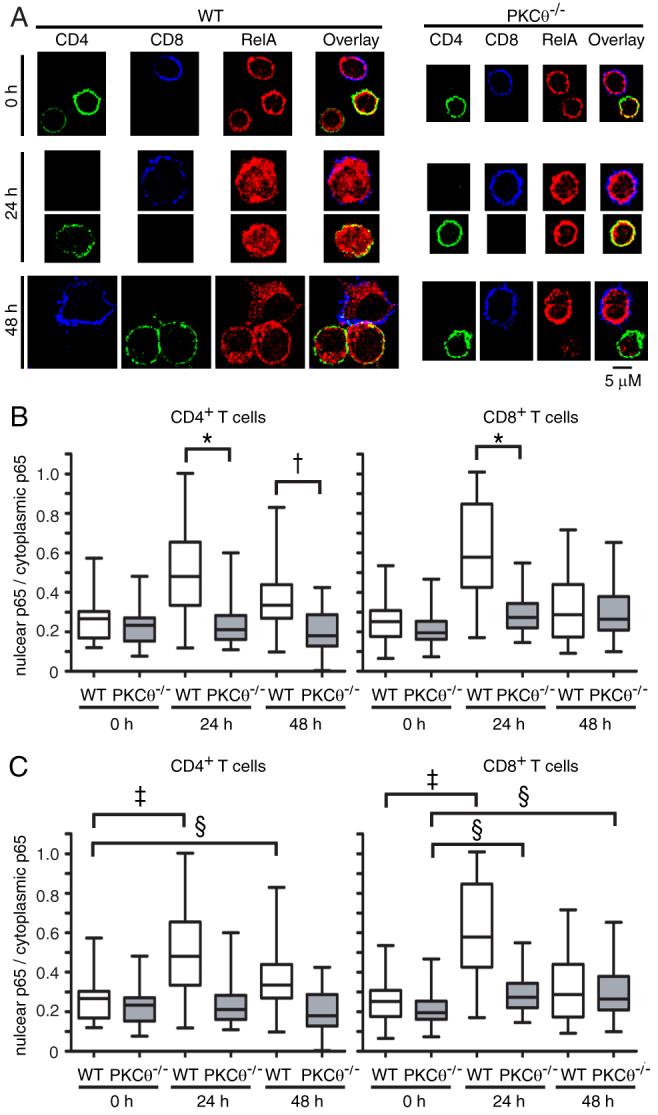
(A) Epifluorescence microscopy images showing nuclear localization of p65 (red) at 0 h, 24 h, and 48 h post-TCR ligation for WT and PKCθ-/- CD4+ (green) and CD8+ (blue) cells. (B and C) Quantification of levels of nuclear p65 relative to levels of cytoplasmic p65 at 0, 24, and 48 h post-TCR ligation for WT and PKCθ-/- CD4+ and CD8+ T cells. The box indicates the distribution of values around the median (solid line), while the whiskers indicate the highest and lowest value for each time point. The data analysis strategy is described in detail in Materials and Methods. For data analysis, approximately 30 images were analyzed for each genotype at each time point. Statistical comparisons between WT and PKCθ-/- and between time points are shown in (B) and (C), respectively. †p<0.0001, *p<0.0005, ‡p<0.01, §p<0.05.
Microscopic evaluation of the cells revealed that, overall, PKCθ-/- T cells remained much smaller than WT T cells after TCR ligation (Fig. 7A). However, PKCθ-/- CD8+ T cells were larger than PKCθ-/- CD4+ T cells at 24 and 48 h, consistent with the p65 translocation data (Fig. 7A-B and data not shown). Moreover, the levels of p65 in many PKCθ-/- CD4+ T cells declined substantially by 48 h, relative to PKCθ-/- CD8+ T cells and WT T cells (Fig. 7A), probably reflecting the high levels of apoptosis in PKCθ-/- CD4+ T cells (Fig. 5A and data not shown). Overall, these data indicate PKCθ-/- CD4+ T cells undergo little to no p65 nuclear translocation in comparison to WT cells. In contrast, PKCθ-/- CD8+ T cells show a reduced level of p65 translocation after TCR ligation, which occurs with delayed kinetics, compared to WT cells. The delayed kinetics of RelA nuclear translocation are consistent with the delayed onset of proliferation (Fig. 1D) and the delayed kinetics of IκBα phosphorylation (Fig. 6C-E) observed in PKCθ-/-, Bcl10-/-, and Malt1-/- CD8+ T cells.
Discussion
Our data strongly suggest that the proliferative defects of CD4+ T cells from PKCθ-/-, Bcl10-/-, and Malt1-/- mice are primarily due to a failure to activate NF-κB in response to TCR ligation. In contrast, PKCθ-/-, Bcl10-/-, and Malt1-/- CD8+ T cells retain some ability to activate NF-κB in response to modest-to-strong TCR stimuli, enabling a proportion of CD8+ T cells to proliferate. Thus, our data are consistent with a model in which CD8+ T cells possess a significant alternative NF-κB signaling pathway, which is activated by strong TCR stimulation and which is largely independent of PKCθ, Bcl10 and Malt1. Although this pathway also appears to exist in CD4+ T cells, it apparently does not reach the threshold of IKK activation required for significant nuclear translocation of NF-κB p65 and a concomitant proliferative response.
An additional unexpected finding was the observed gradation in the severity of the knock-out phenotypes, with Malt1-/- T cells showing the least impairment with regard to proliferation, IL-2 production, upregulation of cell surface activation markers and NF-κB activation. The defects in Bcl10-/- and PKCθ-/- T cells were more severe than defects observed in Malt1-/- T cells, with CD4+ T cells from PKCθ-/- mice generally showing the greatest deficits in NF-κB-dependent responses. The heightened severity of the phenotype in PKCθ-/- T cells may be due to additional TCR signaling defects outside of the NF-κB pathway, particularly impairment of NFAT and AP-1 activation (14, 18, 26). Additionally, the fact that Malt1-/- T cells have a milder activation deficit than Bcl10-/- T cells may reflect differences in the NF-κB complexes activated downstream of Bcl10 and Malt1. Specifically, a recent report (27) has shown that, whereas Bcl10 is required for activation of the NF-κB subunits, p65 (RelA) and c-Rel, Malt1 signals lead exclusively to activation of c-Rel. Although those studies examined NF-κB activation in B cells, we believe our data are suggestive that the same or similar signaling differences may also exist in T cells, and that this divergence in TCR activation of p65 and c-Rel may account for the substantial disparity in Bcl10-/- and Malt1-/- T cell activation phenotypes. However, further work will be required to show precisely how TCR-stimulated NF-κB activation via Malt1 differs from the NF-κB activation signals that are transduced through PKCθ and Bcl10.
Similar to previous studies of PKCθ-/- CD4+ (28) and CD8+ (29) T cells, we observed that PKCθ, Bcl10, and Malt1 are critical factors in T cell survival downstream of TCR signaling. Moreover, each of these proteins appears to play a particularly important role in promoting the survival of actively proliferating CD8+ T cells. Given that proliferating CD8+ T cells are rescued from apoptosis by ectopic IL-2 in PKCθ-/- and Bcl10-/- mice, our conclusion is that NF-κB-dependent production of IL-2 is a critical mediator of this survival signal. These observations are also important because they demonstrate that NF-κB dependent TCR-directed pro-proliferative and pro-survival signals are separable, with robust pro-proliferative signals occurring in CD8+ T cells from PKCθ-/-, Bcl10-/-, and Malt1-/- mice, despite the lack of production of IL-2. The occurrence in PKCθ-/- mice of productive anti-viral CD8+ T cell immune responses (20) may suggest that, in vivo, other survival factors (e.g., IL-7) functionally substitute for IL-2 in rescuing at least some CD8+ T cells from apoptosis. Given that our data show that IL-2 selectively promotes the survival of dividing PKCθ-/- CD8+ T cells, we speculate that, in vivo, only those antigen-stimulated cells that successfully enter the proliferative program gain the ability to respond to pro-survival factors such as IL-7.
Previous studies of CD4+ and CD8+ proliferation have shown that CD8+ T cells commit to a proliferative program very rapidly after TCR engagement (1-2h, (30)), while CD4+ T cells require a much longer duration of TCR signaling (20-24 h, (31, 32)). These earlier studies suggested fundamental differences in TCR signaling between CD4+ and CD8+ T cells. However, to our knowledge, there have previously been no studies reporting mechanistic differences between CD4+ and CD8+ cells in the TCR-mediated activation of NF-κB signaling. Consequently, our data are important because they establish that there are major differences in how CD4+ and CD8+ T cells signal to NF-κB. In addition, our data lend strong support to the hypothesis that NF-κB activation is essential for T cell proliferation. Undivided CD8+ T cells from WT and knock-out mice showed very little IKK activation (IκBα phosphorylation), while divided cells showed considerable IKK activity over the course of 72 h (Fig. 6H). Furthermore, divided knock-out T cells showed WT levels of phospho-IκBα, indicating that those knock-out T cells that proliferated also activated the IKK complex to a similar extent as WT T cells.
Direct visualization of the p65 subunit of NF-κB revealed a surprising discordance between IκBα phosphorylation and p65 translocation. Specifically, levels of nuclear p65 substantially decreased from 24 to 48 h post-TCR ligation in WT CD8+ T cells, while phospho-IκBα levels peaked in WT CD8+ T cells at 48 h. These two seemingly contradictory pieces of data suggest that other mechanisms of controlling p65 nuclear localization are at work at later time points and/or after prolonged stimulation through the TCR (in WT cells). Indeed, kinetic analysis of the NF-κB pathway previously revealed that IκBα plays a dominant role in controlling the NF-κB response early after stimulation, while IκBβ and IκBε are involved in controlling later responses (33). These findings suggest that the nuclear localization of p65 is controlled by IκBα at early points post-TCR ligation, while IκBβ and IκBε may play a more dominant regulatory role at later points.
Another NF-κB regulatory mechanism that may be relevant to our observations is that, at later time points, the rate of p65 nuclear export exceeds the rate of p65 nuclear import. It has been shown that p65 is acetylated after nuclear localization, which reduces its binding affinity for DNA and enhances nuclear export by IκBα (34). Furthermore, the nuclear localization rate of IκBα exceeds the nuclear localization rate of p65 (35). The combination of p65 acetylation and rapid IκBα shuttling to the nucleus may result in a net decrease of nuclear p65 at later time points (48 h) after TCR ligation.
Either or both of the above mechanisms may limit the amount of p65 that can accumulate in the nucleus at late time points (48 h and beyond) post-TCR stimulation, regardless of the level of IKK activity. Such mechanisms may explain why PKCθ-/- CD8+ T cells (and presumably Bcl10-/- and Malt1-/- CD8+ T cells) fail to accumulate nuclear p65 to the degree seen in WT T cells at 24 h, despite the high levels of phospho-IκBα observed in PKCθ-/- CD8+ T cells by 48 h. Although previous work has shown that NF-κB reponses are proportional to the duration of stimulus for at least 6 h (33), our data and the above cited studies strongly suggest that there are potent homeostatic mechanisms that limit terminal NF-κB activation steps in T cells (i.e., p65 nuclear translocation) at late time points (by 48 h), despite continued TCR engagement and IKK activation.
Overall, our data suggest an interesting dichotomy in the way that CD4+ and CD8+ T cells signal to NF-κB. Further work will be required to determine the precise molecular mechanisms that allow CD8+ T cells to successfully activate NF-κB and divide in the absence of PKCθ, Bcl10, or Malt1.
Acknowledgments
We thank A. Kupfer and D. Littman for PKCθ-/- mice, T. Mak for Bcl10-/- and Malt1-/- mice, S. Maynard for care and screening of mice, and A. Kashyap for general technical support. We also thank C. Olsen for help with statistical analyses, C.-Z. Giam, and P. Love for critical review of this work, and F. Crawford and J. Kappler for providing the MKASSAY program. The authors have no conflicting financial interests.
Footnotes
Funding for this project was provided by grants to BCS from the NIH/NIAID (AI057481), the Sidney Kimmel Foundation for Cancer Research, and the Dana Foundation.
References
- 1.Hayden MS, Ghosh S. Signaling to NF-kappaB. Genes Dev. 2004;18:2195–2224. doi: 10.1101/gad.1228704. [DOI] [PubMed] [Google Scholar]
- 2.Li Q, Verma IM. NF-kappaB regulation in the immune system. Nat Rev Immunol. 2002;2:725–734. doi: 10.1038/nri910. [DOI] [PubMed] [Google Scholar]
- 3.Schulze-Luehrmann J, Ghosh S. Antigen-receptor signaling to nuclear factor kappa B. Immunity. 2006;25:701–715. doi: 10.1016/j.immuni.2006.10.010. [DOI] [PubMed] [Google Scholar]
- 4.Matsumoto R, Wang D, Blonska M, Li H, Kobayashi M, Pappu B, Chen Y, Wang D, Lin X. Phosphorylation of CARMA1 plays a critical role in T Cell receptor-mediated NF-kappaB activation. Immunity. 2005;23:575–585. doi: 10.1016/j.immuni.2005.10.007. [DOI] [PubMed] [Google Scholar]
- 5.Sommer K, Guo B, Pomerantz JL, Bandaranayake AD, Moreno-Garcia ME, Ovechkina YL, Rawlings DJ. Phosphorylation of the CARMA1 linker controls NF-kappaB activation. Immunity. 2005;23:561–574. doi: 10.1016/j.immuni.2005.09.014. [DOI] [PubMed] [Google Scholar]
- 6.Che T, You Y, Wang D, Tanner MJ, Dixit VM, Lin X. MALT1/paracaspase is a signaling component downstream of CARMA1 and mediates T cell receptor-induced NF-kappaB activation. J Biol Chem. 2004;279:15870–15876. doi: 10.1074/jbc.M310599200. [DOI] [PubMed] [Google Scholar]
- 7.Gaide O, Favier B, Legler DF, Bonnet D, Brissoni B, Valitutti S, Bron C, Tschopp J, Thome M. CARMA1 is a critical lipid raft-associated regulator of TCR-induced NF-kappa B activation. Nat Immunol. 2002;3:836–843. doi: 10.1038/ni830. [DOI] [PubMed] [Google Scholar]
- 8.McAllister-Lucas LM, Inohara N, Lucas PC, Ruland J, Benito A, Li Q, Chen S, Chen FF, Yamaoka S, Verma IM, Mak TW, Nunez G. Bimp1, a MAGUK family member linking protein kinase C activation to Bcl10-mediated NF-kappaB induction. J Biol Chem. 2001;276:30589–30597. doi: 10.1074/jbc.M103824200. [DOI] [PubMed] [Google Scholar]
- 9.Sun L, Deng L, Ea CK, Xia ZP, Chen ZJ. The TRAF6 ubiquitin ligase and TAK1 kinase mediate IKK activation by BCL10 and MALT1 in T lymphocytes. Mol Cell. 2004;14:289–301. doi: 10.1016/s1097-2765(04)00236-9. [DOI] [PubMed] [Google Scholar]
- 10.Zhou H, Du MQ, Dixit VM. Constitutive NF-kappaB activation by the t(11;18)(q21;q21) product in MALT lymphoma is linked to deregulated ubiquitin ligase activity. Cancer Cell. 2005;7:425–431. doi: 10.1016/j.ccr.2005.04.012. [DOI] [PubMed] [Google Scholar]
- 11.Su H, Bidere N, Zheng L, Cubre A, Sakai K, Dale J, Salmena L, Hakem R, Straus S, Lenardo M. Requirement for caspase-8 in NF-kappaB activation by antigen receptor. Science. 2005;307:1465–1468. doi: 10.1126/science.1104765. [DOI] [PubMed] [Google Scholar]
- 12.Misra RS, Russell JQ, Koenig A, Hinshaw-Makepeace JA, Wen R, Wang D, Huo H, Littman DR, Ferch U, Ruland J, Thome M, Budd RC. Caspase-8 and c-FLIPL associate in lipid rafts with NF-kappaB adaptors during T cell activation. J Biol Chem. 2007;282:19365–19374. doi: 10.1074/jbc.M610610200. [DOI] [PMC free article] [PubMed] [Google Scholar]
- 13.Karin M, Ben-Neriah Y. Phosphorylation meets ubiquitination: the control of NF-[kappa]B activity. Annu Rev Immunol. 2000;18:621–663. doi: 10.1146/annurev.immunol.18.1.621. [DOI] [PubMed] [Google Scholar]
- 14.Pfeifhofer C, Kofler K, Gruber T, Tabrizi NG, Lutz C, Maly K, Leitges M, Baier G. Protein kinase C theta affects Ca2+ mobilization and NFAT cell activation in primary mouse T cells. J Exp Med. 2003;197:1525–1535. doi: 10.1084/jem.20020234. [DOI] [PMC free article] [PubMed] [Google Scholar]
- 15.Ruefli-Brasse AA, French DM, Dixit VM. Regulation of NF-kappaB-dependent lymphocyte activation and development by paracaspase. Science. 2003;302:1581–1584. doi: 10.1126/science.1090769. [DOI] [PubMed] [Google Scholar]
- 16.Ruland J, Duncan GS, Elia A, del Barco Barrantes I, Nguyen L, Plyte S, Millar DG, Bouchard D, Wakeham A, Ohashi PS, Mak TW. Bcl10 is a positive regulator of antigen receptor-induced activation of NF-kappaB and neural tube closure. Cell. 2001;104:33–42. doi: 10.1016/s0092-8674(01)00189-1. [DOI] [PubMed] [Google Scholar]
- 17.Ruland J, Duncan GS, Wakeham A, Mak TW. Differential requirement for Malt1 in T and B cell antigen receptor signaling. Immunity. 2003;19:749–758. doi: 10.1016/s1074-7613(03)00293-0. [DOI] [PubMed] [Google Scholar]
- 18.Sun Z, Arendt CW, Ellmeier W, Schaeffer EM, Sunshine MJ, Gandhi L, Annes J, Petrzilka D, Kupfer A, Schwartzberg PL, Littman DR. PKC-theta is required for TCR-induced NF-kappaB activation in mature but not immature T lymphocytes. Nature. 2000;404:402–407. doi: 10.1038/35006090. [DOI] [PubMed] [Google Scholar]
- 19.Xue L, Morris SW, Orihuela C, Tuomanen E, Cui X, Wen R, Wang D. Defective development and function of Bcl10-deficient follicular, marginal zone and B1 B cells. Nat Immunol. 2003;4:857–865. doi: 10.1038/ni963. [DOI] [PubMed] [Google Scholar]
- 20.Marsland BJ, Nembrini C, Schmitz N, Abel B, Krautwald S, Bachmann MF, Kopf M. Innate signals compensate for the absence of PKC-{theta} during in vivo CD8(+) T cell effector and memory responses. Proc Natl Acad Sci U S A. 2005;102:14374–14379. doi: 10.1073/pnas.0506250102. [DOI] [PMC free article] [PubMed] [Google Scholar]
- 21.Barnden MJ, Allison J, Heath WR, Carbone FR. Defective TCR expression in transgenic mice constructed using cDNA-based alpha- and beta-chain genes under the control of heterologous regulatory elements. Immunol Cell Biol. 1998;76:34–40. doi: 10.1046/j.1440-1711.1998.00709.x. [DOI] [PubMed] [Google Scholar]
- 22.Kisielow P, Bluthmann H, Staerz UD, Steinmetz M, von Boehmer H. Tolerance in T-cell-receptor transgenic mice involves deletion of nonmature CD4+8+ thymocytes. Nature. 1988;333:742–746. doi: 10.1038/333742a0. [DOI] [PubMed] [Google Scholar]
- 23.Robertson JM, Jensen PE, Evavold BD. DO11.10 and OT-II T cells recognize a C-terminal ovalbumin 323-339 epitope. J Immunol. 2000;164:4706–4712. doi: 10.4049/jimmunol.164.9.4706. [DOI] [PubMed] [Google Scholar]
- 24.Santori FR, Holmberg K, Ostrov D, Gascoigne NR, Vukmanovic S. Distinct footprints of TCR engagement with highly homologous ligands. J Immunol. 2004;172:7466–7475. doi: 10.4049/jimmunol.172.12.7466. [DOI] [PubMed] [Google Scholar]
- 25.Schaefer BC, Kappler JW, Kupfer A, Marrack P. Complex and dynamic redistribution of NF-kappaB signaling intermediates in response to T cell receptor stimulation. Proc Natl Acad Sci U S A. 2004;101:1004–1009. doi: 10.1073/pnas.0307858100. [DOI] [PMC free article] [PubMed] [Google Scholar]
- 26.Manicassamy S, Sadim M, Ye RD, Sun Z. Differential roles of PKC-theta in the regulation of intracellular calcium concentration in primary T cells. J Mol Biol. 2006;355:347–359. doi: 10.1016/j.jmb.2005.10.043. [DOI] [PubMed] [Google Scholar]
- 27.Ferch U, zum Buschenfelde CM, Gewies A, Wegener E, Rauser S, Peschel C, Krappmann D, Ruland J. MALT1 directs B cell receptor-induced canonical nuclear factor-kappaB signaling selectively to the c-Rel subunit. Nat Immunol. 2007;8:984–991. doi: 10.1038/ni1493. [DOI] [PubMed] [Google Scholar]
- 28.Manicassamy S, Gupta S, Huang Z, Sun Z. Protein kinase C-theta-mediated signals enhance CD4+ T cell survival by up-regulating Bcl-xL. J Immunol. 2006;176:6709–6716. doi: 10.4049/jimmunol.176.11.6709. [DOI] [PubMed] [Google Scholar]
- 29.Barouch-Bentov R, Lemmens EE, Hu J, Janssen EM, Droin NM, Song J, Schoenberger SP, Altman A. Protein kinase C-theta is an early survival factor required for differentiation of effector CD8+ T cells. J Immunol. 2005;175:5126–5134. doi: 10.4049/jimmunol.175.8.5126. [DOI] [PubMed] [Google Scholar]
- 30.van Stipdonk MJ, Lemmens EE, Schoenberger SP. Naive CTLs require a single brief period of antigenic stimulation for clonal expansion and differentiation. Nat Immunol. 2001;2:423–429. doi: 10.1038/87730. [DOI] [PubMed] [Google Scholar]
- 31.Iezzi G, Karjalainen K, Lanzavecchia A. The duration of antigenic stimulation determines the fate of naive and effector T cells. Immunity. 1998;8:89–95. doi: 10.1016/s1074-7613(00)80461-6. [DOI] [PubMed] [Google Scholar]
- 32.Jelley-Gibbs DM, Lepak NM, Yen M, Swain SL. Two distinct stages in the transition from naive CD4 T cells to effectors, early antigen-dependent and late cytokine-driven expansion and differentiation. J Immunol. 2000;165:5017–5026. doi: 10.4049/jimmunol.165.9.5017. [DOI] [PubMed] [Google Scholar]
- 33.Hoffmann A, Levchenko A, Scott ML, Baltimore D. The IkappaB-NF-kappaB signaling module: temporal control and selective gene activation. Science. 2002;298:1241–1245. doi: 10.1126/science.1071914. [DOI] [PubMed] [Google Scholar]
- 34.Kiernan R, Bres V, Ng RW, Coudart MP, El Messaoudi S, Sardet C, Jin DY, Emiliani S, Benkirane M. Post-activation turn-off of NF-kappa B-dependent transcription is regulated by acetylation of p65. J Biol Chem. 2003;278:2758–2766. doi: 10.1074/jbc.M209572200. [DOI] [PubMed] [Google Scholar]
- 35.Birbach A, Gold P, Binder BR, Hofer E, de Martin R, Schmid JA. Signaling molecules of the NF-kappa B pathway shuttle constitutively between cytoplasm and nucleus. J Biol Chem. 2002;277:10842–10851. doi: 10.1074/jbc.M112475200. [DOI] [PubMed] [Google Scholar]