

Abstract
Diabetes is characterized by elevated fasting blood glucose (FBG) resulting from improper insulin regulation and/or insulin resistance. Herein we used female C57BL/6J mouse models for type 1 diabetes (streptozotocin [STZ] treatment) and type 2 diabetes (high fat diet) to examine the ability of 4b,5,9b,10-tetrahydroindeno[1,2-b]indole (THII) to intervene in the progression of diabetes. THII (100 μM in drinking water) significantly diminished and partially reversed the increase in FBG levels produced by STZ. After 10 weeks on a high-fat diet, mice had normal FBG levels, but exhibited fasting hyperinsulemia and loss of glucose tolerance. THII significantly diminished these changes in glucose and insulin. In isolated liver mitochondria, THII inhibited succinate-dependent H2O2 production, while in white adipose tissue, THII inhibited NADPH oxidase-mediated H2O2 production and lipid peroxidation. Without intervention, such oxidative processes might otherwise promote diabetogenesis via inflammatory pathways. THII also increased O2 consumption and lowered respiratory quotient (CO2 produced/O2 consumed) in vivo, indicating a greater utilization of fat for metabolic fuel. Increased metabolic utilization of fat correlated with a decrease in the rate of body weight gain in THII-treated mice fed the high fat diet. We conclude that THII may retard the progression of diabetes via multiple pathways, including the inhibition of oxidative and inflammatory pathways.
Keywords: Diabetes, High fat diet, Mice, NADPH oxidase, Oxidative stress, Tetrahydroindenoindole
1. Introduction
Diabetes and undiagnosed pre-clinical diabetes are at epidemic proportions in American and Western populations, with obesity as a primary risk factor for type 2 diabetes (T2DM). Weight loss may reduce the severity of T2DM in obese individuals having impaired glucose tolerance, and even lessen the severity of insulin-resistance. These effects are due in part to association between diabetes and fat-derived adipokines, such as the anti-inflammatory adipose peptide hormone adiponectin {6024} and the pro-inflammatory resistin [2], two important regulators of glucose tolerance and insulin resistance. The development of T2DM following the onset of obesity can be modeled in high-fat diet fed C57BL/6J mice [3]. The high-fat diet promotes an increase in fatty tissue mass, followed by insulin resistance and impaired glucose tolerance.
While several months are required to develop T2DM in mice fed a high fat diet, type 1 diabetes mellitus (T1DM, insulin-dependent diabetes mellitus) occurs within days in rodents after oxidative destruction of insulin-producing β-cells of the pancreatic islets, using chemicals such as alloxan or streptozotocin (STZ). Although elevated fasting blood glucose (FBG) is the hallmark of both T1DM and T2DM, even transient hyperglycemia can produce oxidative damage and tissue damage, such as neuronal cell death [4]. Hyperglycemia is the major risk factor for development of diabetic microvascular disease, including cardiomyopathy, nephropathy, retinopathy and peripheral neuropathy [5]. The etiology of hyperglycemic disease in humans and in mice is complex and involves multiple mechanisms, including the formation of advanced glycation end-products, glucose metabolism through the polyol pathway, and protein kinase C activation. Each of these pathways is related to cellular oxidative stress and mitochondrial reactive oxygen production [6; 7].
Antioxidants (melatonin, various herbs and teas, vitamin E, curcurmin, glutathione peroxidase, coenzyme Q10) [8] and analgesic drugs [9; 10], have potential to protect against diabetic hyperglycemia and associated microvascular disease. The focus of the present study is 4b,5,9b,10-tetrahydroindeno[1,2-b]indole (THII), a hydrophobic and exceptionally potent chain-breaking antioxidant that acts by 1-electron reductive scavenging of radicals, forming the stable nitrogen radical cation in the process [11]. THII is the parent compound of group of non-volatile and odorless congeners that protect animals and cells in culture against toxicity from a variety of chemicals [12–15]. THII chemoprotective properties have been associated with diverse chemical and biological properties of THII, including its efficacy as a hydrophobic antioxidant (about 10-fold greater than vitamin E) [12]. The antioxidant potency of THII lies in its ability to quench a free radical by donating an electron from the free electron pair on the nitrogen, forming a stable cation radical in the process [16]. THII has other properties that may contribute to chemoprotection, including the stabilization of biological membranes against osmotic fragility [12], and the ability to prevent apoptosis resulting from membrane depolarization by preventing caspase 3 activation [15]. THII does not, however, alter enzyme activities or endogenous antioxidant levels associated with drug metabolism or oxidative stress [13]. In a 40-week study in mice, THII at the dosage used in the present study, exhibited no overt toxicity, yet was effective in reducing benzo[a]pyrene-induced tumor yield, and increasing tumor latency, when delivered via water, food, or directly to skin [14]. These results suggest a favorable pharmacokinetic profile for THII and its ability to distribute in a pharmacologically-active form throughout the body.
In this paper we examine the potential for THII to prevent the development of risk factors involved in the progression of diabetes.
2. Materials and methods
2.1. Chemicals
Standard Fischer indole synthesis was used to synthesize THII, as described previously in detail [12]. All other chemicals and reagents were obtained from Sigma-Aldrich Chemical Company (St. Louis, MO) as the highest available grades.
2.2. Animals and treatment
All experiments involving mice were conducted in accordance with the National Institutes of Health standards for care and use of experimental animals as stated in Principles of Laboratory Animal Care (NIH Publication No. 85–23, revised 1985; http://grants1.nih.gov/grants/olaw/references/phspol.htm), and the University of Cincinnati Institutional Animal Care and Use Committee. Female C57BL/6J mice, 8–10 weeks of age, were purchased from Jackson Laboratory (Bar Harbor, ME). Animals were group-housed, maintained on a 12-h light/dark cycle, and had access to rodent chow and water ad libitum. Mice were matched by initial body weight, and assigned to groups. Mice were allowed ad libitum either a normal or a high fat diet that was pelleted, semipurified, and nutritionally complete. The normal diet (AIN-93M, Dyets, Bethlehem, PA) contained 3 g of butter oil and 1 g of soybean oil/100 g diet, supplying 16.12 kJ/g diet, with 1.29 kJ of fat [17]. High-fat diet-fed mice received a modified AIN-93M diet containing 19 g butter oil and 1 g of soybean oil/100 g diet, supplying 19.34 kJ/g diet, with 7.74 kJ of fat. Both diets contained the same amount of protein, minerals and vitamins [18].
Where indicated, mice were administered 100 μM THII in drinking water ad libitum. The consumption of water remained constant at ~4 ml/d, such that the dosage was about 4.5 mg THII/kg body weight/d (Table 1). Streptozotocin (STZ) was dissolved in 10 mM citrate buffer (pH 5.0) and injected i.p. following an 8-h fast. Food was returned and the mice received 10% sucrose in the drinking water for 24 h. The dosage of STZ varied with the experiment, and is described in the Results and Figure Legends.
Table 1.
Systemic parameters of THII treatment
| Parameter | Normal diet | High fat diet | ||
|---|---|---|---|---|
| (units as shown) | Vehicle | THII | Vehicle | THII |
| Water consumption (ml/mouse/day) | 4.2 ± 0.3 | 4.0 ± 0.3 | 3.8 ± 0.3 | 3.9 ± 0.4 |
| Calculated THII dosage (mg/kg/day) | 0 | 4.6 ± 0.3 | 0 | 4.5 ± 0.5 |
| Weight gain (% BW change/week) | 2.5 ± 0.3 | 2.4 ± 0.2 | 3.9 ± 0.4* | 3.0 ± 0.3* |
| Food consumed (g/d/100 g BW) | 16.1 ± 1.3 | 15.8 ± 1.2 | 12.7 ± 0.8* | 12.8 ± 0.9* |
| Food consumed (kJ/d/100 g BW) | 259 ± 21 | 254 ± 19 | 246 ± 15 | 248 ± 17 |
| % Body fat | 8.3 ± 0.5 | 8.5 ± 0.7 | 17.2± 1.0* | 16.5 ± 1.9* |
| % Body muscle | 85.1 ± 0.6 | 85.3 ± 0.7 | 77.8 ± 1.4* | 76.9 ± 1.6* |
| % Body H2O | 77.1 ± 0.5 | 76.7 ± 0.8 | 70.5 ± 1.3* | 69.7 ± 1.4* |
These parameters were measured in live mice. Mean values ± SEM (N=4) are shown for each group.
Significantly different mean value than the corresponding mice consuming the normal diet, at P<0.05.
2.3. Glucose and glucose tolerance test
Glucose concentration was determined with a handheld glucometer (Ascensia Contour glucometer, Bayer) [18]. Bi-weekly samples of 5 μl blood were applied directly to the glucose strip from fasted mice to measure fasting levels of blood glucose. Glucose tolerance tests were performed after an 8-h fast. After initial blood glucose determinations, 1.5 mg D-glucose/g body weight was administered by i.p. injection, followed by glucose determinations at 20 min intervals for 120 min. Plasma insulin was measured using a radioimmunoassay employing guinea pig insulin anti-serum with high affinity for rodent insulin [19].
2.4. Metabolic parameters and body composition
Body weights, and food and water consumption, were measured twice weekly. In vivo oxygen consumption and CO2 release were determined using metabolic chambers. Oxygen consumption was determined as gas consumed in the presence of soda lime to absorb CO2. CO2 release was calculated as gas consumed in the presence, minus in the absence, of soda lime [20]. Body composition was assessed in live, unanesthetized mice by nuclear magnetic resonance (NMR) (EchoMRI; EchoMedical Systems, Houston TX, www.echomri.com). This method provides estimates of total fat tissue, lean tissue (muscle), and water [21].
2.5. Mitochondrial energy coupling and reactive oxygen production
Untreated mice were killed by carbon dioxide asphyxiation, followed by cervical dislocation. Liver was excised and mitochondria were isolated, washed, then centrifuged through a cushion of respiratory buffer (70 mM sucrose, 220 mM mannitol, 0.5 mM EDTA, 2.5 mM KH2PO4, 2.5 mM MgCl2, 0.1% bovine serum albumin, and 2 mM Hepes, pH 7.4) [22]. The mitochondrial pellet was suspended in respiratory buffer and oxygen consumption was measured polarographically with a Clark-type oxygen electrode (Hansatech Instruments, Norfolk, England). Briefly summarized, 0.5 ml of respiratory buffer and 50 mg of mitochondrial protein were equilibrated at 37°C with stirring. The rate of State 4 respiration (ADP-limited) was determined in the presence of 6 mM succinate. Following the addition of 0.2 mM ADP, the rate of State 3 respiration was measured. The respiratory control ratio (RCR) was calculated as the ratio of State 3 to State 4 respiration. H2O2 and superoxide were monitored in freshly prepared mitochondria. H2O2 was assayed as catalase-inhibited luminol (5-amino-2,3-dihydro-1,4-phthalazinedione) chemiluminescence, and superoxide was measured as Mn(III)tetrakis(1-methyl-4-pyridyl)porphyrin (MnTMPyP)-inhibited lucigenin (bis-N-methylacridinium) chemiluminescence [22; 23]. The mitochondrial inner membrane potential using the cationic lipophilic dye JC-1 (5,5,6,6-tetrachloro-1,1,3,3-tetraethylbenzimidazolylcarbocyanine iodide) [24], and ATP determinations [25] were assayed as described previously. Succinate-dependent ATP/O ratios (a better estimate than RCR for energy coupling) were calculated as nmol ATP produced/natom of succinate-stimulated respiration.
2.6. Oxygen metabolism in white adipose tissue
Mice that were fed either a normal or a high fat diet for 10 weeks were allowed plain drinking water, or water containing 100 μM THII. A 10% whole homogenate of visceral white adipose tissue (WAT) was prepared in respiratory buffer, producing an emulsion. Aliquots of this whole homogenate emulsion were removed for analysis of decomposition products of lipid peroxidation (malondialdehyde and 4-hydroxyalkenals) using the chromogenic probe, methylphenylindole (Diagnostic kit Bioxytech LPO 586, OxisResearch, OXIS Health Products, Inc.). The remaining emulsion was broken by centrifuging at 1000g for 10 min. The upper fat layer was removed, and the post-nuclear homogenate evaluated for O2 uptake and H2O2 production by polarography and luminol chemiluminescence, respectively, as described above.
2.7. Statistics
Statistical significance of the differences between group sample mean values was determined by a two-way analysis of variance (ANOVA), with the independent variables either diet type and THII treatment, or STZ and THII treatment. The ANOVA was followed by the Student-Newman-Keuls test for pairwise comparison of means. Statistics were performed using SigmaStat Statistical Analysis software (SPSS Inc., Chicago, IL).
2.8. Biohazard precaution
STZ is toxic. All personnel were instructed in safe handling procedures, including wearing laboratory coats, gloves and masks.
3. Results
3.1. Effect of THII in STZ-treated mice (model for T1DM)
Mice treated with a high dosage of STZ (200 mg/kg body weight) showed deteriorating health in the form of a decrease in body weight (Fig. 1, top right panel). This high dosage of STZ was chosen in order to produce a rapid and complete destruction of pancreatic β-cells. Since a preliminary study showed animal mortality at Day-15 after 200 mg STZ/kg body weight, we terminated the reported experiment at day 12. When 100 μM THII treatment was started 7 days before STZ, THII protected against the loss in body weight for about a week, but then weight loss began. Following treatment with STZ, FBG levels rose steadily to >500mg/dl (Fig. 1, middle right panel). In the presence of THII, FBG also increased, but reached maximal levels of only about 300 mg/dl. On day-12, mice were fasted for 10 h, and then administered a glucose challenge. For STZ-treated mice, blood glucose rapidly exceeded 600 mg/dl (maximum reading) and remained high for at least 2 h (Fig. 1, bottom right panel). Although THII did not affect the glucose tolerance curve in untreated mice, in STZ-treated mice blood glucose increased to about 500 mg/dl, then slowly diminished. In contrast, blood glucose in mice receiving STZ without THII went off-scale for the glucometer (> 600 mg/dl), and remained off-scale up to 120 min.
Fig. 1. THII lowers blood glucose levels in STZ-treated mice.

Mice received 200 mg STZ/kg body weight on Day-0 (right panels), or vehicle (left panels). Mice were given 100 μM THII in drinking water starting 7 days before Day-0 (closed symbols), or plain drinking water (open symbols).
For data in the lower panels, FBG was monitored bi-weekly, and glucose challenge was conducted on Day-12. Mean values ± SEM (N=8) are shown for each group.
*Significantly different mean value than the mean obtained from mice treated with STZ without THII (P<0.01).
In order to determine the efficacy of THII treatment in protecting against STZ-induced FBG, as well as possibly reversing the STZ effect, THII treatment was begun at various times relative to STZ and continued until the time of sacrifice. For this experiment, we used a lower STZ dosage (150 mg/kg body weight) because of concerns of progressive deteriorating health of the mice at higher STZ dosages. Fig. 2 shows that THII protected against, and to a lesser extent reversed, the glycogenic changes that occurred with STZ, even when THII treatment was begun several days after STZ. Of the regimens tested, the most effective dosing schedule was when THII was administered seven days prior to STZ, with complete protection afforded. At Day-9 after STZ, the percent protection from hyperglycemia by THII was as follows: THII one day before STZ (80%), THII at Day-2 (60%), THII at Day-7 (50%).
Fig. 2. THII protects against, and reverses, the increase in fasting blood glucose produced by STZ.

Mice received vehicle or 150 mg STZ/kg body weight on Day-0. Mice were given 100 μM THII in drinking water starting on the indicated day, and continuing through Day-9. FBG was monitored following a 10-h fast on the indicated days. Mean values ± SEM (N=4) are shown for each group.
3.2. Effect of THII in mice fed a high fat diet (model for pre-T2DM)
Since a gain in body weight, especially in the form of fat, is associated with the development of insulin resistance, a major factor in initiating diabetes, we evaluated body weights and composition in mice fed the high fat diet for 10 weeks. Consumption of the high fat diet resulted in a 56% increase in the rate of weight gain, accompanied by a doubling in the percentage of total body fat (Table 1). THII reduced the rate of weight gain in mice receiving the high fat diet, but not in mice consuming the normal diet. This THII effect on body weight did not result from food or water aversion, since the average daily consumption of water and food were unchanged in these mice. The increase in body fat produced by the high fat diet was accompanied by a corresponding decrease in muscle and water. THII treatment during the period of high fat consumption had no effect on any of these parameters.
Mice that were fed the high fat diet for 10 weeks showed no changes in FBG, either with or without THII treatment (Fig. 3, top panels). However, when challenged with an i.p. injection of 1.5 mg glucose/g body weight, blood glucose levels almost doubled in the high fat diet mice. Pretreatment with THII for 7 days before initiating the high fat diet, and subsequent daily treatment, prevented the higher blood glucose levels after a glucose challenge, such that the AUCs for mice fed normal or the high fat diet were comparable (Fig. 3, bottom panels).
Fig. 3. THII protects against hyperglycemia in mice fed a high fat diet.

Mice were given plain drinking water, or 100 μM THII in drinking water. Bi-weekly baseline FBG levels did not differ between water and THII-treated mice on either diet. After 10 weeks, mice were given a glucose tolerance test, and blood glucose determined at 20-min intervals for 120 min. Mean values ± SEM (N=4) are shown for each group.
| Drinking Water AUC (min·mg/dl) | THII in Water AUC (min·mg/dl) | |
|---|---|---|
| Normal diet | 15,810 ± 1,350 | 17,885 ± 1,150 |
| High fat diet | 28,714* ± 1,940 | 16,065 ± 1,010 |
3.3. THII effects on plasma insulin levels
Since blood glucose levels are highly dependent on insulin, plasma insulin levels were measured for mice treated with STZ and for mice receiving a high fat diet (Fig. 4). In untreated mice fed a normal diet, plasma insulin levels increased at 30 min following a glucose challenge (top left panel). THII did not significantly change the response of insulin to the glucose challenge (bottom left panel). In mice treated 12 days previously with 200 mg STZ/kg body weight, fasting basal and glucose-challenged levels of plasma insulin were not detectable (<5 pM) (top center panel). When THII was administered prior to STZ and daily thereafter, a weak insulin response to the glucose challenge was observed, but basal levels of plasma insulin remained undetectable (bottom center panel). A different pattern of plasma insulin was observed in mice fed a high fat diet for 10 weeks. Fasting basal levels of insulin were elevated in these mice, while the glucose-stimulated insulin levels were similar to those measured in control mice (Top right panel). THII partially prevented this increase in basal plasma insulin while not affecting the normal glucose challenged insulin levels (bottom right panel).
Fig. 4. Plasma insulin levels in mice.

Mice were fed a normal diet (left and center panels), or a high fat diet for 10 weeks (right panels). Mice were treated with 200 mg STZ/kg BW on day zero (center panels). In addition, mice received 100 μM THII in drinking water starting 7 days before STZ (lower panels). The bars represent mean serum insulin levels ± SEM (N=4) in mice before (open bars) and 30 min after (solid bars) a glucose challenge. n.d. indicates that insulin levels were below the level of detection (5 pM).
aSignificantly higher mean value 30 min after a glucose challenge than zero time (pre-glucose) control (P<0.01).
bSignificantly higher mean value than mean obtained from mice just before the glucose challenge in mice fed a normal diet (P<0.01).
cSignificantly higher mean value than mean obtained from mice just before the glucose challenge in mice fed a normal diet (P<0.01).
3.4. THII and body composition
The development of insulin resistance and the loss of glucose tolerance are indicators of a pre-diabetic condition in humans, often following increases in body weight and percentages of body fat. We evaluated body composition in mice fed the high fat diet for 10 weeks. Initially, body weights were matched for the different experimental groups. Consumption of the high fat diet resulted in a doubling in the percentage of total body fat (Table 1). The gain in percentage of body fat for mice consuming the high fat diet was accompanied by a decrease in percentage of body muscle and water. Pretreatment and daily treatment during the period of high fat consumption with THII had no effect on any of these parameters of body composition. In order to determine whether the changes in body fat composition were the result of changes in caloric intake, we measured food and water consumption, relative to weight gain. Mice on the high fat diet gained weight about 50% more rapidly than mice on the normal diet. It is of interest that the mice appeared to self-regulate caloric intake, consuming about 20% less food by weight of the high fat diet. Since the high fat diet contained 20% more energy by weight (19.34 kJ/g compared with 16.12 kJ/g for the normal diet), the energy consumption was the same on both diets. It therefore appears that feeding efficiency (conversion of food to body mass in units of g body weight gain/energy content of food consumed) was higher in mice fed the high fat diet than with the normal diet. THII did not affect body composition, food or water consumption, or feeding efficiency with either diet.
3.5. Parameters of mitochondrial respiration and oxidative stress
Since mitochondrial oxidative stress is involved in the etiology of the pre-diabetic state leading to T2DM, we evaluated the ability of THII to quench the production of mitochondria-derived reactive oxygen. We performed extensive mitochondrial function tests, first using liver mitochondria from untreated mice to model the effect of THII on mitochondria from tissues critical to the diabetogenic process (e.g., pancreatic β-cells and WAT). We were not able to obtain clean and coupled mitochondria from WAT or pancreatic islet cells in sufficient quantity to perform these initial studies. THII, administered in vitro to isolated liver mitochondria, strongly inhibited the mitochondrial generation of both H2O2 and superoxide, with IC50 values of 0.8 μM and 1.3 μM, respectively (Fig. 5, top panel). [Note: THII at these concentrations had no effect on either H2O2 (glucose/glucose oxidase)-generated luminol luminescence, or superoxide (xanthine/xanthine oxidase)-generated lucigenin luminescence indicating the effect shown is not due to quenching of the probe (method described in [23])]. We next examined State 4 respiration (ADP-limited), and state 3 respiration (limited primarily by the composition of the respiratory chain and the rate of phosphorylation). The slight THII-mediated increase in State 4 respiration (Fig. 5, second panel) suggests that THII may be a weak uncoupler of oxidative phosphorylation. Mitochondrial energy coupling is typically expressed as respiratory control ratios (RCR), calculated as the ratio of state 3:state 4 respiration. THII decreased mitochondrial energy coupling and succinate-dependent membrane potential by about 30% (Fig. 5, third panel). A better estimate of energy coupling is the molar ratio of the rate of ATP production to the rate of oxygen consumption, or ATP/O ratio. THII at 8 μM decreased mitochondrial ATP production and ATP/O ratios by about 30%. However, at THII concentrations that abolished H2O2 production, ATP synthesis and ATP/O ratios were almost unchanged (Fig. 5, bottom panel).
Fig. 5. Direct effect of THII on mitochondrial oxygen metabolism.

Mice were fed a normal diet and plain drinking water. Mitochondria were prepared from livers of 10-h fasted mice, and parameters of mitochondrial activity were assayed as described in Methods section 2.5. RCR is respiratory control ratio (state 3/state 4). Shown are mean values for the parameters indicated ± SEM (N=4).
In order to evaluate whether THII causes similar effects in mitochondria from treated mice, versus THII added directly to isolated mitochondria, we prepared liver mitochondria from mice that had been treated with THII for 10 weeks. Mitochondria received no additional THII. Under state 4 (ADP-limited) conditions, H2O2 production was abolished in mitochondria from THII-treated mice (Table 2). Although state 4 respiration appeared to be slightly elevated in mitochondria from THII-treated mice, significance at the P<0.05 level was not achieved. However, the RCR in mitochondria from mice fed a normal diet was significantly lower in the THII-treated mice. Most importantly for sustained tissue viability, THII did not reduce hepatic ATP levels in mice fed either diet.
Table 2.
Respiration in liver mitochondria from THII-treated mice
| Parameter | Normal diet | High fat diet | ||
|---|---|---|---|---|
| (units as shown) | Vehicle | THII | Vehicle | THII |
| H2O2 formed (pmol/min/mg protein) | 481 ± 41 | 43 ± 19* | 369 ± 32 | 39 ± 14* |
| State 3 respiration (nmol O2/min/mg protein) | 363 ± 40 | 346 ± 35 | 349 ± 27 | 371 ± 32 |
| State 4 respiration (nmol O2/min/mg protein) | 88 ± 7 | 102 ± 8 | 100 ± 9 | 116 ± 10 |
| RCR (State 3/State 4) | 4.1 ± 0.3 | 3.4 ± 0.2* | 3.5 ± 0.2 | 3.1 ± 0.3 |
| Hepatic ATP (μmol/g liver) | 5.9 ± 0.5 | 5.7 ± 0.4 | 5.7 ± 0.5 | 6.0 ± 0.6 |
Mice were fed a normal diet or a high fat diet for 10 weeks. Following a 10-h fast a piece of fresh liver tissue was immediately processed and assayed for ATP. Mitochondria were isolated from the rest of the liver and parameters of activity determined. H2O2 was determined in mitochondria in state 4 (ADP-limited conditions. Mean values ± SEM (N=4) are shown for each group.
Significantly different mean value than mice consuming the same diet but without THII in the drinking water, at P<0.05.
3.6. THII and NADPH oxidase in white adipose tissue
White adipose tissue (WAT) is involved in oxidative and inflammatory pathways leading to diabetes. We therefore evaluated the effects of THII on oxygen metabolism in WAT (Table 3). The high fat diet doubled the content of WAT 4-hydroxyalkenals, which are decomposition products of lipid peroxidation. THII prevented most of this increase. Malondialdehyde content of WAT was low and not significantly altered by the high fat diet, probably because of the rapid rate of malondialdehyde metabolism. In WAT, succinate-dependent mitochondrial oxygen consumption and H2O2 production were very low relative to parameters observed in liver. In contrast, NADPH supported higher levels of oxygen consumption and H2O2 production in WAT from mice fed a high fat diet, most of which was prevented by THII treatment. Furthermore, NADPH-dependent oxygen consumption and H2O2 production were inhibited by the NADPH oxidase inhibitor, diphenyleneiodonium chloride (DPI), suggesting the importance of this pro-oxidant enzyme in the oxidative stress response in WAT of mice fed a high fat diet.
Table 3.
Oxidative stress in white adipose tissue (WAT)
| Normal diet | High fat diet | ||||
|---|---|---|---|---|---|
| Substrate | Parameters | Vehicle | THII | Vehicle | THII |
| - | Malondialdehyde | 0.16 ± 0.05 | 0.14 ± 0.04 | 0.23 ± 0.06 | 0.22 ± 0.05 |
| - | 4-Hydroxyalkenals | 0.31 ± 0.08 | 0.12 ± 0.07 | 0.59 ± 0.12** | 0.14 ± 0.05* |
| Succinate | O2 uptake | 5.6 ± 1.0 | 4.8 ± 1.5 | 4.8 ± 0.9 | 4.2 ± 1.3 |
| Succinate | H2O2 | 0.07 ± 0.04 | 0.09 ± 0.04 | 0.02 ± 0.02 | 0.04 ± 0.04 |
| NADPH | O2 uptake | 14.7 ± 1.2 | 6.4 ± 0.8* | 22.6 ± 3.1** | 9.7 ± 1.1*, ** |
| NADPH | H2O2 | 1.2 ± 0.11 | 0.3 ± 0.06* | 2.5 ± 0.21** | 0.4 ± 0.06* |
| NADPH + DPI | H2O2 | 0.23 ± 0.04 | 0.11 ± 0.02 | 0.36 ± 0.06 | 0.19 ± 0.04** |
Mice were fed either a normal or a high fat diet for 10 weeks. Mice were provided drinking water, or water containing 100 μM THII. Parameters were determined using visceral WAT, as described in the Methods section. Mean values ± SEM (N=4) are indicated. Concentrations of substrates were 6 mM succinate, 0.4 mM NADPH and 25 μM DPI (diphenyleneiodonium chloride). Succinate-dependent O2 uptake and H2O2 production (nmol/min/g fat) were determined under state 4 (ADP-limiting) conditions. Units for the products of lipid peroxidation, malondialdehyde and 4-hydroxyalkenals are nmol/g fat.
Significantly different mean value than mice consuming the same diet but without THII in the drinking water, at P<0.05.
Significantly different mean value than mice receiving vehicle or THII, and consuming the normal diet, at P<0.05.
3.7. THII and systemic respiration
The ability of THII to partially uncouple mitochondrial oxidative phosphorylation (Fig. 5), suggests that THII might increase basal metabolic rate and produce an associated decrease in the rate of body weight gain. Fig. 6 supports this contention. In both 12-hour fasted and non-fasted mice, oxygen consumption increased by about 20% in mice that had received 100 μM THII in drinking water for 10 weeks. Interestingly, in non-fasted mice THII produced a decrease in the respiratory quotient (CO2 produced/O2 consumed). These results suggest that THII causes a change in energy metabolism toward more lipid utilization as a metabolic fuel, and away from carbohydrate. Furthermore, the increase in fat as a metabolic fuel could explain the reduction in the rate of body weight gain in mice receiving a high fat diet, but not in mice receiving a normal diet (Table 1).
Fig. 6. Effect of treating mice with THII on respiration.

Mice were fed a normal diet and either plain drinking water (open bars), or 100 μM THII in drinking water (solid bars). After 10 weeks, mice were either non-fasted (left panels), or fasted for 12 hours (right panels). O2 consumption and CO2 production were evaluated. Shown are mean values for the parameters indicated ± SEM (N=4).
*Significantly different mean value compared with the plain drinking water control group (P<0.05).
4. Discussion
4.1. THII and diabetogenesis
In this study we showed that 100 μM THII in drinking water reduced and partially reversed hyperglycemia associated with destruction of pancreatic β-cells by STZ. After 10 weeks on a high-fat diet, mice exhibited loss of glucose tolerance and elevated fasting insulin levels, changes that were mitigated by THII. THII also inhibited hepatic mitochondrial H2O2 production, as well as NADPH-oxidase mediated H2O2 production and lipid peroxidation in white adipose tissue. THII generated increased O2 consumption and fat metabolism that appeared to contribute to a decrease in the rate of body weight gain in mice fed the high fat diet.
The inability to maintain blood glucose homeostasis defines the diabetic condition, yet frank T2DM ensues only after years of a slowly developing pre-diabetic state involving stages of progressing insulin resistance and loss of glucose tolerance [26]. Obesity is a major risk factor and exacerbates T2DM. The induction of T2DM by a high-fat diet in C57BL/6J mice [3], the animal model used in the current study, may be used to examine potential intervention strategies for humans, given the increase in obesity and T2DM in our society. The high-fat diet leads to obesity, followed by insulin resistance and impaired glucose control, often resulting in fasting hyperglycemia [3; 27]. Although FBG levels are used clinically to diagnose diabetes, non-fasting blood glucose levels are also important, and even transient hyperglycemia can produce oxidative tissue damage leading to neuronal cell death [4]. Therefore, there is urgency to develop new pharmaceuticals, such as THII, that have the clinical potential to reduce weight gain and mitigate hyperglycemia.
4.2. Reduction of hyperglycemia and oxidative stress
The biochemical and pharmacokinetic properties of THII suggest that this compound could be effective in reducing pathogenic pathways of inflammation and oxidative stress associated with diabetic hyperglycemia, such as nephropathy, peripheral neuropathy, retinopathy and cardiovascular disease [28]. For example, nephropathy leading to end-stage renal disease occurs in about 30% of individuals with type 1 as well as type 2 diabetes. An underlying biochemical basis for nephropathogenic changes is glucose-induced oxidative stress resulting mainly from hyperglycemia-mediated glycation reactions leading to protein cross-linking and formation of advanced glycation endproducts (AGEs) [29] which, in turn, may activate inflammatory pathways through specific cell-surface AGE receptors (RAGEs) [30]. In the case of diabetic (glycogenic) peripheral neuropathy, protein crosslinking by sugar aldehydes or ketones are important factors that lead to peripheral neuropathy [31]. In addition to glycation of neurofilaments, actin, and tubulin in peripheral nervous system nerves, nitrotyrosine adducts also accumulate and contribute to pathogenesis, as indicated by studies in which a peroxynitrite decomposition catalyst reversed tail-flick latency in mouse models of diabetic neuropathy [32]. Both glycation and formation of peroxynitrite are dependent on generation of reactive oxygen species [32].
4.3. Mitochondrial reactive oxygen and hyperglycemia
The development of insulin resistance and type 2 diabetes in the elderly is linked to an age-associated decline in mitochondrial functions, including respiration, ATP production, reactive oxygen formation, and apoptosis [33]. These processes are largely regulated by the reduction state of the cell and the mitochondria. The mitochondrial production of H2O2 is highly dependent on membrane potential [34]. Increases in metabolic fuel supply tend to increase NADH levels leading to increased inner mitochondrial membrane potential and resulting in a greater rate of reactive oxygen production. Mitochondrial oxidative stress is normally regulated via limited mitochondrial uncoupling through the expression of uncoupling proteins (UCPs) that promote the flux of protons through the membrane and through the regulation of the mitochondrial permeability transition pore [24; 34; 35]. Similar to these biological processes, THII acts as a limited mitochondrial uncoupler. A hypothetical model depicting the uncoupling mechanism for THII via increasing membrane permeability to protons is shown in Fig. 7, Scheme A. The action of THII as an uncoupler would be limited by the dissociation potential of the N-hydrogen, and by the solubility and diffusion potential of THII in the inner mitochondrial membrane.
Fig. 7. Schematic diagrams for the proposed mechanisms of action for THII.
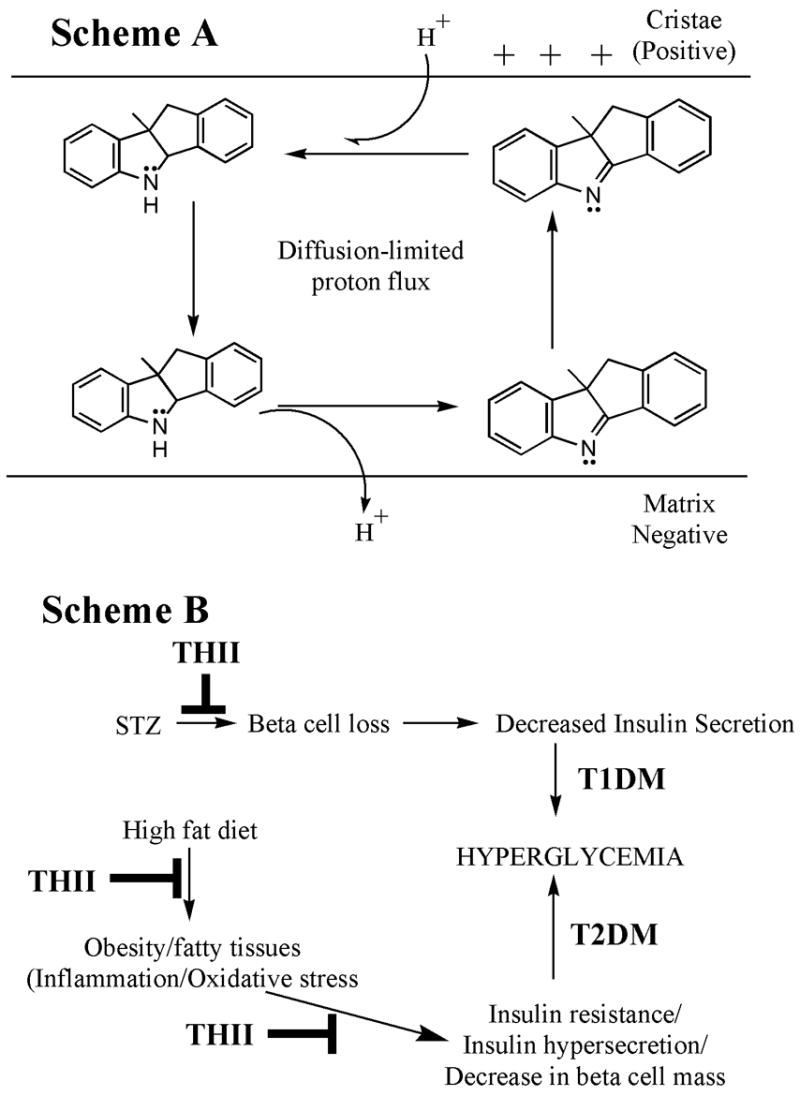
Scheme A. THII partial mitochondrial uncoupling. We propose that hydrophobic THII can exist in either the N-protonated (secondary amine) or N-nonprotonated (tertiary amine), which may diffuse across the membrane according to its concentration gradient, and driven by the membrane potential. We further speculate that its ability to uncouple decreases with decreasing membrane potential, and is limited by its rate of diffusion in the membrane.
Scheme B. THII protection from the development of hyperglycemia in the STZ and the high fat diet mouse models. The STZ (T1DM) and high fat diet (T2DM) models both lead to hyperglycemia. THII is postulated to intervene in this process by diminishing inflammation and oxidative stress that might promote insulin resistance, loss of glucose homeostasis and loss of pancreatic β-cell mass.
Reduction of membrane potential by 15 and 50% results in a decrease in H2O2 production by 50 and 90%, respectively [34]. In the present study, about 1 μM THII reduced membrane potential by about 15% and H2O2 production by 90%, and 8 μM THII reduced membrane potential by one-third, but completely quenched H2O2 production. Thus, partial uncoupling and associated reduction in membrane potential can only partly explain the strong inhibition of mitochondrial reactive oxygen production by THII. Because THII is such a powerful antioxidant, direct scavenging of reactive oxygen is a highly likely mechanism of action. The use of antioxidants, especially N-acetylcysteine and reduced glutathione, vitamins C and E, and flavanols have shown promise in clinical trials in restoring insulin sensitivity and glucose homeostasis in T2DM [36]. However, in terms of radical scavenging efficacy, THII is far superior to other known antioxidants [12; 16].
4.4. The involvement of NADPH oxidase
A potentially important pathway by which THII may reduce reactive oxygen production and inflammation associated with a high fat diet is through NADPH oxidase. Normally, this enzyme is involved in important activities in WAT, such as oxygen signaling of pre-adipocyte differentiation to mature adipocytes [37]. However, high NADPH oxidase activities can also generate an oxidative stress response in adipocytes, activating MAP kinase pathways, decreasing the availability of NO, and increase protein nitrosylation and lipid peroxidation [38]. Obesity associated with a high fat diet may also generate metabolic syndrome through oxidative stress pathways involving the increased expression of WAT NADPH oxidase [39]. Thus, the present finding that THII reduces NADPH oxidase-dependent production of H2O2 may be clinically relevant.
5. Conclusions
Hyperglycemia is a major causative factor for debilitating diseases including nephropathy, cardiovascular disease, retinopathy and peripheral neuropathy. This study has shown that THII has the potential to delay or reverse the progression of diabetes, by decreasing insulin resistance and improving glucose tolerance, and by decreasing weight gain resulting from a high fat diet. It is likely that the protective action of THII in this study occurs via multiple mechanisms, consistent with the complexity of the phenotype. The potential protective pathways suggested in this study are summarized in Fig. 7, Scheme B.
Acknowledgments
We thank Kathy LaDow, Jennifer Schurdak, and Kay Ellis for their technical assistance. This study was supported in part by NIH R01 ES12463 and NIEHS Center Grant P30 ES06096. The Obesity Research Center at the University of Cincinnati is supported in part by Procter & Gamble.
Abbreviations
- AGE
advanced glycation end-product
- FBG
fasting blood glucose
- T1DM
type 1 diabetes mellitus, insulin dependent diabetes mellitus
- T2DM
type 2 diabetes mellitus, non insulin dependent diabetes mellitus
- STZ
streptozotocin (1-methyl-1-nitroso-3-[2,4,5-trihydroxy-6-(hydroxymethyl)oxan-3-yl]-urea)
- THII
4b,5,9b,10-tetrahydroindeno[1,2-b]indole
- WAT
white adipose tissue
Footnotes
Publisher's Disclaimer: This is a PDF file of an unedited manuscript that has been accepted for publication. As a service to our customers we are providing this early version of the manuscript. The manuscript will undergo copyediting, typesetting, and review of the resulting proof before it is published in its final citable form. Please note that during the production process errors may be discovered which could affect the content, and all legal disclaimers that apply to the journal pertain.
References
- 1.Pajvani UB, Du X, Combs TP, Berg AH, Rajala MW, Schulthess T, Engel J, Brownlee M, Scherer PE. Structure-function studies of the adipocyte-secreted hormone Acrp30/adiponectin. Implications for metabolic regulation and bioactivity. J Biol Chem. 2003;278:9073–9085. doi: 10.1074/jbc.M207198200. [DOI] [PubMed] [Google Scholar]
- 2.McTernan PG, Kusminski CM, Kumar S. Resistin. Curr Opin Lipidol. 2006;17:170–175. doi: 10.1097/01.mol.0000217899.59820.9a. [DOI] [PubMed] [Google Scholar]
- 3.Surwit RS, Kuhn CM, Cochrane C, McCubbin JA, Feinglos MN. Diet-induced type II diabetes in C57BL/6J mice. Diabetes. 1988;37:1163–1167. doi: 10.2337/diab.37.9.1163. [DOI] [PubMed] [Google Scholar]
- 4.Vincent AM, McLean LL, Backus C, Feldman EL. Short-term hyperglycemia produces oxidative damage and apoptosis in neurons. FASEB J. 2005;19:638–640. doi: 10.1096/fj.04-2513fje. [DOI] [PubMed] [Google Scholar]
- 5.Groop PH, Forsblom C, Thomas MC. Mechanisms of disease: Pathway-selective insulin resistance and microvascular complications of diabetes. Nat Clin Pract Endocrinol Metab. 2005;1:100–110. doi: 10.1038/ncpendmet0046. [DOI] [PubMed] [Google Scholar]
- 6.Robertson RP. Chronic oxidative stress as a central mechanism for glucose toxicity in pancreatic islet beta cells in diabetes. J Biol Chem. 2004;279:42351–42354. doi: 10.1074/jbc.R400019200. [DOI] [PubMed] [Google Scholar]
- 7.Pennathur S, Heinecke JW. Mechanisms for oxidative stress in diabetic cardiovascular disease. Antioxid Redox Signal. 2007;9:955–969. doi: 10.1089/ars.2007.1595. [DOI] [PubMed] [Google Scholar]
- 8.Maritim AC, Sanders RA, Watkins JB., III Diabetes, oxidative stress, and antioxidants: a review. J Biochem Mol Toxicol. 2003;17:24–38. doi: 10.1002/jbt.10058. [DOI] [PubMed] [Google Scholar]
- 9.Shertzer HG, Schneider SN, Kendig EL, Clegg DJ, D’Alessio DA, Genter MB. Acetaminophen normalizes glucose homeostasis in mouse models for diabetes. Biochem Pharmacol. 2008;75:1402–1410. doi: 10.1016/j.bcp.2007.12.003. [DOI] [PubMed] [Google Scholar]
- 10.Kendig EL, Schneider SN, Clegg DJ, Genter MB, Shertzer HG. Over-the-counter analgesics normalize blood glucose and body composition in mice fed a high fat diet. Biochem Pharmacol. 2008;76:216–224. doi: 10.1016/j.bcp.2008.05.001. [DOI] [PubMed] [Google Scholar]
- 11.Westerlund C, Ostlund-Lindqvist AM, Sainsbury M, Shertzer HG, Sjoquist PO. Characterization of novel indenoindoles. Part I. Structure-activity relationships in different model systems of lipid peroxidation. Biochem Pharmacol. 1996;51:1397–1402. doi: 10.1016/0006-2952(96)00080-9. [DOI] [PubMed] [Google Scholar]
- 12.Shertzer HG, Sainsbury M, Graupner PR, Berger ML. Mechanisms of chemical mediated cytotoxicity and chemoprotection in isolated rat hepatocytes. Chem-Biol Interact. 1991;78:123–141. doi: 10.1016/0009-2797(91)90009-v. [DOI] [PubMed] [Google Scholar]
- 13.Shertzer HG, Sainsbury M. Chemoprotective and hepatic enzyme induction properties of indole and indenoindole antioxidants in rats. Food Chem Toxicol. 1991;29:391–400. doi: 10.1016/0278-6915(91)90079-m. [DOI] [PubMed] [Google Scholar]
- 14.Shertzer HG, Sainsbury M, Reilman R, Warshawsky D. Retardation of benzo[a]pyrene-induced epidermal tumor formation by the potent antioxidant 4b,5,9b,10-tetrahydroindeno[1,2-b]indole. Cancer Lett. 1994;86:209–214. doi: 10.1016/0304-3835(94)90080-9. [DOI] [PubMed] [Google Scholar]
- 15.Devitt GP, Creagh EM, Cotter TG. The antioxidant 4b,5,9b,10-tetrahydroindeno[1,2-b]indole inhibits apoptosis by preventing caspase activation following mitochondrial depolarization. Biochem Biophys Res Commun. 1999;264:622–629. doi: 10.1006/bbrc.1999.1576. [DOI] [PubMed] [Google Scholar]
- 16.Brown DW, Graupner PR, Sainsbury M, Shertzer HG. New antioxidants incorporating indole and indoline chromophores. Tetrahedron. 1991;47:4383–4408. [Google Scholar]
- 17.Reeves PG, Nielsen FH, Fahey GC., Jr AIN-93 purified diets for laboratory rodents: final report of the American Institute of Nutrition ad hoc writing committee on the reformulation of the AIN-76A rodent diet. J Nutr. 1993;123:1939–1951. doi: 10.1093/jn/123.11.1939. [DOI] [PubMed] [Google Scholar]
- 18.Woods SC, Seeley RJ, Rushing PA, D’Alessio D, Tso P. A controlled high-fat diet induces an obese syndrome in rats. J Nutr. 2003;133:1081–1087. doi: 10.1093/jn/133.4.1081. [DOI] [PubMed] [Google Scholar]
- 19.Elder DA, Prigeon RL, Wadwa RP, Dolan LM, D’Alessio DA. Beta-cell function, insulin sensitivity, and glucose tolerance in obese diabetic and nondiabetic adolescents and young adults. J Clin Endocrinol Metab. 2006;91:185–191. doi: 10.1210/jc.2005-0853. [DOI] [PubMed] [Google Scholar]
- 20.Hoover-Plow J, Nelson B. Oxygen consumption in mice (I strain) after feeding. J Nutr. 1985;115:303–310. doi: 10.1093/jn/115.3.303. [DOI] [PubMed] [Google Scholar]
- 21.Tinsley FC, Taicher GZ, Heiman ML. Evaluation of a quantitative magnetic resonance method for mouse whole body composition analysis. Obes Res. 2004;12:150–160. doi: 10.1038/oby.2004.20. [DOI] [PubMed] [Google Scholar]
- 22.Senft AP, Dalton TP, Nebert DW, Genter MB, Puga A, Hutchinson RJ, Kerzee JK, Uno S, Shertzer HG. Mitochondrial reactive oxygen production is dependent on the aromatic hydrocarbon receptor. Free Radic Biol Med. 2002;33:1268–1278. doi: 10.1016/s0891-5849(02)01014-6. [DOI] [PubMed] [Google Scholar]
- 23.Shertzer HG, Clay CD, Genter MB, Chames MC, Schneider SN, Oakley GG, Nebert DW, Dalton TP. Uncoupling-mediated generation of reactive oxygen by halogenated aromatic hydrocarbons in mouse liver microsomes. Free Radic Biol Med. 2004;36:618–631. doi: 10.1016/j.freeradbiomed.2003.11.014. [DOI] [PubMed] [Google Scholar]
- 24.Shen D, Dalton TP, Nebert DW, Shertzer HG. Glutathione redox state regulates mitochondrial reactive oxygen production. J Biol Chem. 2005;280:25305–25312. doi: 10.1074/jbc.M500095200. [DOI] [PubMed] [Google Scholar]
- 25.Senft AP, Dalton TP, Nebert DW, Genter MB, Hutchinson RJ, Shertzer HG. Dioxin increases reactive oxygen production in mouse liver mitochondria. Toxicol Appl Pharmacol. 2002;178:15–21. doi: 10.1006/taap.2001.9314. [DOI] [PubMed] [Google Scholar]
- 26.Weir GC, Bonner-Weir S. Five stages of evolving beta-cell dysfunction during progression to diabetes. Diabetes. 2004;53(Suppl 3):S16–S21. doi: 10.2337/diabetes.53.suppl_3.s16. [DOI] [PubMed] [Google Scholar]
- 27.Ikemoto S, Thompson KS, Takahashi M, Itakura H, Lane MD, Ezaki O. High fat diet-induced hyperglycemia: prevention by low level expression of a glucose transporter (GLUT4) minigene in transgenic mice. Proc Natl Acad Sci USA. 1995;92:3096–3099. doi: 10.1073/pnas.92.8.3096. [DOI] [PMC free article] [PubMed] [Google Scholar]
- 28.Davidson SM, Duchen MR. Endothelial mitochondria: contributing to vascular function and disease. Circ Res. 2007;100:1128–1141. doi: 10.1161/01.RES.0000261970.18328.1d. [DOI] [PubMed] [Google Scholar]
- 29.Forbes JM, Cooper ME, Oldfield MD, Thomas MC. Role of advanced glycation end products in diabetic nephropathy. J Am Soc Nephrol. 2003;14:S254–S258. doi: 10.1097/01.asn.0000077413.41276.17. [DOI] [PubMed] [Google Scholar]
- 30.Stern DM, Yan SD, Yan SF, Schmidt AM. Receptor for advanced glycation endproducts (RAGE) and the complications of diabetes. Ageing Res Rev. 2002;1:1–15. doi: 10.1016/s0047-6374(01)00366-9. [DOI] [PubMed] [Google Scholar]
- 31.Genter MB, Amarnath V, Moody MA, Anthony DC, Anderson CW, Graham DG. Pyrrole oxidation and protein cross-linking as necessary steps in the development of gamma-diketone neuropathy. Chem Res Toxicol. 1988;1:179–185. doi: 10.1021/tx00003a009. [DOI] [PubMed] [Google Scholar]
- 32.Obrosova IG, Mabley JG, Zsengeller Z, Charniauskaya T, Abatan OI, Groves JT, Szabo C. Role for nitrosative stress in diabetic neuropathy: evidence from studies with a peroxynitrite decomposition catalyst. FASEB J. 2005;19:401–403. doi: 10.1096/fj.04-1913fje. [DOI] [PubMed] [Google Scholar]
- 33.Petersen KF, Befroy D, Dufour S, Dziura J, Ariyan C, Rothman DL, DiPietro L, Cline GW, Shulman GI. Mitochondrial dysfunction in the elderly: possible role in insulin resistance. Science. 2003;300:1140–1142. doi: 10.1126/science.1082889. [DOI] [PMC free article] [PubMed] [Google Scholar]
- 34.Shertzer HG, Genter MB, Shen D, Nebert DW, Chen Y, Dalton TP. TCDD decreases ATP levels and increases reactive oxygen production through changes in mitochondrial F(0)F(1)-ATP synthase and ubiquinone. Toxicol Appl Pharmacol. 2006;217:363–374. doi: 10.1016/j.taap.2006.09.014. [DOI] [PMC free article] [PubMed] [Google Scholar]
- 35.Pecqueur C, Alves-Guerra MC, Gelly C, Levi-Meyrueis C, Couplan E, Collins S, Ricquier D, Bouillaud F, Miroux B. Uncoupling protein 2, in vivo distribution, induction upon oxidative stress, and evidence for translational regulation. J Biol Chem. 2001;276:8705–8712. doi: 10.1074/jbc.M006938200. [DOI] [PubMed] [Google Scholar]
- 36.Evans JL. Antioxidants: do they have a role in the treatment of insulin resistance? Indian J Med Res. 2007;125:355–372. [PubMed] [Google Scholar]
- 37.Mouche S, Mkaddem SB, Wang W, Katic M, Tseng YH, Carnesecchi S, Steger K, Foti M, Meier CA, Muzzin P, Kahn CR, Ogier-Denis E, Szanto I. Reduced expression of the NADPH oxidase NOX4 is a hallmark of adipocyte differentiation. Biochim Biophys Acta. 2007;1773:1015–1027. doi: 10.1016/j.bbamcr.2007.03.003. [DOI] [PubMed] [Google Scholar]
- 38.Sautin YY, Nakagawa T, Zharikov S, Johnson RJ. Adverse effects of the classic antioxidant uric acid in adipocytes: NADPH oxidase-mediated oxidative/nitrosative stress. Am J Physiol Cell Physiol. 2007;293:C584–C596. doi: 10.1152/ajpcell.00600.2006. [DOI] [PubMed] [Google Scholar]
- 39.Furukawa S, Fujita T, Shimabukuro M, Iwaki M, Yamada Y, Nakajima Y, Nakayama O, Makishima M, Matsuda M, Shimomura I. Increased oxidative stress in obesity and its impact on metabolic syndrome. J Clin Invest. 2004;114:1752–1761. doi: 10.1172/JCI21625. [DOI] [PMC free article] [PubMed] [Google Scholar]