

Abstract
Impaired placento-fetal communication is a coherent symptom of exaggerated pre-eclampsia. The impact of the cellular expression of different glycosaminoglycans (GAGs) in this event on the placenta in pre-eclampsia is still obscure. This is the first study aimed at discovering the relationship between structural alterations of different sulfated GAGs at the molecular level and the development of pre-eclampsia in inflicted placenta. Sulfated GAGs were isolated and purified from control and pre-eclampsia placentas. The amount and the molecular weight of GAG in each tissue sample were measured. The polydispersity of the recovered GAG samples were determined by polyacrylamide gel electrophoresis. The disaccharide composition of chondroitin sulfate, dermatan sulfate and heparan sulfate were deduced by chondroitinase and heparinase depolymerization followed by liquid chromatography–mass spectrometry. The in vivo sulfo-modulation of GAGs in pre-eclampsia and control placenta were examined using RT-PCR to determine the transcription levels of different sulfotransferases involved in GAG biosynthesis. Marked differences in GAG sulfation patterns and mRNA level of encoding selected GAG O-sulfotransferases were observed in pre-eclampsia. These data suggest a linkage between pre-eclampsia and the observed alterations in placental GAGs and could provide new insights about the modulating role of GAGs in the development and the severity of placental pre-eclampsia.
Keywords: Pre-eclampsia, Placenta, Proteoglycans, Glycosaminoglycans, Glycomics
Introduction
GAGs such as chondroitin/dermatan sulfates (CS/DS) and heparan sulfate (HS) are complex, anionic polysaccharides expressed on the surface of virtually all animal cells. GAGs are highly negatively charged due to the presence of repeating disaccharides of glucuronic acid (GlcA) or iduronic acid (IdoA) and N-acetylgalactosamine (GalNAc), N-acetylglucosamine (GlcNAc) or N-sulfoglucosamine (GlcNSO3) residues modified with O-sulfo groups [1]. The biological roles of GAGs are quite diverse, controlling cell attachment and cell migration, fibrinogenesis and cell signaling [2]. Furthermore, GAGs also mediate viral infections, including herpesvirus, dengue virus and foot and mouth disease virus [1, 3, 4, 5, 6]. Cell surface heparan sulfate acts as a co-receptor by binding to virus envelope proteins during the initial steps of infection [7, 8]. GAGs are typically covalently linked to core proteins through serine residues to form proteoglycans (PGs) [1]. Despite an increased understanding of the roles of PGs in processes at the cell surface and in the extracellular matrix (ECM) during the early part of the last decade [9, 10], little is known about the placental structure of GAGs as contributing variables in the development of pre-eclampsia. PGs are distributed in placenta endothelium, cell basement membranes, vessel walls, and villous stroma [11, 12, 13]. Detailed characterizations indicate the placental basement membrane tissue predominantly contains HS PGs, whereas CS/DS PGs are mainly located in the intervillous space of the ECM [14]. Human placental PGs have been suggested to be involved in a number of conception anomalies.
Pre-eclampsia is a worldwide disease of the placenta affecting 3–5% of pregnant women [15] and results in impaired vascular homeostasis. The impact of GAG structure and function on the progression of pre-eclampsia remains an important question. The current study is aimed at improving the understanding the role of GAG structure on molecular level in the placenta during the development of pre-eclampsia, in particular to understand the role of the degree and pattern of sulfation.
This paper examines both the composition sulfated GAGs as well as the transcription level of mRNA encoding selected GAG biosynthetic enzymes in both normal and pre-eclampsia placenta. Pre-eclampsia is a major illness occurring during late pregnancy that involves the placenta, a new organ formed in the body of pregnant women. The introduction of trans-membrane communication between fetus and mother requires cellular selectivity together with swift delivery of chemokines and growth factors that rely on GAGs within the extracellular matrix. Thus, homeostasis, with sustained proper integrity of cellular glycocalyx, is essential for healthy placenta and its slippery and hydrophilic nature is impacted by GAG sulfation. Furthermore, abnormal uteroplacental vascular adaptation with concomitant ischemia is a common finding in altered early trophoblast invasion in pre-eclampsia [16]. HS exerts a modulating role during normal placental angiogenesis. HS, the constituent of up to 50% of the total expressed GAG in endothelial cells [17], is unique among GAGs in the ability to bind a large number of different proteins with complex role in the extracellular matrix, regulating a wide variety of biological process, including hemostasis, inflammation, angiogenesis, growth factors, cell adhesion [18], as well as serine proteinase-mediated tissue remodeling [19]. In the placenta, the endothelium functions as the interface between blood and the tissues and must be able to respond dynamically to its microenvironment in order to regulate the passage of cells into sub-endothelial tissues [20]. Therefore, the regulation (up or down) of the extent of HS sulfation within the endothelial microenvironment might represent a mechanism for balanced homeostasis in the developing placenta. Moreover, the GAGs involved extracellular matrix alteration may contribute to hemodynamic modulation, increasing large artery stiffness and if or increasing resistance in small peripheral arteries, thus playing a crucial role in development of pre-eclampsia [21].
Materials and methods
Sampling and materials
Two samples of placental tissues collected from each of six different patients (three healthy patients as control, and three patients with pre-eclampsia) were obtained at Inje University Hospital Busan, South Korea. Pre-eclampsia was defined as gestational hypertension (systolic blood pressure ≥140 mm Hg or diastolic blood pressure ≥90 mm Hg, arising after 20 weeks of gestation) that was accompanied with proteinuria. Normotensive, uncomplicated control subjects were matched for gestational age (within 2 weeks). PE and normal controls were transabdominally delivered. All Patients (PE or control) were free from any multiple gestations, chronic hypertension, diabetes, renal disease or other major metabolic disorders, or a history of illicit drug use. All women provided written informed consent before the collection of placenta samples. The collection and use of the samples were approved by the Institutional Review Board of the Inje University Busan Paik Hospital. These rigorous selection criteria limited the number of samples that could be collected. Placentas were immediately collected just after delivery from normal and PE patients. Since altered balance between proliferation and apoptosis in the placental villous trophoblast is a well known factor that triggers pre-eclampsia, we selected mainly the villous trophoblast enriched tissue. The maternal side of placentas was sampled near maternal surface, which was beyond halfway from the stem of the umbilical cord and just below the maternal decidua. The maternal deciduas, amnion and stem villous structures were removed and the villous trophoblast enriched tissue was obtained. After three successive saline washes with perfusion, samples were immediately frozen in liquid nitrogen and stored until use. The frozen samples were white to pink in color further demonstrating the removal of blood from these tissues in the washing steps. Histological examination was performed to exclude blood contamination and to confirm the presence of villous trophoblast in all samples (data not shown).
Actinase E was from Kaken Biochemicals (Tokyo, Japan). Chondroitin sulfate, chondroitin lyases ABC and ACII and heparin lyases 1, 2 and 3 were from Seikagaku (Tokyo, Japan). Polyacrylamide, urea, CHAPS, alcian blue dye, and tetra-n-butylammonium hydrogen sulfate, were from Sigma Chemical Company (St. Louis, MO). All other chemicals were of reagent grade. Vivapure Q MAXI H columns were from Viva science (Edgewood, NJ).
Unsaturated disaccharides standards of CS/DS (Di-0S ΔUA-GalNAc, Di-4S ΔUA-GalNAc4S, Di-6S ΔUA-GalNAc6S, Di-UA2S ΔUA2S-GalNAc, Di-diSB ΔUA2S-GalNAc4S, Di-diSD ΔUA 2S-GalNAc6S, Di-diSE ΔUA-GalNAc4S6S, Di-triS ΔUA2S-GalNAc4S6S) and unsaturated disaccharides standards of heparin/HS (Di-0S ΔUA-GlcNAc, Di-NS ΔUA-GlcNS, Di-6S ΔUA-GlcNAc6S, Di-UA2S ΔUA2S-GlcNAc, Di-UA2SNS ΔUA2S-GlcNS, Di-NS6S ΔUA-GlcNS6S, Di-UA2S6S ΔUA2S-GlcNAc6S, Di-triS ΔUA2S-GlcNS6S) were obtained from Seikagaku Corporation (Japan).
Isolation and purification of GAGs
Placenta samples were crushed with dry ice into very fine homogenized powder using a mortar and pestle. Fat was removed by washing the tissues with chloroform/methanol mixture of (2:1, 1:1, 1:2 (v/v)) each left overnight.
Defatted samples (in 5 ml water) were individually subjected to proteolysis at 55 °C with 1% of Actinase E (20 mg/ml) for 18 h. After the proteolysis, dry urea and dry CHAPS were added to each sample (2 wt.% in CHAPS and 8 M in urea). The resulting cloudy solutions were clarified by passing through a syringe filter containing a 0.2 μm membrane. A Vivapure Q MAXI H spin column was equilibrated with 3 ml of 8 M urea containing 2% CHAPS (pH 8.3). The clarified filtered samples were loaded onto and run through the Vivapure Q MAXI H spin columns under centrifugal force (500×g). The columns were first washed with 3 ml of 8 M urea containing 2% CHAPS at pH 8.3. The columns were then washed five times with 5 ml of 200 mM NaCl. GAGs were released from the spin column by washing three-times with 1 ml of 16% NaCl. Methanol (12 ml) was added to afford an 80 vol.% solution and the mixture was equilibrated at 4 °C for 18 h. The resulting precipitate was recovered by centrifugation (2,500×g) for 15 min. The precipitate was recovered by dissolving in 0.5 ml of water and the recovered GAGs were stored frozen for further analysis.
The recovery yield of GAG from placental tissue samples was next examined. Exogenous CS or HS (0, 50, 100, and 500 μg) was added to 1 gm of wet bovine brain tissue sample. Each sample was treated, as described above, and the concentration of total GAG was measured. The recovery of HS and CS was determined to be 100±2% and 96±17%, respectively.
Quantification of GAGs
The isolated GAGs were subjected to either carbazole assay [22] or Blyscan™ assay (Biodye Science, UK) (using 1, 9-dimethylmethylene blue (DMB) as the labeling dye) to quantify the amount of GAG in each sample using chondroitin sulfate as standard.
Polyacrylamide gel electrophoresis (PAGE) analysis
Polyacrylamide gel electrophoresis (PAGE) was applied to analyze the molecular weight and polydispersity of each GAGs sample. To each lane ~5 μg of isolated GAGs was subjected to electrophoresis against a standard composed of heparin oligosaccharides prepared enzymatically from bovine lung heparin. The alcian blue visualized gels were then digitized with UN-Scan-it software (Silk Scientific, UT, USA) and the average MW of the GAGs was calculated based on the heparin oligosaccharide standard [23].
Disaccharide composition analysis using LCMS
Enzymatic depolymerization of GAGs: The GAGs samples (20 μg/5μl) were incubated with the chondrontinase ABC (10 munits) and ACII (5 munits) at 37 °C for 10 h. The enzymatic products were recovered by centrifugal filtration (YM-3, 3000 MWCO, Millipore, Bedford, MA). CS/DS disaccharides, passed through the filter, were freeze-dried and ready for LC–MS analysis. Next, the heparinase I, II and III (5 munits each) were added into the remainder and incubated at 37 °C for 10 h. The products were also recovered by centrifugal filtration and the heparin/HS disaccharides were similarly collected and freeze-dried and ready for LC–MS analysis.
LC–MS analysis
The analysis was performed on a LC–MS system (Agilent, LC/MSD trap MS). Solution A and B for HPLC were 15 and 70% acetonitrile, respectively, containing the same concentration of 37.5 mM NH4HCO3 and 11.25 mM tributylamine. The pH values of them were adjusted to 6.5 with acetic acid. The flow rate was 10 μl/min. The separation was performed on a C-18 column (Agilent) using solution A for 20 min, followed by a linear gradient from 20 to 45 min of 0 to 50% solution B. The column effluent entered the source of the ESI–MS for continuous detection by MS. The electrospray interface was set in negative ionization mode with the skimmer potential −40.0 V, capillary exit −120.5 V and a source of temperature of 325 °C to obtain maximum abundance of the ions in a full scan spectra (150–1,500 Da, 10 full scans/s). Nitrogen was used as a drying (5 l/min) and nebulizing gas (20 p.s.i.). Auto MS/MS was turned on for MS/MS analysis.
Quantitative real-time PCR (qRT-PCR)
Changes in the mRNA levels of different GAGs synthesis controlling enzymes were examined using qRT-PCR. Total RNA was extracted from the normal as well as preeclampsia placenta using RNA Ambion RiboPure total RNA isolation kit. After treatment with deoxyribonuclease I (Takara Holdings Inc., Japan), total RNA was reverse-transcribed to cDNA using SuperScript II reverse transcriptase (Invitrogen, Carlsbad, CA, USA). QRT-PCR was then performed using the iCycler iQ system (Bio-Rad, Hercules, CA, USA). Primers were designed using the software Primer 3 (developed by Steve Rozen and Helen J. Skaletsky). All primers were designed using gene-specific sequences deposited in GenBank. Primer sequences are presented in Table 1. All primers including the house keeping gene were checked by preliminary PCR to confirm specificity and to exclude any non-specific amplification (data not shown). Total RNA was then extracted from the control and preeclampsia placentas using RNA Ambion RiboPure total RNA isolation kit. RNA (1 μg) of control and pre eclampsia was used. After treatment with deoxyribonuclease I (Takara Holdings Inc., Japan), total RNA was reverse-transcribed to cDNA using SuperScript II reverse transcriptase (Invitrogen, Carlsbad, CA, USA). qRT-PCR was then carried out for each transcript in a reaction mix of 4 μl of the cDNA, 1 μl of each of the primers, 5 μl of water and 10 μl iQ™ SYBR green Supermix (BIO-RAD, CA, USA). The PCR was then performed with an initial activation step at 95 °C for 10 min followed by 40 cycles amplification (denaturation: 94 °C for 20 s; annealing: 60 °C for 20 s and extension at 72 °C for 30 s) in a real time thermal cycler (iCycler™ iQ system, Bio-Rad, Hercules, CA, USA). The gene expression data were normalized to the GAPDH gene; as reference house keeping gene that used as an internal standard for the study. Normalization of data and calculation of results were performed as previously described [24].
Table 1.
The forward and reverse primers used for quantitative real-time PCR
| GenBank accession number | Primer sequence |
Predicted size (bp) | ||
|---|---|---|---|---|
| Forward | Reverse | |||
| Glyceraldehydes-3-phosphate dehydrogenase (GAPDH) | NM_002046.3 | 5’-ACCACAGTCCATGCCATCAC-3’ | 5’-TCCACCACCCTGTTGCTGTA-‘3 | 452 |
| Chondroitin 4-O-sulfotransferase 1 (C4OS) | NM_018413 | 5’-GTGGGGAGAGGGAGAGAATC-3’ | 5’-ACAGACAAGAACGACCCATC-3’ | 200 |
| Chondroitin 6-sulfotransferase (C6S) | NM_004273 | 5’-CCCAAAGTCAGAAAGCGAAG-3’ | 5’-ACAAGCAAACCCACCAACTC-3’ | 189 |
| Dermatan/chondroitin sulfate 2-sulfotransferase (CS2S) | NM_005715 | 5’-TCTGAGCCTGACCACAGATG-3’ | 5’-CACCTGCACAGAACTCAGGA-3’ | 153 |
| Heparan N-deacetylase/N-sulfotransferase-1 (NDST-1) | NM_001543 | 5’-CCCAGTGGCCCTAAAGTACA-3’ | 5’-GTCCATCACTTTGGCAGGTT-’ | 205 |
| Heparan sulfate 6-O-sulfotransferase 1 (HS6S) | NM_004807 | 5’-GTACAACCTGGCCAACAACC-3’ | 5’-CGCGTGCTATTGTACTGCAT-3’ | 243 |
Results
Isolation and purification of GAGs
Three control and pre-eclampsia tissue samples taken from two groups of individuals with nearly identical case histories were collected to minimize variability. Blood was carefully removed from each sample to avoid contamination of tissue with the small amount of GAG present in human blood [25]. A protocol established to quantitatively isolate heparin from human plasma [26] using a simple three-step procedure involving protease digestion, strong-anion-exchange chromatography on a spin column followed by salt release and methanol precipitation was applied to recover sulfated GAGS from those placenta tissues. GAGs having a low sulfation level (0.5–1 sulfo groups/disaccharide) could be recovered in high yield (96–100%) from bovine tissue samples using this procedure.
Quantification of GAGs by Blyscan assay
The isolated GAGs were subjected to Blyscan assay to quantify the amount of GAGs. As shown in Table 2, the average contents of GAGs (mg/g dry sample) were 2.78±0.48 mg/g and 2.26±0.21 mg/g in control and pre-eclampsia samples, respectively.
Table 2.
Quantification of isolated GAGs by Blyscan assay
| Sample description | Fresh weight (g) | Dry weight (g) | GAGs (mg) | GAGs (mg)/g dry tissue | MW (kDa) |
|---|---|---|---|---|---|
| Normal control A | 0.973 | 0.109 | 0.205 | 1.87 | 8.4 |
| Normal control A | 1.08 | 0.114 | 0.305 | 2.68 | 8.7 |
| Average of two samples | 1.03 | 0.112 | 0.255 | 2.28 | 8.5 |
| Normal control B | 0.78 | 0.082 | 0.226 | 2.77 | 10.3 |
| Normal control B | 0.73 | 0.081 | 0.283 | 3.49 | 10.0 |
| Average of two samples | 0.75 | 0.081 | 0.255 | 3.13 | 10.1 |
| Normal control C | 0.77 | 0.070 | 0.197 | 2.84 | 10.0 |
| Normal control C | 0.55 | 0.063 | 0.190 | 3.00 | 10.0 |
| Average of two samples | 0.66 | 0.066 | 0.193 | 2.92 | 10.0 |
| Mean±SD | 0.81±0.19 | 0.09±0.02 | 0.23±0.05 | 2.78±0.53 | 9.57±0.80 |
| Pre-eclampsia patient D | 1.26 | 0.109 | 0.211 | 1.94 | 9.3 |
| Pre-eclampsia patient D | 1.1 | 0.099 | 0.233 | 2.35 | 9.7 |
| Average of two samples | 1.18 | 0.104 | 0.222 | 2.14 | 9.5 |
| Pre-eclampsia patient E | 0.795 | 0.094 | 0.200 | 2.13 | 9.6 |
| Pre-eclampsia patient E | 0.93 | 0.109 | 0.229 | 2.10 | 9.7 |
| Average of two samples | 0.863 | 0.101 | 0.215 | 2.11 | 9.7 |
| Pre-eclampsia patient F | 1.18 | 0.116 | 0.287 | 2.47 | 9.3 |
| Pre-eclampsia patient F | 1.05 | 0.116 | 0.295 | 2.54 | 9.3 |
| Average of two samples | 1.11 | 0.116 | 0.291 | 2.50 | 9.3 |
| Mean±SD | 1.05±0.17 | 0.11±0.01 | 0.24±0.04 | 2.26±0.24 | 9.48±0.20 |
Polyacrylamide gel electrophoresis (PAGE) analysis
GAGs recovered from the placenta samples were next analyzed by PAGE with Alcian blue staining (Fig. 1). The PAGE showed that all the GAGs having a broad band and a polydispersity. After digitizing the gels, the average MW of GAGs were calculated based on the heparin oligosaccharide standard (Fig. 1). As shown in Table 2, the average MW of GAGs from control and pre-eclampsia samples were 9.57±0.73 kDa and 9.48±0.19 kDa, respectively.
Fig. 1.
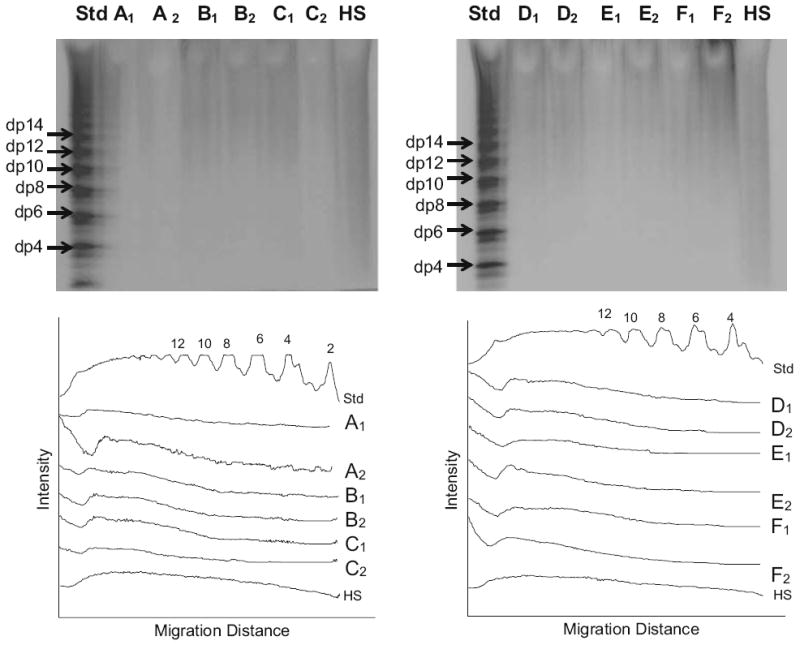
PAGE analysis on GAGs isolated from different tissues. Two gels are shown in the upper panels. Lanes (Std) are the heparin oligosaccharide standard. Lanes 1 to 12 are correspondence to GAGs from duplicate (i.e., A1, A2) samples (see Table 2). Lanes (HS) are heparan sulfate control. The lower panels show scanned data from each gel used to calculate the molecular weight of each GAG sample [23]
Disaccharide composition analysis of isolated GAGs
Heparin/heparan sulfate (HS) GAGs are comprised of eight repeating disaccharide sequences. As a result, exhaustive enzymatic digestion of HS can produce up to eight different unsaturated disaccharides: ΔUA-GlcNAc, ΔUA-GlcNS, ΔUA-GlcNAc6S, ΔUA2S-GlcNAc, ΔUA-GlcNS6S, ΔUA2S-GlcNS, ΔUA2S-GlcNAc6S, and ΔUA2S-GlcNS6S (where ΔUA is Δ-deoxy-α-l-threo-hex-4-enopyranosyl uronic acid, GlcN is glucosamine, Ac is acetyl, S is sulfo). Similarly, CS/DS also is comprised of variable sequences from which up to eight disaccharides can be obtained: ΔUA-GalNAc, ΔUA-GalNAc4S, ΔUA-GalNAc6S, ΔUA2S-GalNAc, ΔUA2S-GalNAc4S, ΔUA2S-GalNAc6S, ΔUA-GalNAc4S6S, ΔUA2S-GalNAc4S6S. Composition analysis of these disaccharides gives important structural information on the GAGs being analyzed and is an efficient method to measure the variation of structures of GAGs derived from different tissues.
A novel LC/MS method was developed to analyze the disaccharide composition of GAGs in our lab. The ion-paring reverse phase capillary HPLC gave good resolution of eight standard heparin/HS disaccharides (Fig. 2d), their MS spectra were obtained with ESI microspray MS [27]. LC/MS/MS was also applied on CS/DS disaccharides to unambiguously identify all of these disaccharides.
Fig. 2.
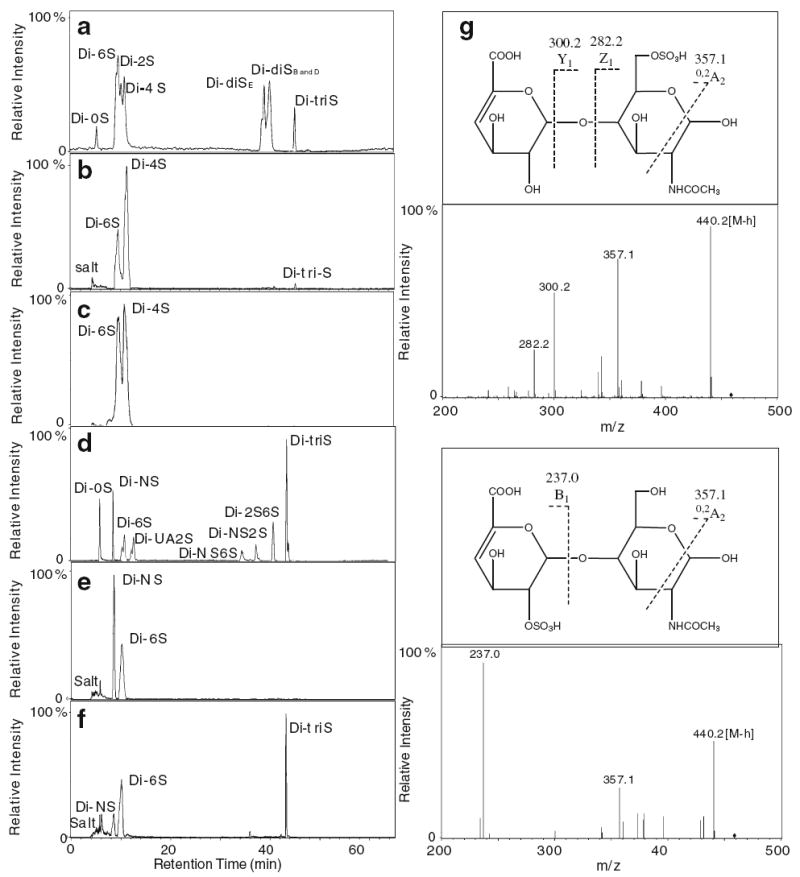
Analysis of GAG disaccharides. Ion-pairing chromatography of CS/DS and Hp/HS disaccharides. a 8 disaccharide standards of CS/DS; b disaccharides of CS/DS from one sample (4) of the control group. c disaccharides of CS/DS from a representative sample (11) of the pre-eclampsia group; d 8 disaccharide standards of Hp/HS; e disaccharides of Hp/HS from one sample (4) of the control group. f disaccharides of Hp/HS from a representative (11) of the pre-eclampsia group. g structure and MS/MS of the 6S and UA2S Hp/HS disaccharides
In this disaccharide composition analysis, CS/DS was digested with chondroitin lyases prior to digestion with heparin lyases. The CS disaccharides, determined from control and pre-eclampsia placenta, are presented in Fig. 2a–c and Table 3. It is noteworthy that the CS/DS, present in either diseased or control samples, gave rise to little or no unsulfated disaccharide. Monosulfated 6-O-sulfo sequences significantly increase while 2-O-sulfo sequences decrease in pre-eclampsia. It is also noteworthy that trisulfated sequences containing 2,4,6-sulfo groups decrease in pre-eclampsia. HS disaccharide analysis (Fig. 2d–f and Table 3) shows a significant decrease in NS and increases in 6-O- and 2-N monosulfated disaccharides in pre-eclampsia placenta. The position of the sulfo groups on these disaccharides was deduced from their retention times (based on disaccharide standards) and confirmed using MS/MS analysis (Fig. 2g). Interestingly, pre-eclampsia placenta shows a significant increase in disulfated UA2SNS and an increase in trisulfated disaccharide.
Table 3.
Disaccharide composition analysis (average and SD)
| Disaccharide composition analysis | |||||||||
|---|---|---|---|---|---|---|---|---|---|
| CS disaccharide | 0S | 6S | UA2S | 4S | diSE | diSD or B | triS | ||
| Control | Average | 0.7% | 28.4% | 8% | 59.9% | n.d. | n.d. | 2.98% | |
| ±SD | 0.7% | 0.7% | 10.3% | 11.8% | – | – | 3.1% | ||
| Pre-eclampsia | Average | n.d. | 41.5% | n.d. | 58.1% | n.d. | n.d. | 0.3% | |
| ±SD | – | 6.3% | – | 5.9% | – | – | 0.3% | ||
| Hp/HS disaccharide | 0S | NS | 6S | UA2S | UA2SNS | NS6S | UA2S6S | triS | |
| Control | Average | n.d. | 60.8% | 37.5% | 0.8% | n.d. | n.d. | n.d. | n.d. |
| ±SD | – | 16.9% | 16.5% | 1.4% | – | – | – | – | |
| Pre-eclampsia | Average | n.d. | 21.8% | 58.6% | 4.9% | 2.4% | n.d. | n.d. | 12.4% |
| ±SD | – | 10.5% | 14.2% | 3.6% | 1.7% | – | – | 14.2% | |
n.d. not detected
Quantitative real-time PCR (qRT-PCR)
Combined detection of level of mRNA encoding for different GAGs synthesizing enzymes with the GAG disaccharide analysis was performed in control and pre-eclampsia affected placenta. RT-PCR has proven to be a powerful method for the sensitive detection of mRNA levels [28, 29, 30]. It is clear from the RT-PCR results (Table 4) that there was marked decrease in the expression of the selected CS/DS and HS O-sulfotransferases examined in pre-eclampsia samples compared with that in control placenta. However, in preeclampsia placenta, NDST-1 N-sulfotransfersase showed an increase in its level of mRNAc.
Table 4.
Quantitative analysis of the relative changes in mRNA expression levels of different GAGs synthesizing enzymes using qRT-PCR in placenta of pre-eclampsia affected women
| Gene | CTa | ΔCTb | ΔΔCTc | Expression relative to controld | ||
|---|---|---|---|---|---|---|
| Chondroitin 4-O-sulfotransferase 1 (C4ST) | ||||||
| Pre-eclampsia | GAPDH | 16.54±0.38 | 5.25±0.61 | 1.35 | 0.39 | |
| C4OS | 21.79±0.24 | |||||
| Control | GAPDH | 17.43±0.17 | 3.9±0.25 | |||
| C4OS | 21.33±0.18 | |||||
| Chondroitin 6-O-sulfotransferase (C6ST) | ||||||
| Pre-eclampsia | GAPDH | 16.54±0.38 | 7.913±0.45 | 2.9 | 0.134 | |
| C6S | 24.45±0.61 | |||||
| Control | GAPDH | 17.43±0.17 | 5±0.6 | |||
| C6S | 22.43±0.43 | |||||
| Dermatan/chondroitin sulfate 2-O-sulfotransferase (C2ST) | ||||||
| Pre-eclampsia | GAPDH | 16.54±0.38 | 8.45±0.64 | 2.3 | 0.2 | |
| CS2S | 24.99±0.49 | |||||
| Control | GAPDH | 17.43±0.17 | 6.15±0.70 | |||
| CS2S | 23.58±0.53 | |||||
| Heparan N-deacetylase/N-sulfotransferase-1 (NDST-1) | ||||||
| Pre-eclampsia | GAPDH | 16.54±0.38 | 3.85±0.29 | -0.167 | 1.123 | |
| HDS-1 | 20.53±0.48 | |||||
| Control | GAPDH | 17.43±0.17 | 4.02±1.03 | |||
| HDS-1 | 21.45±0.86 | |||||
| Heparan sulfate 6-O-sulfotransferase 1 (HS6ST) | ||||||
| Pre-eclampsia | GAPDH | 16.54±0.38 | 7.21±1.29 | 1.78 | 0.29 | |
| HS6S | 23.75±1.12 | |||||
| Control | GAPDH | 17.43±0.17 | 5.43±1.02 | |||
| HS6S | 22.87±0.85 | |||||
The average of the CT data for each sample
The ΔCT value is calculated by the subtraction of the GAPDH CT from each sample CT
The ΔΔCT value is calculated by subtraction of the control ΔCT from each pre-eclampsia sample ΔCT
The expression relative to control is calculated using the equation 2−ΔΔ CT
Discussion
The molecular composition of sulfated GAGs in preeclampsia affected placenta has not been previously studied. It is noteworthy that the absolute amount of sulfated GAGs and their average molecular weight did not significantly change as the result of pre-eclampsia. Thus, we turned our attention to the analysis of GAG fine structure and selected biosynthetic enzymes responsible for this fine structure. The failure of Northern blotting to detect different GAG synthesizing enzymes [31], suggests that the messages encoding these biosynthetic enzymes are either expressed at low levels or are rapidly turned over. RT-PCR has proven to be a powerful method for the sensitive detection of mRNA levels [28, 29, 30]. The level of mRNA encoding for selected GAG O-sulfotransferases in placenta was depressed during pre-eclampsia. This decreased message level is consistent with our hypothesis linking altered placental glycomics to the development of pre-eclampsia. Next, we examined whether these decreased message levels resulted in decreased enzyme activities affording structural changes in sulfated GAGs directly contributing to the development of pre-eclampsia.
HS chain synthesis is initiated in the Golgi through the formation of tetrasaccharide linkage region, GlcA(β1–3) Gal(β1–3)Gal(β1–4)Xyl(β1–4) (where Gal is galactose and Xyl is xylose), attached to serine residues of a protein core. Polymerization of GlcNAc–GlcA copolymer onto this tetrasaccharide results from the action of glycosyltransferases. Next, a portion of the polymer is N-deacetylated and then N-sulfated by one of the four isoforms of the bifunctional enzyme, N-deacetylase/N-sulfotransferase (NDST) [32]. NDST1 and NDST2 are the most widely expressed with overlapping expression patterns. These enzymes are encoded by two genes and afford the first blocks of N-sulfation upon which other enzymes act. Thus, the content of N-sulfo groups profoundly impact subsequent downstream modification of HS by O-sulfotransferases [10, 31]. NDST-1 mRNA expression increases during pre-eclampsia, a possible sign of inflammation. In HS, however, the total level of N-sulfation decreases, suggesting that either another NDST isoform plays a dominant role or that the functional levels of NDST-1 enzyme in the Golgi do not correlate with mRNA levels. Further studies are required to understand these results.
CS PGs are abundantly present in the connective tissues [33] as components of extracellular matrices and the cell surface, but do not contain N-sulfo groups. The CS backbone is cooperatively synthesized as a copolymer of GlcA and GalNAc by the chondroitin synthase and chondroitin polymerizing factor, [34]. The modifications adding sulfate groups to CS include 4-O-sulfation or 6-O-sulfation on GalNAc, and 2-O-sulfation on GlcUA or IdoUA (following C5 epimerization of GlcUA to IdoUA) [35, 36]. The transcript levels of these biosynthetic enzymes are also not entirely predictive of the final GAG structure. This discrepancy can result from the imprecise correlation between mRNA levels and active sulfotransferase levels, other regulatory or transport proteins within the Golgi or the activity of additional sulfotransferase isoforms not examined in the current study. For example, the observed decrease in mRNA expression of chondroitin 4-O-sulfotransferase 1 (C4ST) in pre-eclampsia might be compensated for by an alternate GalNAc-4-O-sulfotransferase, such as C4ST-2, and D4ST-1, which also transfer sulfate to the C-4 hydroxyl of internal β1-4-linked GalNAc moieties within the repeating disaccharide sequences found in CS and DS [37, 38]. Other contributory factors that impact the final level of GAG sulfation include the durability and post-translation modifications of GAG synthesizing enzymes, as well as GAG catabolism, which is largely dependent on phagocytosis and lysosomal uptake. GAGs generally have half-life of 10 days [39], which is far longer than their synthesizing enzymes transcriptomes. Moreover, it is possible that the increased level of 6-O-sulfo groups in CS and HS, despite the decreased levels of mRNA encoding for the corresponding 6-OSTs, might result from a decrease in endo-6-sulfatase levels in pre-eclampsia placenta.
Human placenta contains a large quantity of extracellular GAGs associated with the aggrecan family CS PGs. These CS PGs are predominantly localized in the intervillous space [14, 40]. The CS chains of the placental CS PGs were shown to have almost 90% nonsulfated disaccharide residues [14]. Our results, however, surprisingly demonstrate that the non-sulfated population of CS/DS is less than 1% in normal placenta, with CS/DS 4-O-sulfate constituting the majority of placental CS/DS. This difference between our results and that of others might be attributable to our improved ability to distinguish unsulfated CS/DS disaccharides from hyaluronan disaccharides. Alternatively, there may be substantial quantities of nonsulfated chondroitin chains that are simply not recovered by our extraction and purification method. The level of trisulfated CS/DS is markedly reduced in pre-eclampsia but the reason for the relationship is unclear. An additional interesting and potentially important finding revealed in this investigation is that CS disaccharide composition analysis showed absence of UA2S in pre-eclampsia, which is supported by the parallel decrease in mRNA encoding for dermatan/chondroitin sulfate 2-sulfotransferase (CS-2OST). This result correlates well with the mRNA data, since this enzyme has only one isoform in most of the genome-sequenced organisms, in contrast to multiple isoforms for almost all other HS and CS sulfotransferases [39]. CS-2OST transfers the sulfo group to the 2-OH position of the hexuronic acid that is adjacent to an N-acetylated galactosamine residue (GalNAc) carrying either a 6-O or 4-O sulfo group [41, 42] and CS chains with 2-O-sulfo group exhibits a variety of biological functions [43, 44, 45]. In pre-eclampsia, the absence of 2-O-sulfo groups may reflect the fine tuning of CS chain that normally occurs in gravid placenta.
The current study demonstrates that pre-eclampsia is associated with altered mRNA levels of placental selected GAG sulfotransferases and observed changes in GAG structure at the disaccharide level. Additional studies will be required to correlate mRNA levels with the activity of these and other GAG biosynthetic enzymes. The current study suggests that an altered placental glycome may either cause or result from the development from pre-eclampsia. This opens an insight of possible relationship altered glycome intermittent anoxia, a common profound reason of pre-eclampsia, may be important in future studies to ensure a healthy pregnancy.
Acknowledgments
This work was supported by the National Institute of Health (Grants HL62244 and GH38060 to RL) and the Korea Science and Engineering Foundation (KOSEF) Grant funded by the Korean Government (MOST; nos. R0A-2007-000-20085-0 and R13-2007-023-00000-0).
References
- 1.Esko JD, Selleck SB. Order out of chaos: assembly of ligand binding sites in heparan sulfate. Annu Rev Biochem. 2002;71:435–471. doi: 10.1146/annurev.biochem.71.110601.135458. [DOI] [PubMed] [Google Scholar]
- 2.Hibino S, Shibuya M, Engbring JA, Mochizuki M, Nomizu M, Kleinman HK. Identification of an active site on the laminin alpha5 chain globular domain that binds to CD44 and inhibits malignancy. Cancer Res. 2004;64:4810–4806. doi: 10.1158/0008-5472.CAN-04-0129. [DOI] [PubMed] [Google Scholar]
- 3.Gillet L, Adler H, Stevenson PG. Glycosaminoglycan interactions in murine gammaherpesvirus-68 infection. PLoS ONE. 2007;4(2):e347. doi: 10.1371/journal.pone.0000347. [DOI] [PMC free article] [PubMed] [Google Scholar]
- 4.Fry EE, Stuart DI, Rowlands DJ. The structure of foot-and-mouth disease virus. Curr Top Microbiol Immunol. 2005;288:71–101. doi: 10.1007/3-540-27109-0_4. [DOI] [PubMed] [Google Scholar]
- 5.Allain F, Vanpouille C, Carpentier M, Slomianny M, Durieux S, Spik G. Interaction with glycosaminoglycans is required for cyclophilin B to trigger integrin-mediated adhesion of peripheral blood T lymphocytes to extracellular matrix. PNAS. 2002;99:2714–2719. doi: 10.1073/pnas.052284899. [DOI] [PMC free article] [PubMed] [Google Scholar]
- 6.Warda M, Marks RM, Linhardt RJ. Patents related to dengue virus infection. Expert Opin Ther Pat. 2002;12:1127–1143. [Google Scholar]
- 7.Hilgard P, Stockert R. Heparan sulfate proteoglycans initiate dengue virus infection of hepatocytes. Hepatology. 2000;32:1069–1077. doi: 10.1053/jhep.2000.18713. [DOI] [PubMed] [Google Scholar]
- 8.Hung SL, Lee PL, Chen HW, Chen LK, Kao CL, King CC. Analysis of the steps involved in Dengue virus entry into host cells. Virology. 1999;257:156–167. doi: 10.1006/viro.1999.9633. [DOI] [PubMed] [Google Scholar]
- 9.Iozzo RV. Matrix proteoglycans: from molecular design to cellular function. Annu Rev Biochem. 1998;67:609–652. doi: 10.1146/annurev.biochem.67.1.609. [DOI] [PubMed] [Google Scholar]
- 10.Bernfield M, Götte M, Park PW, Reizes O, Fitzgerald ML, Lincecum J, Zako M. Functions of cell surface heparan sulfate proteoglycans. Annu Rev Biochem. 1999;68:729–777. doi: 10.1146/annurev.biochem.68.1.729. [DOI] [PubMed] [Google Scholar]
- 11.Yang X, Hu Z, Chan SY, Chan E, Goh BC, Duan W, Zhou S. Agents that potentially inhibit irinotecan-induced diarrhea. Curr Med Chem. 2005;12:1343–1358. doi: 10.2174/0929867054020972. [DOI] [PubMed] [Google Scholar]
- 12.Li ZY, Hirayoshi K, Suzuki Y. Expression of N-deacetylase/sulfotransferase and 3-O-sulfotransferase in rat alveolar type II cells. Am J Physiol Lung Cell Mol Physiol. 2000;279:292–301. doi: 10.1152/ajplung.2000.279.2.L292. [DOI] [PubMed] [Google Scholar]
- 13.Leushner JR, Tevaarwerk GJ, Clarson CL, Harding PG, Chance GW, Haust MD. Analysis of the collagens of diabetic placental villi. Cell Mol Biol. 1986;32:27–35. [PubMed] [Google Scholar]
- 14.Achur RN, Valiyaveettil M, Alkhalil A, Ockenhouse CF, Gowda DC. Characterization of proteoglycans of human placenta and identification of unique chondroitin sulfate proteoglycans of the intervillous spaces that mediate the adherence of plasmodium falciparum-infected erythrocytes to the placenta. J Biol Chem. 2000;275:40344–40356. doi: 10.1074/jbc.M006398200. [DOI] [PubMed] [Google Scholar]
- 15.Walker JJ. Pre-eclampsia. Lancet. 2000;356:1260–1265. doi: 10.1016/S0140-6736(00)02800-2. [DOI] [PubMed] [Google Scholar]
- 16.Brown MA. The physiology of pre-eclampsia. Clin Exp Pharmacol Physiol. 1995;20:781–791. doi: 10.1111/j.1440-1681.1995.tb01937.x. [DOI] [PubMed] [Google Scholar]
- 17.Cockwell P, Adams DH, Savage CO. Glycosaminoglycans contribute to multiple functions of vascular endothelial cells. Clin Exp Immunol. 1996;104:1–3. doi: 10.1046/j.1365-2249.1996.d01-638.x. [DOI] [PMC free article] [PubMed] [Google Scholar]
- 18.Capila I, Linhardt RJ. Heparin–protein interactions. Angew Chem Int Ed. 2002;41:390–412. doi: 10.1002/1521-3773(20020201)41:3<390::aid-anie390>3.0.co;2-b. [DOI] [PubMed] [Google Scholar]
- 19.Kainulainen V, Wang H, Schick C, Bernfield M. Syndecans, heparan sulfate proteoglycans, maintain the proteolytic balance of acute wound fluids. J Biol Chem. 1998;273:11563–11569. doi: 10.1074/jbc.273.19.11563. [DOI] [PubMed] [Google Scholar]
- 20.Rix DA, Douglas MS, Talbot D, Dark JH, Kirby JA. Role of glycosaminoglycans (GAGs) in regulation of the immunogenicity of human vascular endothelial cells. Clin Exp Immunol. 1996;104:60–65. doi: 10.1046/j.1365-2249.1996.d01-641.x. [DOI] [PMC free article] [PubMed] [Google Scholar]
- 21.Uchida N, Mori A, Togo A, Ishiguro Y, Mikami M. Uteroplacental circulation, preeclampsia, and maternal abdominal aortic stiffness in normal and compromised pregnancies. J Perinat Med. 2007;35:119–125. doi: 10.1515/JPM.2007.038. [DOI] [PubMed] [Google Scholar]
- 22.Bitter T, Muir HM. A modified uronic acid carbazole reaction. Anal Biochem. 1962;4:330–334. doi: 10.1016/0003-2697(62)90095-7. [DOI] [PubMed] [Google Scholar]
- 23.Edens RE, Hakim A, Weiler JM, Rethwisch DG, Fareed J, Linhardt RJ. Gradient polyacrylamide gel electrophoresis for determination of the molecular weight of heparin preparations and low molecular-weight heparin derivates. J Pharm Sci. 1992;81:823–827. doi: 10.1002/jps.2600810821. [DOI] [PubMed] [Google Scholar]
- 24.Livak KJ, Schmittgen TD. Analysis of relative gene expression data using real-time quantitative PCR and the 2−ΔΔCT method. Methods. 2001;25:402–408. doi: 10.1006/meth.2001.1262. [DOI] [PubMed] [Google Scholar]
- 25.Mousa SA, Zhang F, Aljada A, Chaturvedi S, Takieddin M, Zhang H, Chi L, Arbit E, Castelli MC, Goldberg MM, Linhardt RJ. Pharmacokinetics and pharmacodynamics of oral heparin solid dosage form in healthy human subjects. J Clin Pharmacol. 2007 doi: 10.1177/0091270007307242. in press. [DOI] [PMC free article] [PubMed] [Google Scholar]
- 26.Zhang F, Sun P, Munoz E, Chi L, Sakai S, Toida T, Zhang H, Mousa S, Linhardt RJ. Microscale isolation and analysis of heparin from plasma using an anion exchange spin column. Anal Biochem. 2006;353:284–286. doi: 10.1016/j.ab.2006.01.040. [DOI] [PMC free article] [PubMed] [Google Scholar]
- 27.Thanawiroon C, Rice KG, Toida T, Linhardt RJ. LC/MS Sequencing of highly sulfated heparin-derived oligosaccharides. J Biol Chem. 2004;279:2608–2615. doi: 10.1074/jbc.M304772200. [DOI] [PubMed] [Google Scholar]
- 28.Murphy LD, Herzog CE, Rudick JB, Fojo AT, Bates SE. Use of the polymerase chain reaction in the quantitation of mdr-1 gene expression. Biochemistry. 1990;29:10351–10356. doi: 10.1021/bi00497a009. [DOI] [PubMed] [Google Scholar]
- 29.Horikoshi T, Danenberg KD, Stadlbauer TH, Volkenandt M, Shea LC, Aigner K, Gustavsson B, Leichman L, Frosing R, Ray M. Quantitation of thymidylate synthase, dihydrofolate reductase, and DT-diaphorase gene expression in human tumors using the polymerase chain reaction. Cancer Res. 1992;52:108–116. [PubMed] [Google Scholar]
- 30.Winer J, Jung CK, Shackel I, Williams PM. Development and validation of real-time quantitative reverse transcriptase-polymerase chain reaction for monitoring gene expression in cardiac myocytes in vitro. Anal Biochem. 1999;270:41–49. doi: 10.1006/abio.1999.4085. [DOI] [PubMed] [Google Scholar]
- 31.Carter NM, Ali S, Kirby JA. Endothelial inflammation: the role of differential expression of N-deacetylase/N-sulphotransferase enzymes in alteration of the immunological properties of heparan sulphate. J Cell Sci. 2003;116:3591–3600. doi: 10.1242/jcs.00662. [DOI] [PubMed] [Google Scholar]
- 32.Aikawa J, Grobe K, Tsujimoto M, Esko JD. Multiple isozymes of heparan sulfate/heparin GlcNAc N-deacetylase/GlcN N-sulfotransferase. Structure and activity of the fourth member, NDST4. J Biol Chem. 2001;276:5876–5882. doi: 10.1074/jbc.M009606200. [DOI] [PubMed] [Google Scholar]
- 33.Ruoslahti E. Structure and biology of proteoglycans. Annu Rev Cell Biol. 1988;4:229–255. doi: 10.1146/annurev.cb.04.110188.001305. [DOI] [PubMed] [Google Scholar]
- 34.Kitagawa H, Izumikawa T, Uyama T, Sugahara K. Molecular cloning of a chondroitin polymerizing factor that cooperates with chondroitin synthase for chondroitin polymerization. J Biol Chem. 2003;278:23666–23671. doi: 10.1074/jbc.M302493200. [DOI] [PubMed] [Google Scholar]
- 35.Kusche-Gullberg M, Kjellen L. Sulfotransferases in glycosaminoglycan biosynthesis. Curr Opin Struct Biol. 2003;13:605–611. doi: 10.1016/j.sbi.2003.08.002. [DOI] [PubMed] [Google Scholar]
- 36.Sugahara K, Mikami T, Uyama T, Mizuguchi S, Nomura K, Kitagawa H. Sulfotransferases in glycosaminoglycan biosynthesis. Curr Opin Struct Biol. 2003;13:612–620. doi: 10.1016/j.sbi.2003.09.011. [DOI] [PubMed] [Google Scholar]
- 37.Evers MR, Xi G, Kang HG, Schachner M, Baenziger JU. Molecular cloning and characterization of a dermatan-specific N-acetylgalactosamine 4-O-sulfotransferase. J Biol Chem. 2001;276:36344–36353. doi: 10.1074/jbc.M105848200. [DOI] [PubMed] [Google Scholar]
- 38.Yamauchi S, Mita S, Matsubara T, Fukuta M, Habuchi H, Kimata K, Habuchi O. Molecular cloning and expression of chondroitin 4-sulfotransferase. J Biol Chem. 2000;275:8975–8981. doi: 10.1074/jbc.275.12.8975. [DOI] [PubMed] [Google Scholar]
- 39.McLaughlin C, Reichenbecher VE. Glycosaminoglycans and glycoproteins. 3. Lippincott’s Williams and Wilkins Biochem. Illust; 2005. [Google Scholar]
- 40.Muthusamy A, Achur RN, Bhavanandan VP, Fouda GG, Taylor DW, Gowda DC. Plasmodium falciparum-infected erythrocytes adhere both in the intervillous space and on the villous surface of human placenta by binding to the low-sulfated chondroitin sulfate proteoglycan receptor. Am J Pathol. 2004;164:2013–2025. doi: 10.1016/S0002-9440(10)63761-3. [DOI] [PMC free article] [PubMed] [Google Scholar]
- 41.Kobayashi M, Sugumaran G, Liu J, Shworak NW, Silbert JE, Rosenberg RD. Molecular cloning and characterization of a human uronyl 2-sulfotransferase that sulfates iduronyl and glucuronyl residues in dermatan/chondroitin sulfate. J Biol Chem. 1999;274:10474–10480. doi: 10.1074/jbc.274.15.10474. [DOI] [PubMed] [Google Scholar]
- 42.Ohtake S, Kimata K, Habuchi O. Recognition of sulfation pattern of chondroitin sulfate by uronosyl 2-O-sulfotransferase. J Biol Chem. 2005;280:39115–39123. doi: 10.1074/jbc.M508816200. [DOI] [PubMed] [Google Scholar]
- 43.Bao X, Pavão MSG, dos Santos JC, Sugahara K. A functional dermatan sulfate epitope containing iduronate (2-O-sulfate)alpha1–3GalNAc(6-O-sulfate) disaccharide in the mouse brain: demonstration using a novel monoclonal antibody raised against dermatan sulfate of ascidian Ascidia nigra. J Biol Chem. 2005;280:23184–23193. doi: 10.1074/jbc.M503036200. [DOI] [PubMed] [Google Scholar]
- 44.Hikino M, Mikami T, Faissner A, Vilela-Silva A, Pavão MS, Sugahara K. Oversulfated dermatan sulfate exhibits neurite outgrowth-promoting activity toward embryonic mouse hippocampal neurons: implications of dermatan sulfate in neuritogenesis in the brain. J Biol Chem. 2003;278:43744–43754. doi: 10.1074/jbc.M308169200. [DOI] [PubMed] [Google Scholar]
- 45.Maimone MM, Tollefsen DM. Structure of a dermatan sulfate hexasaccharide that binds to heparin cofactor II with high affinity. J Biol Chem. 1990;265:18263–18271. [PubMed] [Google Scholar]